. 2022 Mar 21;50(5):2587-2602.
doi: 10.1093/nar/gkac083.

The acetyltransferase p300 is recruited in trans to multiple enhancer sites by lncSmad7

Affiliations

The acetyltransferase p300 is recruited in trans to multiple enhancer sites by lncSmad7

Mara Maldotti et al. Nucleic Acids Res. .

Abstract

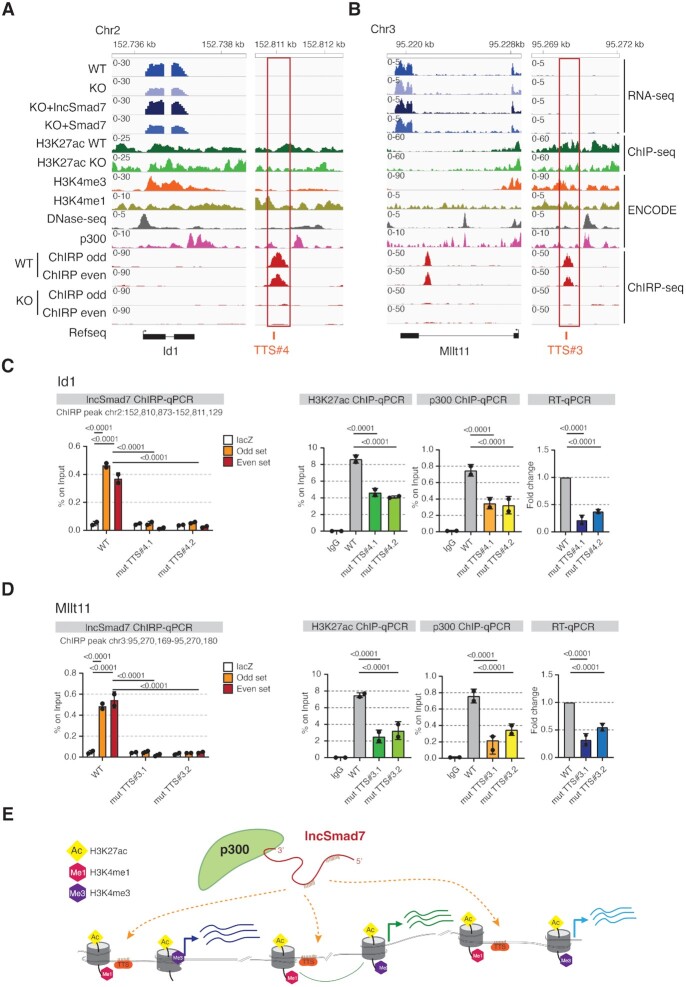
The histone acetyltransferase p300 (also known as KAT3B) is a general transcriptional coactivator that introduces the H3K27ac mark on enhancers triggering their activation and gene transcription. Genome-wide screenings demonstrated that a large fraction of long non-coding RNAs (lncRNAs) plays a role in cellular processes and organ development although the underlying molecular mechanisms remain largely unclear (1,2). We found 122 lncRNAs that interacts directly with p300. In depth analysis of one of these, lncSmad7, is required to maintain ESC self-renewal and it interacts to the C-terminal domain of p300. lncSmad7 also contains predicted RNA-DNA Hoogsteen forming base pairing. Combined Chromatin Isolation by RNA precipitation followed by sequencing (ChIRP-seq) together with CRISPR/Cas9 mutagenesis of the target sites demonstrate that lncSmad7 binds and recruits p300 to enhancers in trans, to trigger enhancer acetylation and transcriptional activation of its target genes. Thus, these results unveil a new mechanism by which p300 is recruited to the genome.


Figures

Figure 1.
Figure 1.
p300 C-terminal domain binds lncRNAs in ESCs. (A) PAR-CLIP pie chart showing the categories of p300-associated transcripts in the nucleus of ESCs. (B) lncSmad7 RAP-enriched p300 in ESCs. Western blot showing the levels of endogenous p300 pulled down with streptavidin beads by using lncSmad7 antisense biotinylated oligonucleotides. A set of antisense biotinylated probes against lacZ serves as negative control. Bars represent the mean and SD of n = 2 independent experiments. P values calculated against control condition for each experiment by using t-test (*P < 0.05; **P < 0.005; ***P < 0.0005, ****P < 0.0001). (C) Pull-down assays reporting the lncSmad7 association with p300. lncSmad7 and lacZ RNA fragments were biotinylated by in vitro transcription, refolded, and incubated with ES nuclear lysates. Top: schematic representation of lncSmad7 fragments used in the RNA-pull down assay. Bottom: Western blot of p300 in nuclear samples pulled-down by lncSmad7 biotinylated fragments. lacZ transcript serves as an internal control. (D) IGV screenshot of lncSmad7 transcript from two pooled p300 PAR-CLIP biological replicates in ESCs. The box highlights the interaction site indicating the p300 binding sequence. p300 and IgG PAR-CLIP are scaled to the same level. The histone modifications mark the lncSmad7 promoter and gene body. H3K4me3 and H3K36me3 are from ENCODE ChIP dataset. The lncSmad7 sequence interacting with p300 is reported in blue from PARalyzer analysis. (E) Schematic representation of p300 structure and the Flag-tagged constructs used in the RNA-protein interaction assay. (F) Flag-tagged RIP of p300 domains in ESCs followed by RT-qPCR. lncSmad7 association with p300 N-terminal (1–1047 aa), p300 HAT (1048–1663 aa), p300 C-terminal (1664–2414 aa). Gapdh used as negative control. The analysis is normalized to ESCs transfected with empty Flag overexpression vectors (Flag-mock). Bars represent the mean and SD of n = 4 independent experiments. P values calculated against Flag-mock condition for each experiment by using ANOVA test (*P < 0.05; **P < 0.005; ***P < 0.0005, ****P < 0.0001). Primers used are reported in Supplementary Table S4.
Figure 2.
Figure 2.
Chromatin-enriched lncSmad7 is involved in ESC pluripotency. (A) RNA fluorescent in situ hybridization (RNA-FISH) of lncSmad7 in ESCs. lncSmad7 KO ESCs serves as negative control. Representative confocal images are depicted as a composite image of green channel (lncSmad7) and blue channel (DAPI) as well as merged channels. DAPI serves as a nuclear counterstain. Scale bar: 10 μm. (B) Expression analysis of lncSmad7 in subcellular fractionation of ESCs by RT-qPCR. Percentage ratio of lncSmad7 in chromatin (green), nuclear (blue) and cytoplasmic (gray) over the whole total lncSmad7 expression levels represents the distribution of lncSmad7 in ESCs. Internal controls of subcellular fractionation are U1 for nucleus and β-actin for cytoplasm. Bars represent the mean and SD of n = 3 independent experiments. Primers used are reported in Supplementary Table S4. (C) Alkaline phosphatase (AP) staining of WT, lncSmad7 KO cells and rescued ESC colonies. Shown rescued condition refers to lncSmad7 KO cells transiently transfected with the full-length lnSmad7 cloned into pCCLsin.PPT.hPGK vector. Top: Representative images of clonal assay performed in ESCs. Bottom: quantification of AP positive and AP negative cells. Bars represent the mean and SD of n = 3 independent experiments. P values calculated against WT condition for each experiment by using ANOVA test (*P < 0.05; **P < 0.005; ***P < 0.0005, ****P < 0.0001). (D) Immunostaining for the pluripotency marker Oct4 in WT, lncSmad7 KO ESCs and rescued ESCs. Shown rescued condition refers to lncSmad7 KO cells transiently transfected with the full-length lnSmad7 cloned into pCCLsin.PPT.hPGK vector. Representative images of two independent experiments as shown.
Figure 3.
Figure 3.
lncSmad7 regulates Smad7 expression by forming RNA–DNA triplexes. (A) Heatmap representing the expression levels of protein-coding genes within lncSmad7 locus (1 Mb) in WT, lncSmad7 KO and rescued ESCs from the RNA-seq data. Shown rescued condition refers to lncSmad7 KO ESCs transiently transfected with the full-length lnSmad7 cloned into pCCLsin.PPT.hPGK vector. Expression values from two biological replicates (#1 and #2) are represented as CPM. Scale of red indicates the expression levels. (B) IGV profiles of lncSmad7 and Smad7 transcripts associated with histone modification mapped reads in ESCs. lncSmad7 and Smad7 RNA-seq profiles in lncSmad7 KO cells and in transfected ESCs with lncSmad7 (KO + lncSmad7) compared to WT ESCs from two biological replicates. The H3K27ac ChIP-seq profiles represent the pooled of two independent experiments from WT and lncSmad7 KO conditions, respectively. The polyA insertion site in the third exon of lncSmad7 is highlighted in green. The TTS are indicated in red bars. All the conditions are scaled to the same level. The Smad7 enhancer region is highlighted by red box. RNA-seq and ChIP-seq of H3K27ac are from the present work and are scaled to the same group levels. ChIP-seq of H3K4 methylations, DNase-seq and p300 are from ENCODE. TTS, Triplex Target DNA sites. (C) Electrophoretic Mobility Shift Assays (EMSA) showing the mobility of lncSmad7 TFS#1 (left) and TFS#2 (right) with biotin-labeled dsDNA probes according to Triplexator prediction. For each TFS are shown: incubation of increasing amounts (80- and 40- fold molar excess) of lncSmad7 TFS#1 and TFS#2 with biot-dsDNA probes containing triplex target sites (TTS), respectively. Reactions with biot- dsDNA probes and a 40-molar excess of TFS treated with 0.5 U RNase H (H) or with 0.5 ng RNase A (A). TFS, Triplex Forming Site. (D) Quantification by qPCR of lncSmad7-associated DNA via Hoogsteen base pairing. Schematic view of transcribed biotinylated last 1kb of lncSmad7 (1735–2687 nt) harboring Triplex Forming Site (TFS), TFS#1 and TFS#2, used to capture the indicated DNA double-stranded region near the Smad7 enhancer. Biotinylated RNA used as negative control highlighted in gray. The dashed arrow lines represent the DNA regions: the DNA containing the TTS not treated and generated in the presence of deaza-7-dATP and deaza-7-dGTP and an intronic region as negative control. Bars represent the mean and SD of n = 4 independent experiments. P values calculated against NT condition for each experiment by using ANOVA test (*P < 0.05; **P < 0.005; ***P < 0.0005, ****P < 0.0001). Primers used are reported in Supplementary Table S4. (E) Schematic representation of WT and TFS mutants (mutTFS#1 and mutTFS#2) of lncSmad7. Black boxes represent exons, gray box indicates the part3 of lncSmad7 (1735–2687 nt) showing the validated TFS#1 and TFS#2 with the WT sequences in black, mutated nucleotides in blue. (F) qPCR analysis of p300 ChIP experiments in WT, lncSmad7 KO and rescued ESCs. lncSmad7 KO ESCs are transiently transfected with WT lncSmad7 fragment (1735–2687 nt, part3) and TFS mutants (mut TFS#1 and mut TFS#2) of part3 (1735–2687 nt). The data are expressed as a percentage of the DNA inputs. Bars represent the mean and SD of n = 4 independent experiments. P values calculated against WT condition for each experiment by using ANOVA test (*P < 0.05; **P < 0.005; ***P < 0.0005, ****P < 0.0001). Primers used are reported in Supplementary Table S4. (G) RT-qPCR analysis showing the Smad7 levels after ectopic expression of mut TFS#1 and mut TFS#2 of lncSmad7 (1735–2687 nt, part3) in lncSmad7 KO ESCs. The analysis is normalized to β-actin as reference gene and on the WT condition. Bars represent the mean and SD of n = 4 independent experiments. P values calculated against control condition for each experiment by using ANOVA test (*P < 0.05; **P < 0.005; ***P < 0.0005, ****P < 0.0001). Primers used are reported in Supplementary Table S4.
Figure 4.
Figure 4.
Trans-acting lncSmad7 binds chromatin to acetylate enhancer regions. (A) Venn diagram showing the number of differentially expressed genes that are down-regulated in lncSmad7 KO ESCs and rescued by lncSmad7 expression and/or Smad7 expression. The putative targets of lncSmad7 were identified using the lncSmad7 KO condition as reference and selecting genes significantly upregulated (log FC > 0.5 and FDR < 0.05) in the WT contrast, significantly upregulated in KO + lncSmad7-KO and excluding genes that were significantly upregulated in KO + Smad7-KO. (B) Barplot comparing the number of ChIRP-seq peaks predicted to be bound by lncSmad7 (at different score cutoff) with the expected number according to analogous random regions. (C) Annotation of lncSmad7 binding site across genomic regions using the Genomic Association Test (GAT) software (32). Left panel: lncSmad7 ChIRP-seq peak enrichment and depletion in histone modifications marked regions. Right panel: lncSmad7 ChIRP-seq peaks enrichment and depletion in Candidate cis-Regulatory Elements (cCRE) for ESC cell line E14 available from the SCREEN database. (D) Heatmap of ±5 kb genomic windows centered on lncSmad7 ChIRP-seq peaks from WT and lncSmad7 KO ESCs showing promoters/enhancers (from encode cCREs) near (1 kb) lncSmad7 ChIRP peaks with H3K27ac and H3K4me3 encode histone data. Random lncSmad7 ChIRP-seq peaks as control. (E) Barplot showing Odds Ratios of Fisher's Exact Test for over-representation of direct regulatory evidences occurring in genes that are down-modulated upon lncSMAD7 deletion, with respect to genes that are not transcriptionally affected. ChIRP = presence of a ChIRP-seq peak nearby the respective gene promoter or associated enhancer, marked by H3K7ac. ChIRP + reduced H3K27ac in KO = ChIRP-seq peak nearby a promoter or enhancer coupled with significantly reduced levels of H3K27ac signals in KO with respect to WT samples (P-value = 2.12e–14). (F) Heatmap showing the expression (Z-score, logCMP) of some representative lncSmad7 target genes in WT, lncSmad7 KO and rescued conditions (KO + lncSmad7 and KO + Smad7) from two independent experiments in ESCs. For each lncSmad7 target gene, gene expression levels, H3K27 acetylation value and RNA–DNA triplex forming score of regulatory regions are shown.
Figure 5.
Figure 5.
lncSmad7 regulate acetylation levels by forming RNA-DNA triplexes. (A, B) Genomic view of two selected lncSmad7 target transcripts, Id1 and Mllt11, with the associated enhancer regions in ESCs, respectively. The enhancer regions are highlighted by red boxes. The TTS regions at the level of lncSmad7 ChIRP peaks are indicated in red bars. RNA-seq and ChIP-seq of H3K27ac are represented as pooled of two independent experiments and are scaled to the same level. RNA-seq, H3K27ac ChIP-seq and ChIRP-seq are from the present work, ChIP-seq of H3K4 methylations, p300 and DNase-seq are from ENCODE. (C, D) qPCR analysis of Id1 and Mllt11 mutant TTS clones (#4.1, #4.2 and #3.1, 3.2#, respectively) compared to the WT on the indicated Id1 and Mllt11 enhancer regions regulated by lncSmad7. lncSmad7 ChIRP-qPCR of lncSmad7 binding on Id1 and Mllt11 selected peaks from mutant TTS clones respect to the WT. Data are representative of ChIRP odd and ChIRP even compared to lacZ and Input samples. Bars represent the mean and SD of n = 2 independent experiments. P values calculated against control condition for each experiment by using t-test (*P < 0.05; **P < 0.005; ***P < 0.0005, ****P < 0.0001). qPCR analysis of H3K27ac and p300 ChIP experiments from Id1 and Mllt11 mutant TTS clones compared to the WT. The ChIP-qPCR data are expressed as a percentage of the DNA inputs. RT-qPCR analysis showing the Id1 and Mllt11 expression levels in mutant TTS clones compared to the WT ESCs. The analysis is normalized to β-actin and on the WT condition. Bars represent the mean and SD of n = 2 independent experiments. P values calculated against WT condition for each experiment by using t-test (*P < 0.05; **P < 0.005; ***P < 0.0005, ****P < 0.0001). Primers used are reported in Supplementary Table S4. (E) Model of p300 recruitment by lncSmad7 on genomi loci. The enhancers and promoters are marked by histone modifications. The RNA–DNA triplexes derived from the indicate regions in the lncSmad7 transcripts (brown bars) and the TTS regions near the enhancers (orange) of target genes.

References

    1. Joung J., Engreitz J.M., Konermann S., Abudayyeh O.O., Verdine V.K., Aguet F., Gootenberg J.S., Sanjana N.E., Wright J.B., Fulco C.P.et al. .. Genome-scale activation screen identifies a lncRNA locus regulating a gene neighbourhood. Nature. 2017; 548:343–346. - PMC - PubMed
    1. Sarropoulos I., Marin R., Cardoso-Moreira M., Kaessmann H.. Developmental dynamics of lncRNAs across mammalian organs and species. Nature. 2019; 571:510–514. - PMC - PubMed
    1. Eckner R., Ewen M.E., Newsome D., Gerdes M., DeCaprio J.A., Lawrence J.B., Livingston D.M.. Molecular cloning and functional analysis of the adenovirus E1A-associated 300-kD protein (p300) reveals a protein with properties of a transcriptional adaptor. Gene Dev. 1994; 8:869–884. - PubMed
    1. Chrivia J.C., Kwok R.P.S., Lamb N., Hagiwara M., Montminy M.R., Goodman R.H.. Phosphorylated CREB binds specifically to the nuclear protein CBP. Nature. 1993; 365:855–859. - PubMed
    1. Sheikh B.N., Akhtar A.. The many lives of KATs — detectors, integrators and modulators of the cellular environment. Nat. Rev. Genet. 2019; 20:7–23. - PubMed

Publication types

MeSH terms

LinkOut - more resources