. 2022 Feb 28;50(4):2143-2156.
doi: 10.1093/nar/gkac069.

Transcription-replication coordination revealed in single live cells

Affiliations

Transcription-replication coordination revealed in single live cells

Ioannis Tsirkas et al. Nucleic Acids Res. .

Abstract

The coexistence of DNA replication and transcription during S-phase requires their tight coordination to prevent harmful conflicts. While extensive research revealed important mechanisms for minimizing these conflicts and their consequences, little is known regarding how the replication and transcription machinery are coordinated in real-time. Here, we developed a live-cell imaging approach for the real-time monitoring of replisome progression and transcription dynamics during a transcription-replication encounter. We found a wave of partial transcriptional repression ahead of the moving replication fork, which may contribute to efficient fork progression through the transcribed gene. Real-time detection of conflicts revealed their negative impact on both processes, leading to fork stalling or slowdown as well as lower transcription levels during gene replication, with different trade-offs observed in defined subpopulations of cells. Our real-time measurements of transcription-replication encounters demonstrate how these processes can proceed simultaneously while maintaining genomic stability, and how conflicts can arise when coordination is impaired.


Figures

Figure 1.
Figure 1.
Real-time monitoring of replisome progression and transcription dynamics at the same locus in single live cells. (A and B) Schematic illustration of the experimental system. Replisome progression is monitored using two bacterial operator arrays, 256xlacO and 224xtetO, integrated downstream of an active and isolated origin of replication (ARS413) and labeled by LacI-Halo-SiR and TetR-tdTomato. For simplicity, only replisome progression toward the arrays is shown. During DNA replication, duplication of the operator arrays leads to the recruitment of additional fluorescently labeled repressors, resulting in an increase in fluorescence intensity (B, top left). The difference between the midpoint increases in fluorescence due to lacO and tetO array duplication (ΔT) is an indicator of the time required to replicate the mid-array distance. Transcription is monitored using GAL10 containing 14xPP7 repeats at the 5′ UTR, integrated between the two arrays (only HO orientation is shown here (A)). Binding of PCP-Envy to PP7-GAL10 transcripts allows the live-cell detection of transcription bursts during DNA replication and cell cycle progression (B, top right). Real-time monitoring of replisome progression and transcription dynamics is enabled by the simultaneous measurements of replication and transcription fluorescent signals (B, bottom). (C) Representative cell with labeled lacO and tetO arrays visible as LacI-Halo-SiR and TetR-tdTomato dots. Transcription bursts are visible as PCP-Envy dots that colocalize with the labeled arrays; scale bar is 2 μm.
Figure 2.
Figure 2.
Replication fork progression measured in the presence or absence of GAL10 transcription. (A) Top: Schematic representation of DNA replication from ARS413 (blue) through GAL10 (green) located at an origin-distal location, in CoD and HO orientations relative to fork progression. Bottom: Replication times in origin-distal CoD (blue) and HO (orange) cells, in either the absence (uninduced, 97 cells for CoD and 100 cells for HO) or presence (induced, 92 cells for CoD and 98 cells for HO) of GAL10 transcription. (B) Same as (A) but for GAL10 located at an origin-proximal location in either the absence (uninduced, 101 cells for CoD and 94 cells for HO) or presence (induced, 105 cells for CoD and 95 cells for HO) of GAL10 transcription.
Figure 3.
Figure 3.
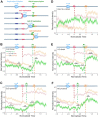
GAL10 transcription dynamics during replisome progression. (A) Schematic representation of replisome progression from ARS413 during GAL10 transcription. (B) Normalized fluorescent intensity of the transcription site (PCP-Envy dot) as well as the lacO and tetO arrays (lacI-Halo-SiR and tetR-tdTomato dots, respectively), averaged over 87 cells from a strain with GAL10 in a CoD orientation. The time axis is normalized according to the duplication times of the arrays. Shaded areas represent standard error of the mean. Dashed vertical lines represent the duplication times of the two arrays and the GAL10 gene. Dashed black lines represent a fit of the transcription intensity data to a sigmoidal function (see Table 1 for the distance between the phase transition midpoints and the GAL10 gene). The average transcription levels within the labeled L1, L2 and L3 time windows (see Supplementary Table S1 for the extent of each time window) are significantly different from each other (see Supplementary Figure S4). (C) Similar to (B) but for 97 cells containing GAL10 in a CoD orientation in an origin-proximal location. (D) Similar to (B) but for 56 cells containing GAL10 at the URA3 locus, rather than between the lacO and tetO arrays, such that transcription levels do not correspond to replisome location in the ARS413-adjacent replicon. (E and F) similar to (B) but for cells containing GAL10 in a HO orientation, in an origin-distal (E, 89 cells) or origin-proximal (F, 90 cells) location.
Figure 4.
Figure 4.
Simultaneous transcription from the two GAL10 gene copies following gene replication. Transcription was measured in the absence of cohesion (Smc1-AID) to detect GAL10 transcription from the two sister chromatids following gene replication. (A) Images of representative yeast cells at G2 containing GAL10 at the CoD orientation in the absence of cohesion. Sister chromatid separation is monitored by the appearance of two dots of TetR-tdTomato and LacI-Halo-SiR during G2 phase (left). One or two dots of PCP-Envy (middle) that colocalize with the replication dots (right) show transcription from one or two copies of GAL10, respectively; scale bar is 2 μm. (B) Percentage of time points where 0, 1 or 2 GAL10 transcription dots are detected out of 2688 and 1897 observations from 40 CoD and 30 HO cells, respectively.
Figure 5.
Figure 5.
Replication fork progression and transcription dynamics in rpb1-1 cells. (A) Replication times for rpb1-1 CoD (blue) and HO cells (orange) measured under uninduced or induced conditions (uninduced, 98 cells for CoD and 110 cells for HO, induced, 100 cells for CoD and 97 cells for HO). (B) Normalized fluorescent intensity of the transcription site and arrays, as described in Figure 3B, averaged over 92 cells from a rpb1-1 HO strain. (C and D) Normalized fluorescent intensity of the transcription site and arrays for a subpopulation of 45 cells that showed faster than median replication times (C) and a subpopulation of 47 cells that showed slower than median replication times (D). See Table 1 for the distance between the phase transition midpoints and the GAL10 gene. See Supplementary Figure S9 for transcription levels within the labeled L1–L4 time windows and their statistical significance, see Supplementary Table S1 for the extent of each time window. All experiments were performed at 30°C.
Figure 6.
Figure 6.
Replication fork progression and transcription dynamics in top1Δ cells. (A) Replication times for top1Δ cells in CoD or HO orientations, the corresponding results for WT cells are shown for comparison. Significant slowdown in replication is observed for the top1Δ cells relative to the WT cells (105 cells for WT and 122 cells for the top1Δ CoD, and 95 cells for WT and 97 cells for the top1Δ HO). (B and C) Normalized fluorescent intensity of the transcription site and arrays, as described in Figure 3B, averaged over 99 cells from a top1Δ CoD strain (B) and 93 cells from a top1Δ HO strain (C). See Table 1 for the distance between the phase transition midpoints and the GAL10 gene. See Supplementary Figure S11 for transcription levels within the labeled L1–L4 time windows and their statistical significance and see Supplementary Table S1 for the extent of each time window. (D) Number of RNAs at the transcription sites in WT and top1Δ cells determined using smFISH. The median values (white dots) for each strain are noted, and the boxes indicate the 25–75% percentile of the population. The number of cells analyzed is 52 472 for WT CoD, 18 094 for top1Δ CoD, 48 140 for WT HO and 24 682 for top1Δ HO strain. The corresponding results for WT cells (Supplementary Figure S6) are shown as a comparison.

Similar articles

Cited by

References

    1. Spellman P.T., Sherlock G., Zhang M.Q., Iyer V.R., Anders K., Eisen M.B., Brown P.O., Botstein D., Futcher B.. Comprehensive identification of cell cycle-regulated genes of the yeast saccharomyces cerevisiae by microarray hybridization. Mol. Biol. Cell. 1998; 9:3273–3297. - PMC - PubMed
    1. Voichek Y., Bar-Ziv R., Barkai N.. Expression homeostasis during DNA replication. Science (80-.). 2016; 351:1087–1090. - PubMed
    1. Hamperl S., Cimprich K.A.. Conflict resolution in the genome: how transcription and replication make it work. Cell. 2016; 167:1455–1467. - PMC - PubMed
    1. Gómez-González B., Aguilera A.. Transcription-mediated replication hindrance: a major driver of genome instability. Genes Dev. 2019; 33:1008–1026. - PMC - PubMed
    1. García-Muse T., Aguilera A.. Transcription-replication conflicts: how they occur and how they are resolved. Nat. Rev. Mol. Cell Biol. 2016; 17:553–563. - PubMed

Publication types