. 2022 Mar;13(6):811-823.
doi: 10.1111/1759-7714.14324. Epub 2022 Feb 8.

Recruitment of IL-1β-producing intermediate monocytes enhanced by C5a contributes to the development of malignant pleural effusion

Affiliations

Recruitment of IL-1β-producing intermediate monocytes enhanced by C5a contributes to the development of malignant pleural effusion

Lisha Luo et al. Thorac Cancer. 2022 Mar.

Abstract

Background: Monocytes are involved in tumor growth and metastasis, but the distribution of monocyte phenotypes and their role in the development of malignant pleural effusion (MPE) remains unknown.

Methods: A total of 94 MPE patients (76 diagnosed with adenocarcinoma lung cancer and 18 with squamous cell lung cancer) and 102 volunteers for health examination in Xiangya Hospital from December 2016 to December 2019 were included in the study.

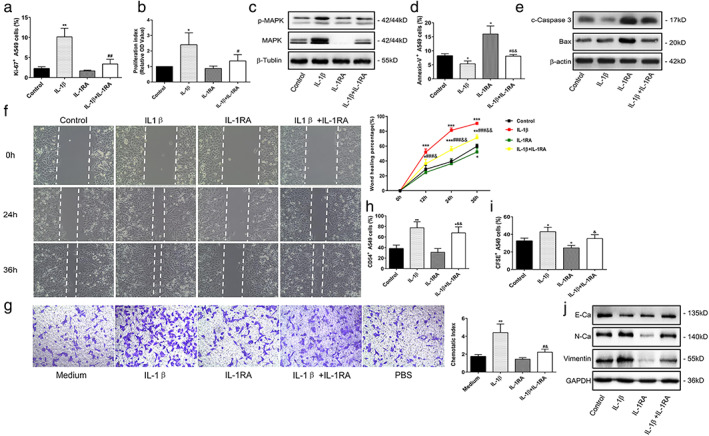
Results: The distribution of monocyte subtypes identified by the expression of CD14 and CD16 were analyzed by flow cytometry. The proportion of CD14++ CD16+ intermediate monocytes were significantly increased in pleural effusion of MPE patients. The complement system components were assayed by immunohistochemistry and ELISA, and higher expression of the classical and alternative pathways were detected in malignant pleural tissue. Transwell assay further revealed that C5a enhanced the infiltration of intermediate monocytes into the pleural cavity by promoting CCL2 production in pleural mesothelial cells (PMCs). In addition, C5a promoted the secretion of IL-1β by intermediate monocytes. Furthermore, C5a activated in intermediate monocytes and IL-1β released after C5a stimulation by monocytes promoted the proliferation, migration, adhesion, and epithelial-to-mesenchymal transition (EMT) of tumor cells, and attenuated tumor cell apoptosis.

Conclusions: C5a, activated by the classical and alternative pathways of the complement system, not only mediated the infiltration of intermediate monocytes by enhancing CCL2 production in PMCs but also induced IL-1β release from the recruited monocytes in MPE. The consequence of C5a activation and the subsequent IL-1β overexpression in intermediate monocytes contributed to MPE progression.

Keywords: A549; C5a; IL-1β; malignant pleural effusion; monocytes.


Conflict of interest statement

All authors: No potential conflicts of interest. All authors have submitted the ICMJE Form for Disclosure of Potential Conflicts of Interest. Conflicts that the editors consider relevant to the content of the manuscript have been disclosed.

Figures

FIGURE 1
FIGURE 1
Increased CD14++ CD16+ intermediate monocytes in MPE patients (a) absolute counts and percentages of total monocytes and lymphocytes in blood samples from MPE patients and healthy subjects. (n malignant = 94, n healty = 102). (b) Flow cytometry analysis of percentages of total monocytes in pleural effusion and blood from MPE patients (n malignant = 10, n transudate = 10). (c) Representative flow cytometry dot plots showing monocyte subsets in patients with malignant and transudate pleural effusion. Monocytes were first identified within SSC‐Ahi FSC‐Ahi cells and subsequently gated for either CD14++CD16, CD14++CD16+ or CD14+CD16+ subsets. (d) Summary data of monocytes subsets in pleural effusion and blood samples (n MPE = 10, n transudate = 6). *Vs. transudate pleural effusion and blood. *p < 0.05. #Vs corresponding blood, # p < 0.05
FIGURE 2
FIGURE 2
Complement system classical and alternative pathways were activated in patients with malignant pleurisy. (a) Representative immunohistochemistry staining images of pleurisy tissues from MPE patients. Three complement pathway components, including C1q, factor B, MBL, factor H, factor P, C3a, C5a, and SC5b‐9 (original magnification,×200) were detected. (b) The concentrations of complement components from pleural effusion were measured by ELISA (n MPE = 16, n transudate = 16)
FIGURE 3
FIGURE 3
C5a enhanced the recruitment of CD14++CD16+ intermediate monocytes through CCL2/CCR2 axis in MPE. (a) Expression levels of chemokines CCL2, CCL7, and CX3CL1 in pleural effusion were measured by ELISA (n MPE = 16, n transudate = 16). (b) Representative immunofluorescence images of CCL2‐CCR2 and C5a‐C5aR coexpression in PMCs and CD14++CD16+ monocytes from malignant pleural effusion (×200). (c) Real‐time qPCR analysis of chemokines and their receptors expression in CD14++CD16+ monocytes (n MPE = 10, n transudate = 6) and PMCs (n MPE = 5, n transudate = 5) from pleural effusion. The expression levels of target genes were normalized to housekeeping gene GAPDH. *Versus. transudate group, **p < 0.01, ***p < 0.0001. (d) The expression of CCL2 in PMCs after treatment with either C5a, C5aRA, or C5a and C5aRA was analyzed by real‐time qPCR (n = 3). *Versus control group, **p < 0.01.#Versus C5a group, # p < 0.05. &Versus C5aRA group, & p < 0.05, && p < 0.01. (e) The concentration of CCL2 in PMCs after treatment with either C5a, C5aRA, or C5a and C5aRA was analyzed by ELISA (n = 3). *Versus control. **p < 0.01. #Versus C5a group, ## p < 0.01. &Versus C5aRA group, & p < 0.05. (f) Representative chemotaxis images of CD14++CD16+ monocytes cultured in supernatants from PMCs. The supernatants were added with either isotype IgG, anti‐CCL2, or PBS in the bottom chamber of transwells (×200). *Versus PBS group, *p < 0.05, **p < 0.01. #Versus PMCs group. # p < 0.05
FIGURE 4
FIGURE 4
C5a–C5aR axis promoted IL‐1β production in CD14++CD16+ intermediate monocytes. (a) The concentrations of inflammatory cytokines (IL‐1β, IL‐17, IL‐27, and IFN‐γ) in pleural effusion were measured by ELISA (nMPE = 16; ntransudate = 16). (b) The expression levels of inflammatory cytokines (IL‐1β, IL‐17, IL‐27, and IFN‐γ) in intermediate monocytes were measured by qRT‐PCR (nMPE = 16; ntransudate = 16). (c) The expression levels of IL‐1β in CD14++CD16+ intermediate monocytes after either C5a or C5aRA treatment (n = 3) in the presence of LPS were measured by qRT‐PCR. *Versus control group, *p < 0.05. #Versus C5a group, # p < 0.05. (d) The expression levels of IL‐1β in CD14++CD16+ intermediate monocytes after either C5a or C5aRA treatment (n = 3) in the presence of LPS were measured by ELISA (n = 3). *Versus control. **p < 0.01. #Versus C5a group, # p < 0.05. &Versus C5aRA group, & p < 0.05
FIGURE 5
FIGURE 5
Role of C5a in the proliferation, apoptosis, migration, invasion, adhesion, and EMT of A549 cells. (a) Ki‐67+ expression was measured by flow cytometry (n = 3) after treatment with either recombinant human C5a, C5aR antagonist (50 nM), or C5a and C5aR. (b) The proliferation index of A549 cells calculated by CCK8 (n = 3). (c) PI3K, p‐PI3K, and AKT expression was detected by Western blot. (d) Ki‐67+ expression was determined by flow cytometry (n = 3) after treatment with or without PI3K inhibitor in the presence of C5a. (e) The proliferation index of A549 cells in the presence of PI3K inhibitor (n = 3). (f) The percentages of apoptotic A549 cells were analyzed by Annexin‐V+ staining in flow cytometry (n = 3). (g) The expression levels of cleaved‐caspase 3 were analyzed by Western blot. (h) Ki‐67+ expression was measured in the presence of DDP by flow cytometry (n = 3). (i) The protein levels of cleaved‐caspase 3 and Bax were detected by Western blot. (j) Microscopic photography of A549 cells after wound induction at 24 and 48 h (×200). Wound healing percentage = (Area0h – Areaxh)/ Area0h × 100%. (k) The chemotaxis of A549 (×200) (n = 3). l) CD54 (I‐CAM) expression was determined by flow cytometry (n = 3). (m) Flow cytometry analysis of CFSE+ cells in the adhesion assay. (n) The protein levels of E‐cadherin, N‐cadherin, and vimentin were detected by Western blot (n = 3). *Versus. control group, *p < 0.05, **p < 0.01, ***p < 0.001. #Versus C5a group, # p < 0.05, ## p < 0.01. &Versus C5aRA group, & p < 0.05, && p < 0.01
FIGURE 6
FIGURE 6
Role of IL‐1β in the proliferation, apoptosis, migration, invasion, adhesion, and EMT of A549 cells. (a) Ki‐67+ A549 cells were determined by flow cytometry (n = 3) after treatment with recombinant human IL‐1β (10 ng/ml), IL‐1R antagonist (20 ng/ml) or their combination. (b) The proliferation index of A549 cells calculated by CCK8 (n = 3). (c) The protein levels of MAPK and p‐MAPK were observed by Western blot. (d) Apoptotic A549 cells were determined by Annexin‐V+ A549 cells (n = 3). (e) The protein levels of cleaved‐caspase 3 and Bax were observed by Western blot after treatment. (f) Microscopic photography of A549 cells after wound induction for 24 and 36 h (×200) (n = 3). (g) The chemotaxis of A549 cells (×200) (n = 3). (h) The CD54 (I‐CAM) expression of A549 was determined by flow cytometry (n = 3). (i) The CFSE+ percentage of total cocultured A549 and PMCs cells were assayed by flow cytometry (n = 3). (j) The protein levels of E‐cadherin, N‐cadherin, and vimentin were observed by Western blot after treatment. *Versus control group, *p < 0.05, **p < 0.01, ***p < 0.001. #Versus IL‐1β group, # p < 0.05, ## p < 0.01, ### p < 0.001. &Versus IL‐1RA group, & p < 0.05, && p < 0.01

References

    1. Walker S, Mercer R, Maskell N, Rahman NM. Malignant pleural effusion management: keeping the flood gates shut. Lancet Respir Med. 2019;8:609–18. 10.1016/S2213-2600(19)30373-X - DOI - PubMed
    1. Light RW. Pleural effusions. Med Clin North Am. 2011;95:1055–70. 10.1016/j.mcna.2011.08.005 - DOI - PubMed
    1. Ye ZJ, Zhou Q, Yin W, Yuan ML, Yang WB, Xiong XZ, et al. Differentiation and immune regulation of IL‐9‐producing CD4+ T cells in malignant pleural effusion. Am J Respir Crit Care Med. 2012;186:1168–79. 10.1164/rccm.201207-1307OC - DOI - PubMed
    1. Ye ZJ, Zhou Q, Zhang JC, Li X, Wu C, Qin SM, et al. CD39+ regulatory T cells suppress generation and differentiation of Th17 cells in human malignant pleural effusion via a LAP‐dependent mechanism. Respir Res. 2011;12:77–87. 10.1186/1465-9921-12-77 - DOI - PMC - PubMed
    1. Ye ZJ, Zhou Q, Yin W, Yuan ML, Yang WB, Xiang F, et al. Interleukin 22‐producing CD4+ T cells in malignant pleural effusion. Cancer Lett. 2012;326:23–32. 10.1016/j.canlet.2012.07.013 - DOI - PubMed

Publication types

MeSH terms