. 2022 Mar;60(3):29.
doi: 10.3892/ijo.2022.5319. Epub 2022 Feb 9.

Doramectin inhibits glioblastoma cell survival via regulation of autophagy in vitro and in vivo

Affiliations

Doramectin inhibits glioblastoma cell survival via regulation of autophagy in vitro and in vivo

Chen Chen et al. Int J Oncol. 2022 Mar.

Abstract

Glioblastoma (GBM) is one of the most widespread and lethal types of cancer. However, there are currently no drugs or therapeutic strategies that can completely cure GBM. Doramectin (DRM) has a broad range of activities against endoparasites and ectoparasites, and is extensively used in livestock. In the present study, the effect of DRM on the induction of autophagy in U87 and C6 GBM and glioma cell lines, as well as the mechanism of autophagy, were examined. First, transmission electron microscopy, plasmid transfection and western blot analysis demonstrated that DRM could induce autophagy in U87 and C6 cells in vitro. Next, MTT and colony formation assays revealed that DRM‑induced autophagy prevented U87 and C6 cell viability and colony formation ratio. In addition, DRM‑induced autophagy promoted U87 and C6 cell apoptosis, as indicated by DAPI analysis and flow cytometry. Furthermore, transcriptome analysis demonstrated that DRM modulated a number of genes and pathways involved in autophagy. In a nude mouse xenograft model, immunohistochemical staining and the TUNEL assay demonstrated that the effect of DRM on the tumor was consistent with that in vivo. These data indicated that DRM induced autophagy mainly by blocking the PI3K/AKT/mTOR signaling pathway in GBM cells. DRM‑induced autophagy promoted the inhibition of GBM cell proliferation and apoptosis in vitro and in vivo. The present study suggested that DRM may be an effective drug for the treatment of GBM.

Keywords: PI3K/AKT/mTOR; apoptosis; autophagy; glioblastoma; transcriptomic analysis.


Conflict of interest statement

The authors declare that they have no competing interests.

Figures

Figure 1
Figure 1
Structure of doramectin.
Figure 2
Figure 2
DRM-induced autophagy in U87 and C6 cells. (A) Transmission electron microscopy revealed autophagosome accumulation in U87 and C6 cells treated with 0 or 15 µM DRM for 48 h. Red arrows indicate autophagosomes. Scale bar, 2 µm. (B) Fluorescence microscopy using GFP-LC3 as a measure of the autophagic response in U87 and C6 cells treated with 0 or 15 µM DRM for 48 h. Scale bar, 20 µm. (C) U87 and C6 cells were transfected with the GFP-LC3 plasmid and empty plasmid, and LC3I/LC3II and β-actin protein expression was examined by western blot, and semi-quantitative analysis of the protein expression levels of LC3I/LC3II and β-actin indifferent groups was performed. (D) U87 cells were treated with different concentrations of DRM (0, 5, 10 and 15 µM) for 48 h. Western blot analysis was performed to detect protein expression levels of Atg5, p62, LC3I/LC3II and β-actin. (E) Graphical representation of semi-quantitative analysis of autophagic proteins in U87 cells. (F) Protein expression level of Atg5, p62, LC3I/LC3II and β-actin in C6 cells treated with different concentrations of DRM (0, 5, 10 and 15 µM) for 48 h, as determined by western blot. (G) Graphical representation of semi-quantitative analysis of autophagic proteins in C6 cells. The results are presented as the mean ± SD, n≥3. *P<0.05, **P<0.01 and ***P<0.001 vs. empty or 0 µM. Atg5, autophagy-related 5; CTR, control; DRM, doramectin; GFP, green fluorescent protein.
Figure 3
Figure 3
Autophagy inhibitsU87 and C6 cell proliferation. (A) CQ induced autophagic protein changes in U87 and C6 cells. Graphical representation of semi-quantitative analysis of autophagic proteins in (B) U87 and (C) C6 cells. (D) Colony formation assay for U87 and C6 cells treated with or without DRM (15 µM) in the absence or presence of CQ (15 µM). (E) Quantitative analysis of colony formation. (F) U87 and C6 cells were treated with or without DRM (15 µM) in the absence or presence of CQ (15 µM) for 48 h. Cell viability was determined using the MTT assay. Results are presented as the mean ± SD, n≥3; *P<0.05, **P<0.01 and ***P<0.001. CQ, chloroquine; CTR, control; DRM, doramectin.
Figure 4
Figure 4
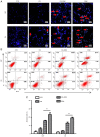
Autophagy promotes the apoptosis of U87 and C6 cells. (A) DAPI staining images of U87 and C6 cells were captured using a fluorescence microscope following treatment with or without DRM (15 µM) in the absence or presence of CQ (15 µM) for 48h. Scale bar, 50 µm. (B) U87 and C6 cells were treated with or without DRM (15 µM) in the absence or presence of CQ (15 µM) for 48 h, and the apoptotic cell ratio was measured by flow cytometry. (C) Graphical representation of quantitative analysis of the apoptotic rate. The results are presented as the mean ± SD of at least three independent experiments. **P<0.01. CQ, chloroquine; CTR, control; DRM, doramectin.
Figure 5
Figure 5
RNA-sequencing of the DRM and control groups. Transcriptome analysis was performed on C6 cells treated with or without DRM (15 µM) for 48 h. (A) Correlation analysis among 6 samples. Different colored squares represent the degree of correlation between the two groups. (B) Volcano plot of significant DEGs. Blue dots represent downregulated DEGs, red dots represent upregulated DEGs and gray dots represent non-DEGs. (C) Venn diagram depicting the number of DEGs. CTR, control; DEGs, differentially expressed genes; DRM, doramectin.
Figure 6
Figure 6
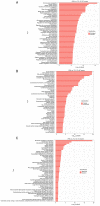
Significantly enriched terms of GO analysis. (A) GO annotation analysis revealed that 50 BPs were altered in DRM-treated C6 cells compared with the control group. (B) GO annotation analysis showed that 50 CCs were altered in DRM-treated C6 cells compared with the control group. (C) GO annotation analysis showed that 50 MFs were altered in DRM-treated C6 cells compared with the control group. BP, biological processes; CC, cell components; CTR, control; DRM, doramectin; GO, Gene Ontology; MF, molecular function.
Figure 7
Figure 7
KEGG pathway analysis of DEGs. KEGG pathway enrichment analyses of DEGs for DRM vs. CTR. The color of the circle indicates the P-value and the size of the circle the number of DEGs. Large red circles indicate a higher enrichment of the pathway and number of DEGs in the pathway. DEGs, differentially expressed genes; DRM, doramectin; KEGG, Kyoto Encyclopedia of Genes and Genomes.
Figure 8
Figure 8
Heat map showing the expression fold changes of autophagy-related differentially expressed genes in DRM-treated C6 cells. CTR, control; DRM, doramectin.
Figure 9
Figure 9
Autophagy pathway in C6 cells treated with doramectin (15 µM). Expression changes of target genes are mapped by colors. Data on KEGG graph. Rendered by pathview. Green represents down regulated DEGs, red represents upregulated DEGs and other colors represent statistical insignificance. DEGs, differentially expressed genes.
Figure 10
Figure 10
DRM suppresses tumor growth in vivo. (A) Body weight of nude mice treated with CTR, CQ, CQ+DRM and DRM. (B) Tumor growth curve of different treatment groups. (C) Size of tumors formed in different groups. (D) Immunohistochemical staining of C6 xenograft tumors was performed to detect Ki-67 expression following DRM treatment. Quantitative analysis of Ki-67-positive cells in xenograft tissues from different groups. Scale bar, 50 or 30 µm. Data are presented as the mean ± SD, n≥3. *P<0.05 and **P<0.01. CQ, chloroquine; CTR, control; DRM, doramectin.
Figure 11
Figure 11
DRM induces autophagy and autophagy promotes apoptosis in vivo. (A) Immunohistochemical staining of C6 xenograft tumors was performed to detect the expression levels of p62 and LC3 following treatment with DRM. Quantitative analysis of p62- and LC3-positive cells in xenograft tissues from different groups was also performed. Scale bar, 50 µm. (B) C6 xenograft tumors were incubated with and without DRM, and the effects of DRM on the levels of p62 and LC3I/LC3II were examined by western blot analysis, and semi-quantitative analysis of p62 and LC3I/LC3II protein expression indifferent groups was performed. (C) A TUNEL assay was used to measure apoptotic C6 cells and calculate the apoptotic index of different groups. Quantitative analysis of positive cells in xenograft tissues from different groups was also performed. Scale bar, 50 µm. Data are presented as the mean ± SD, n≥3. *P<0.05, **P<0.01 and ***P<0.001 vs. control or as indicated. CQ, chloroquine; CTR, control; DRM, doramectin.

References

    1. Hanif F, Muzaffar K, Perveen K, Malhi SM, Simjee ShU. Glioblastoma multiforme: A review of its epidemiology and pathogenesis through clinical presentation and treatment. Asian Pac J Cancer Prev. 2017;18:3–9. - PMC - PubMed
    1. Strom QT, Gittleman H, Xu J, Kromer C, Wolinsky Y, Kruchko C, Barnholtz-Sloan JS. CBTRUS statistical report: Primary brain and other central nervous system tumors diagnosed in the United States in 2009-2013. Neuro Oncol. 2016;18(Suppl 5):v1–v75. doi: 10.1093/neuonc/now207. - DOI - PMC - PubMed
    1. Louis DN, Ohgaki H, Wiestler OD, Cavenee WK, Burger PC, Jouvet A, Scheithauer BW, Kleihues P. The 2007 WHO classification of tumours of the central nervous system. Acta Neuropathol. 2007;114:97–109. doi: 10.1007/s00401-007-0243-4. - DOI - PMC - PubMed
    1. Parsons DW, Jones S, Zhang X, Lin JC, Leary RJ, Angenendt P, Mankoo P, Carter H, Siu IM, Gallia GL, et al. An integrated genomic analysis of human glioblastoma multiforme. Science. 2008;321:1807–1812. doi: 10.1126/science.1164382. - DOI - PMC - PubMed
    1. Ohgaki H, Dessen P, Jourde B, Horstmann S, Nishikawa T, Di Patre PL, Burkhard C, Schüler D, Probst-Hensch NM, Maiorka PC, et al. Genetic pathways to glioblastoma: A population-based study. Cancer Res. 2004;64:6892–6899. doi: 10.1158/0008-5472.CAN-04-1337. - DOI - PubMed