

Gut Microbiome-Targeted Modulations Regulate Metabolic Profiles and Alleviate Altitude-Related Cardiac Hypertrophy in Rats
- PMID: 35138162
- PMCID: PMC8826942
- DOI: 10.1128/spectrum.01053-21
Gut Microbiome-Targeted Modulations Regulate Metabolic Profiles and Alleviate Altitude-Related Cardiac Hypertrophy in Rats
Abstract
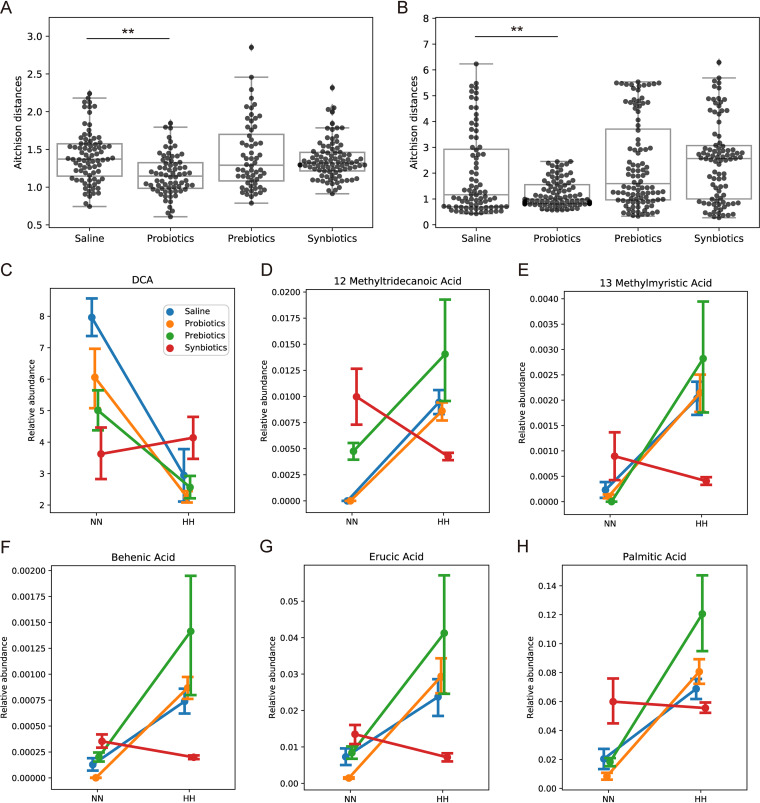
It is well known that humans physiologically or pathologically respond to high altitude, with these responses accompanied by alterations in the gut microbiome. To investigate whether gut microbiota modulation can alleviate high-altitude-related diseases, we administered probiotics, prebiotics, and synbiotics in rat model with altitude-related cardiac impairment after hypobaric hypoxia challenge and observed that all three treatments alleviated cardiac hypertrophy as measured by heart weight-to-body weight ratio and gene expression levels of biomarkers in heart tissue. The disruption of gut microbiota induced by hypobaric hypoxia was also ameliorated, especially for microbes of Ruminococcaceae and Lachnospiraceae families. Metabolome revealed that hypobaric hypoxia significantly altered the plasma short-chain fatty acids (SCFAs), bile acids (BAs), amino acids, neurotransmitters, and free fatty acids, but not the overall fecal SCFAs and BAs. The treatments were able to restore homeostasis of plasma amino acids and neurotransmitters to a certain degree, but not for the other measured metabolites. This study paves the way to further investigate the underlying mechanisms of gut microbiome in high-altitude related diseases and opens opportunity to target gut microbiome for therapeutic purpose. IMPORTANCE Evidence suggests that gut microbiome changes upon hypobaric hypoxia exposure; however, it remains elusive whether this microbiome change is a merely derivational reflection of host physiological alteration, or it synergizes to exacerbate high-altitude diseases. We intervened gut microbiome in the rat model of prolonged hypobaric hypoxia challenge and found that the intervention could alleviate the symptoms of pathological cardiac hypertrophy, gut microbial dysbiosis, and metabolic disruptions of certain metabolites in gut and plasma induced by hypobaric hypoxia. Our study suggests that gut microbiome may be a causative factor for high-altitude-related pathogenesis and a target for therapeutic intervention.
Keywords: 16S rRNA; cardiac hypertrophy; hypobaric hypoxia; metabolome; microbiota.
Conflict of interest statement
The authors declare no conflict of interest.
Figures


Similar articles
-
Alterations in gut microbiota and metabolites associated with altitude-induced cardiac hypertrophy in rats during hypobaric hypoxia challenge.Sci China Life Sci. 2022 Oct;65(10):2093-2113. doi: 10.1007/s11427-021-2056-1. Epub 2022 Mar 14. Sci China Life Sci. 2022. PMID: 35301705
-
The cardiac protection of Baoyuan decoction via gut-heart axis metabolic pathway.Phytomedicine. 2020 Dec;79:153322. doi: 10.1016/j.phymed.2020.153322. Epub 2020 Sep 2. Phytomedicine. 2020. PMID: 32920286
-
Exposure to high altitude leads to disturbances in host metabolic homeostasis: study of the effects of hypoxia-reoxygenation and the associations between the microbiome and metabolome.mSystems. 2025 May 20;10(5):e0134724. doi: 10.1128/msystems.01347-24. Epub 2025 Apr 16. mSystems. 2025. PMID: 40237534 Free PMC article.
-
Gut microbiota and host metabolism in liver cirrhosis.World J Gastroenterol. 2015 Nov 7;21(41):11597-608. doi: 10.3748/wjg.v21.i41.11597. World J Gastroenterol. 2015. PMID: 26556989 Free PMC article. Review.
-
Metabolites Linking the Gut Microbiome with Risk for Type 2 Diabetes.Curr Nutr Rep. 2020 Jun;9(2):83-93. doi: 10.1007/s13668-020-00307-3. Curr Nutr Rep. 2020. PMID: 32157661 Free PMC article. Review.
Cited by
-
Impact of high-altitude acclimatization and de-acclimatization on the intestinal microbiota of rats in a natural high-altitude environment.Front Microbiol. 2024 May 7;15:1371247. doi: 10.3389/fmicb.2024.1371247. eCollection 2024. Front Microbiol. 2024. PMID: 38774503 Free PMC article.
-
The gut microbiota-inflammation-HFpEF axis: deciphering the role of gut microbiota dysregulation in the pathogenesis and management of HFpEF.Front Cell Infect Microbiol. 2025 Mar 13;15:1537576. doi: 10.3389/fcimb.2025.1537576. eCollection 2025. Front Cell Infect Microbiol. 2025. PMID: 40182777 Free PMC article. Review.
-
Association analysis of gut microbiota-metabolites-neuroendocrine changes in male rats acute exposure to simulated altitude of 5500 m.Sci Rep. 2023 Jun 7;13(1):9225. doi: 10.1038/s41598-023-35573-y. Sci Rep. 2023. PMID: 37286697 Free PMC article.
-
Red Ginseng Dietary Fiber Shows Prebiotic Potential by Modulating Gut Microbiota in Dogs.Microbiol Spectr. 2023 Aug 17;11(4):e0094923. doi: 10.1128/spectrum.00949-23. Epub 2023 Jun 27. Microbiol Spectr. 2023. PMID: 37367492 Free PMC article.
-
Plateau Environment, Gut Microbiota, and Depression: A Possible Concealed Connection?Curr Issues Mol Biol. 2025 Jun 25;47(7):487. doi: 10.3390/cimb47070487. Curr Issues Mol Biol. 2025. PMID: 40728956 Free PMC article. Review.
References
Publication types
MeSH terms
Substances
LinkOut - more resources
Full Text Sources
