. 2022 May 17;106(5):1000-1010.
doi: 10.1093/biolre/ioac015.

Irx3 promotes gap junction communication between uterine stromal cells to regulate vascularization during embryo implantation†

Affiliations

Irx3 promotes gap junction communication between uterine stromal cells to regulate vascularization during embryo implantation†

Ryan M Brown et al. Biol Reprod. .

Abstract

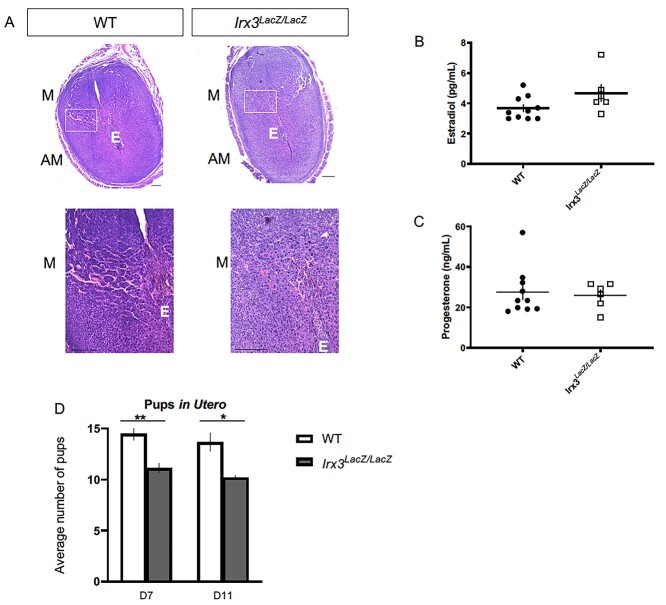
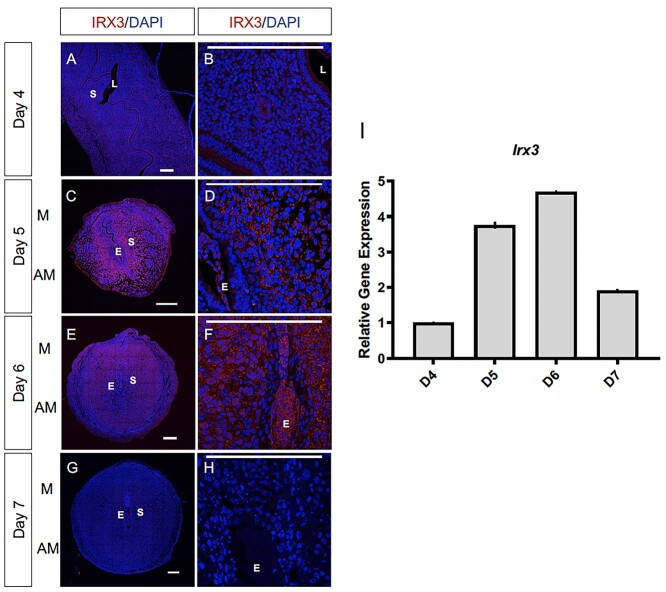
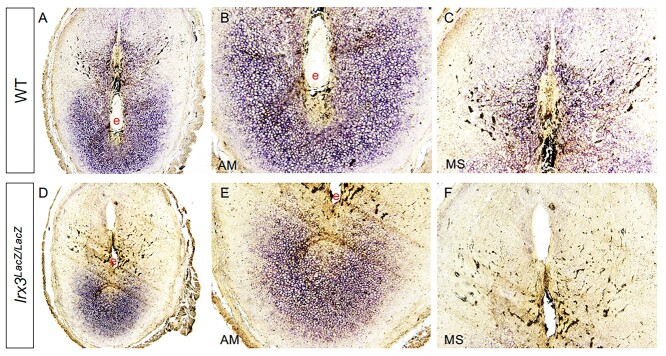
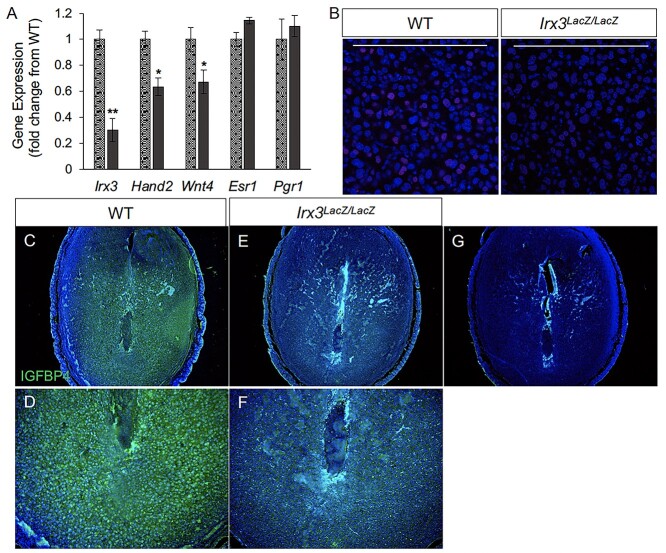
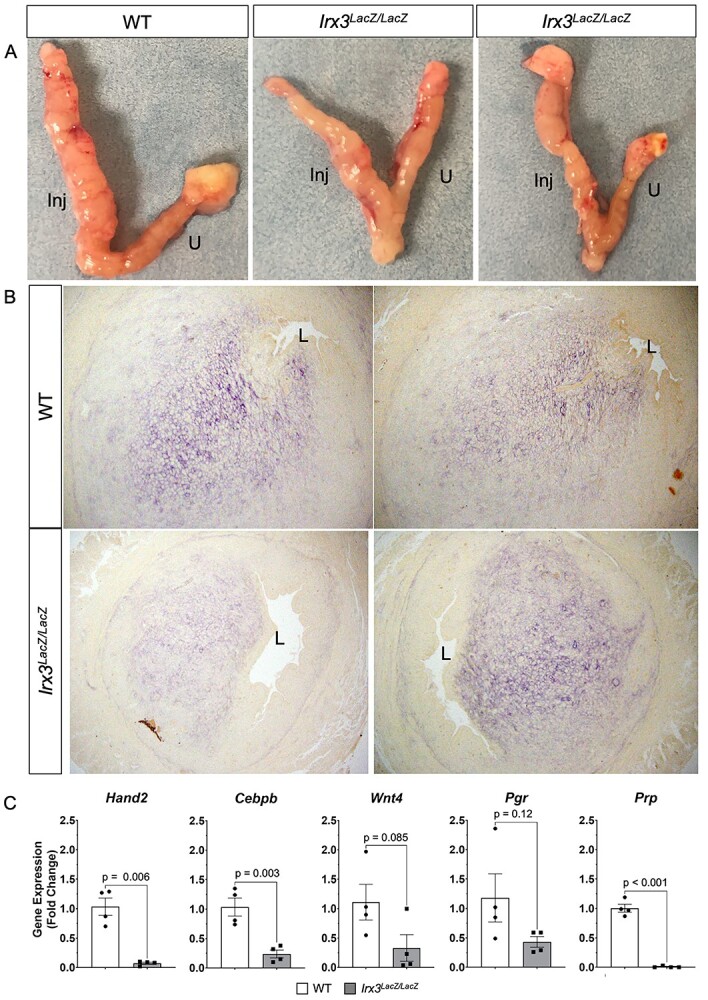
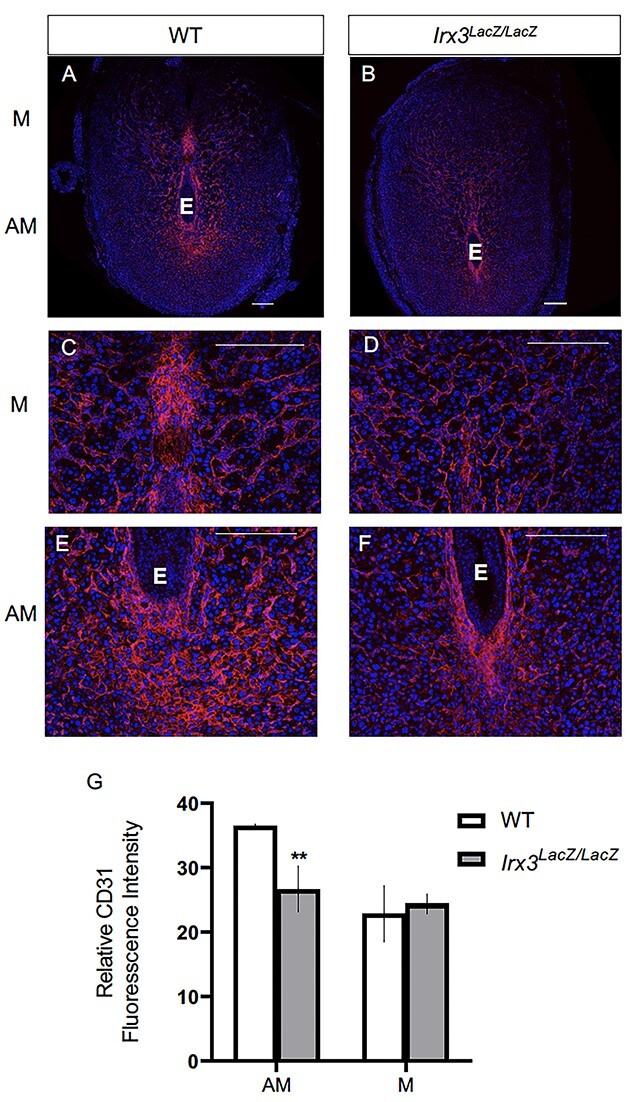
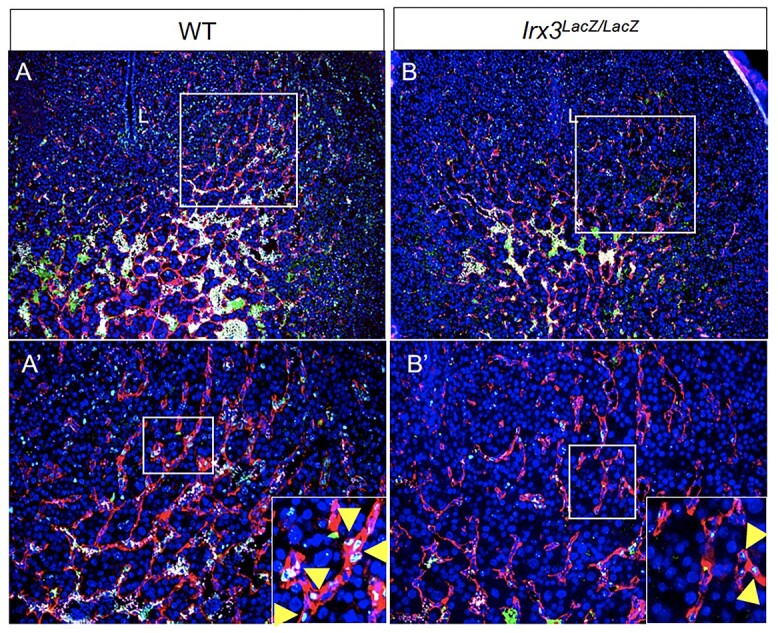
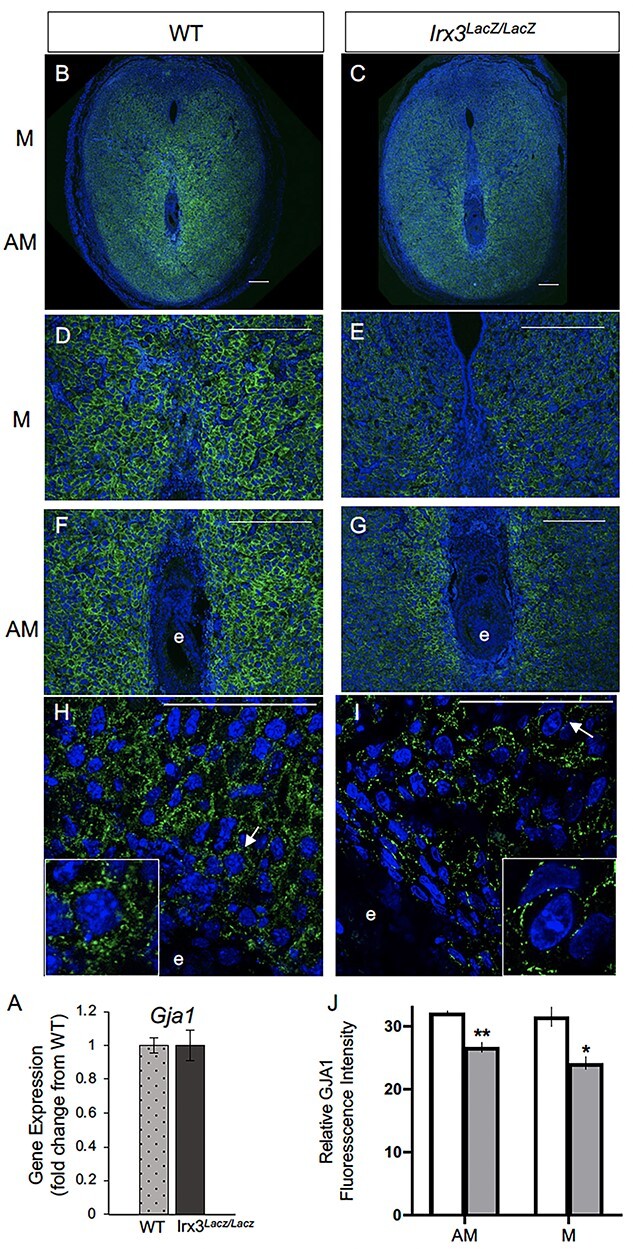
Appropriate embryo-uterine interactions are essential for implantation. Besides oocyte abnormalities, implantation failure is a major contributor to early pregnancy loss. Previously, we demonstrated that two members of the Iroquois homeobox transcription factor family, IRX3 and IRX5, exhibited distinct and dynamic expression profiles in the developing ovary to promote oocyte and follicle survival. Elimination of each gene independently caused subfertility, but with different breeding pattern outcomes. Irx3 KO (Irx3LacZ/LacZ) females produced fewer pups throughout their reproductive lifespan which could only be partially explained by poor oocyte quality. Thus, we hypothesized that IRX3 is also expressed in the uterus where it acts to support pregnancy. To test this hypothesis, we harvested pregnant uteri from control and Irx3 KO females to evaluate IRX3 expression profiles and the integrity of embryo implantation sites. Our results indicate that IRX3 is expressed in the endometrial stromal cells at day 4 of pregnancy (D4) with peak expression at D5-D6, and then greatly diminishes by D7. Further, studies showed that while embryos were able to attach to the uterus, implantation sites in Irx3 KO pregnant mice exhibited impaired vascularization and abnormal expression of decidualization markers. Finally, we also observed an impaired response of the Irx3 KO uteri to an artificial deciduogenic stimulus, indicating a critical role of this factor in regulating the decidualization program. Together, these data established that IRX3 promotes female fertility via at least two different mechanisms: (1) promoting competent oocytes and (2) facilitating functional embryo-uterine interactions during implantation.

Keywords: Angiogenesis; Decidualization; Fertility; Iroquois; Pregnancy; Uterus.


Figures

Figure 1
Figure 1
Irx3LacZ/LacZ causes deficits in uterine vascularization and subfertility. (A) H&E staining of D7 wild type (WT, n = 6) and Irx3LacZ/LacZ (n = 6) pregnant uteri. Scale bars, 250 mm. The white boxes are enlarged in the images below each section. AM: anti-mesometrial; M: mesometrial; E: embryo. (B, C) Circulating estradiol (B) and progesterone (C) were measured at D7 of gestation (WT, n = 10; Irx3LacZ/LacZ, n = 6). (D) Average number of implantation sites in utero at D7 (WT n = 8; Irx3LacZ/LacZ n = 7) and D11 (WT n = 3; Irx3LacZ/LacZ n = 5). Data in D represent the mean ± SEM. Statistics: two-sample t-test, *: P < 0.05; **: P < 0.01.
Figure 2
Figure 2
Irx3 expression coincides with embryo implantation. (A–F) Immunofluorescence of IRX3 (red) co-labeled with DAPI, a nuclear marker (blue) throughout pregnancy days 4–7 (D4–D7) in wild type mice implantation sites (n = 3). Scale bars represent 250 μm. L: lumen; S: stroma; E: embryo; M: mesometrial; AM: anti-mesometrial. (I) Characterization of Irx3 transcripts in the WT pregnant mouse uterus at D4-7. Real-time qPCR was determined by setting the expression level of Irx3 mRNA on D4 of pregnancy to 1.0. Results are reported relative to 36b4 (n = 3). Data represent the mean ± SEM of three biological replicates performed in triplicate at each time point.
Figure 3
Figure 3
Alkaline phosphatase staining is diminished in Irx3LacZ/LacZ implantation sites. Day 7 uterine implantations sites from wild type (WT, A-C, n = 2) and Irx3LacZ/LacZ (D–F, n = 2) females were examined for alkaline phosphatase activity (purple stain). Magnified views of antimesometrial (AM) and mesometrial (MS) domains are shown adjacent to images of the entire implantation site. e: embryo
Figure 4
Figure 4
Decidualization is impaired in pregnant Irx3LacZ/LacZ uteri. (A) Real-time qPCR was performed using total RNA isolated from implantation sites from pregnant uteri of WT (stippled light gray) and Irx3LacZ/LacZ (dark gray) females on day 7 of pregnancy. Data represent the mean ± SEM of three biological replicates performed in triplicate at each time point. Fold change was calculated relative to transcript levels of the WT sample. Statistics: Student’s t-test, *P < 0.05. (B) Immunofluorescence of HAND2, a stromal cell marker (red) co-localized with DAPI, a nuclear marker (blue) at gestation D7 in control (WT, n = 4) and Irx3LacZ/LacZ (n = 3) implantation sites. Scale bars represent 250 mm. (C–F) Immunofluorescence of IGFBP4 (green, DAPI in blue), a marker for decidualized stromal cells at D7 in control (C, D) versus Irx3LacZ/LacZ (E, F) embryonic implantation sites. (D, F) Magnified views of the antimesometrial zone of the implantation sites for control (D) and Irx3LacZ/LacZ (F). (G) No antibody control.
Figure 5
Figure 5
Artificial decidualization is impaired in Irx3LacZ/LacZ uteri. (A) Artificial decidualization was provoked by injection of oil into the left horn of each uterus (Inj); the right horn remained unstimulated (U). WT uteri (left panel, n = 3) compared to Irx3LacZ/LacZ uteri (right panels, n = 2), two examples. (B) Alkaline phosphatase staining from the stimulated horn in WT and Irx3LacZ/LacZ uteri, two examples of each. (C) Real-time qPCR of decidualization markers, Hand2, Cebpb, Wnt4, Pgr, and Prp, represented as the mean ± SE of the fold change from WT uteri, two samples taken from each horn. WT (white), Irx3LacZ/LacZ (gray).
Figure 6
Figure 6
Irx3LacZ/LacZ uteri exhibit impaired vascularization by day 7 of gestation. (A–F) Immunofluorescence of endothelial cell marker, CD31 (CD31/PECAM, red) co-labeled with DAPI, a nuclear marker (blue) at pregnancy D7 in control (A, C, E, n = 3) and Irx3LacZ/LacZ (B, D, F, n = 3) implantation sites. Scale bars represent 250 mm. E: embryo; M: mesometrial; AM: anti-mesometrial. (G) Quantification of relative CD31 fluorescence intensity in the anti-mesometrium (AM) and mesometrium (M). Data represent mean ± SEM. Statistics: two-sample t-test; **: P < 0.01.
Figure 7
Figure 7
Fewer endothelial cells proliferate in Irx3LacZ/LacZ implantation sites. (A, B) Endothelial cell proliferation within implantation sites was evaluated using immunofluorescence co-staining for proliferation marker, Ki67 (green), and endothelial cell marker, CD31/PECAM (red) (DAPI, nuclear stain, blue) in wild type (A) vs Irx3LacZ/LacZ (B) uteri. Boxes in A–B are shown at higher magnification in A′-B′; L: uterine lumen. Boxes in A′-B′ are shown at higher magnification in insets. Yellow arrowheads indicate examples of Ki67 stain within endothelial cells.
Figure 8
Figure 8
Irx3LacZ/LacZ uteri express similar Gja1 transcripts but abnormal GJA1 protein. (A) Real-time qPCR results for Gja1 from pregnant uteri of WT and Irx3LacZ/LacZ females on D7 of pregnancy. Data represent the mean ± SEM of three biological replicates performed in triplicate at each time point. Fold change was calculated relative to transcript levels of the WT sample. Statistics: Student’s t-test, *P < 0.05. (B–I) Immunofluorescence of gap junction protein 1 (GJA1, connexin 43, green) co-labeled with DAPI, a nuclear marker (blue) at gestation D7 in control (B, D, F, H, n = 4) and Irx3LacZ/LacZ (C, E, G, I, n = 5) implantation sites. Images are represented in increasing magnification, scale bars represent 250 mm. Arrows highlight single cells that are enlarged within the inset of H and I. (J) Quantification of relative GJA1 fluorescence intensity in the anti-mesometrium (AM, P = 0.01) and mesometrium (M, P = 0.027) in wild type (white bars) vs Irx3LacZ/LacZ females (light gray bars). Data represent mean ± SEM. Statistics: two-sample t-test, *: P < 0.05; **: P < 0.01.

References

    1. Kim SM, Kim JS. A review of mechanisms of implantation. Dev Reprod 2017; 21:351–359. - PMC - PubMed
    1. Psychoyos A. Implantation. In: Greep RO, Astwood EG, Geiger SR (eds.), Handbook of Physiology. Washington DC: American Physiology Society; 1973: 187–215.
    1. Yoshinaga K. Uterine receptivity for blastocyst implantation. Ann N Y Acad Sci 1988; 541:424–431. - PubMed
    1. Parr MB, Parr EL. The implantation reaction. In: Wynn RM (ed.), Biology of the Uterus. New York: Plenum Press; 1989: 233–277.
    1. Weitlauf HM. Biology of Implantation. In: Knobil E, Neill JD (eds.), The Physiology of Reproduction. New York: Raven Press Ltd.; 1994: 391–440.