

Prevalence, Cost, and Variation in Cost of Pediatric Hospitalizations in Ontario, Canada
- PMID: 35138399
- PMCID: PMC8829658
- DOI: 10.1001/jamanetworkopen.2021.47447
Prevalence, Cost, and Variation in Cost of Pediatric Hospitalizations in Ontario, Canada
Abstract
Importance: Identifying conditions that could be prioritized for research based on health care system burden is important for developing a research agenda for the care of hospitalized children. However, existing prioritization studies are decades old or do not include data from both pediatric and general hospitals.
Objective: To assess the prevalence, cost, and variation in cost of pediatric hospitalizations at all general and pediatric hospitals in Ontario, Canada, with the aim of identifying conditions that could be prioritized for future research.
Design, setting, and participants: This population-based cross-sectional study used health administrative data from 165 general and pediatric hospitals in Ontario, Canada. Children younger than 18 years with an inpatient hospital encounter between April 1, 2014, and March 31, 2019, were included.
Main outcomes and measures: Condition-specific prevalence, cost of pediatric hospitalizations, and condition-specific variation in cost per inpatient encounter across hospitals. Variation in cost was evaluated using (1) intraclass correlation coefficient (ICC) and (2) number of outlier hospitals. Costs were adjusted for inflation to 2018 US dollars.
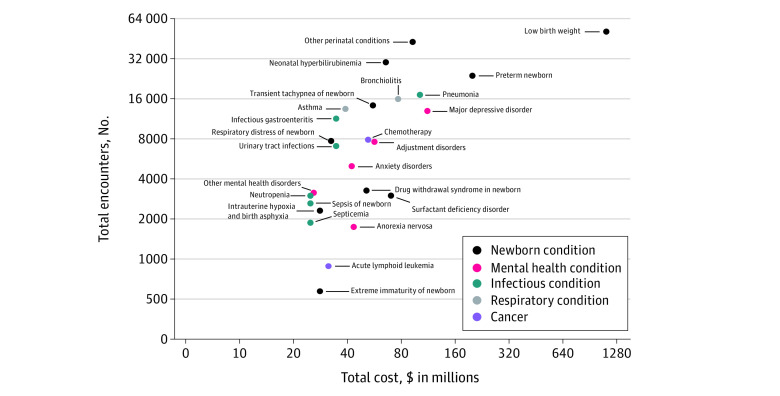
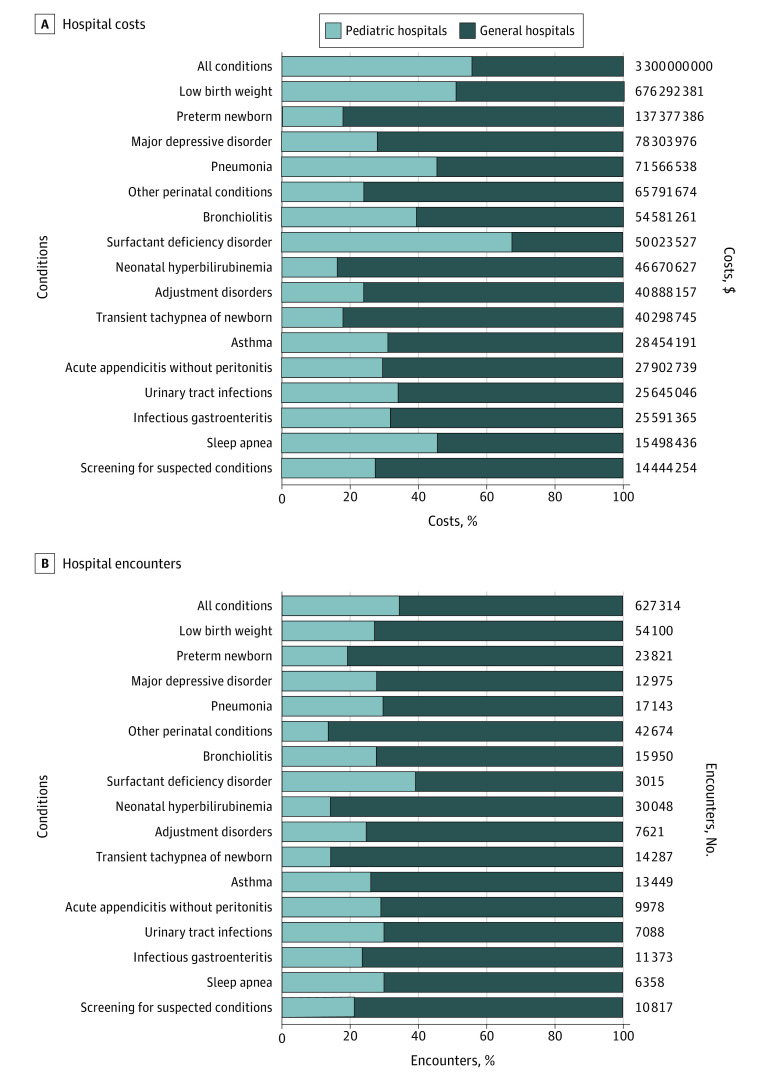
Results: Overall, 627 314 inpatient hospital encounters (44.8% among children younger than 30 days and 53.0% among boys) at 165 hospitals (157 general and 8 pediatric) costing $3.3 billion were identified. A total of 408 003 hospitalizations (65.0%) and $1.4 billion (43.8%) in total costs occurred at general hospitals. Among the 50 most prevalent and 50 most costly conditions (of 68 total conditions), the top 10 highest-cost conditions accounted for 55.5% of all costs and 48.6% of all encounters. The conditions with highest prevalence and cost included low birth weight (86.2 per 1000 encounters; $676.3 million), preterm newborn (38.0 per 1000 encounters; $137.4 million), major depressive disorder (20.7 per 1000 encounters; $78.3 million), pneumonia (27.3 per 1000 encounters; $71.6 million), other perinatal conditions (68.0 per 1000 encounters; $65.8 million), bronchiolitis (25.4 per 1000 encounters; $54.6 million), and neonatal hyperbilirubinemia (47.9 per 1000 encounters; $46.7 million). The highest variation in cost per encounter among the most costly medical conditions was observed for 2 mental health conditions (other mental health disorders [ICC, 0.28] and anxiety disorders [ICC, 0.19]) and 3 newborn conditions (intrauterine hypoxia and birth asphyxia [ICC, 0.27], other perinatal conditions [ICC, 0.17], and surfactant deficiency disorder [ICC, 0.17]).
Conclusions and relevance: This population-based cross-sectional study of hospitalized children identified several newborn and mental health conditions as having the highest prevalence, cost, and variation in cost across hospitals. Findings of this study can be used to develop a research agenda for the care of hospitalized children that includes general hospitals and to ultimately build a more substantial evidence base and improve patient outcomes.
Conflict of interest statement
Figures
Comment in
-
A Call for Research to Advance Health Equity for Children Requiring Hospitalization.JAMA Netw Open. 2022 Feb 1;5(2):e2148768. doi: 10.1001/jamanetworkopen.2021.48768. JAMA Netw Open. 2022. PMID: 35138403 No abstract available.
References
-
- Centers for Medicare & Medicaid Services . National health expenditures 2018 highlights. Centers for Medicare & Medicaid Services; 2019. Accessed September 23, 2020. https://www.openminds.com/wp-content/uploads/120519nhe2018highlights.pdf
-
- Canadian Institute for Health Information . National health expenditure trends, 2020. Canadian Institute for Health Information; 2021. Accessed March 2, 2021. https://www.cihi.ca/sites/default/files/document/nhex-trends-2020-narrat...
-
- Canadian Institute for Health Information . National health expenditure trends: data tables–series E2. Canadian Institute for Health Information; 2019. Accessed March 2, 2021. https://www.cihi.ca/sites/default/files/document/nhex-trends-narrative-r...
Publication types
MeSH terms
LinkOut - more resources
Full Text Sources
Miscellaneous
