. 2022 Feb 11;8(6):eabm4974.
doi: 10.1126/sciadv.abm4974. Epub 2022 Feb 9.

Microtubule-based perception of mechanical conflicts controls plant organ morphogenesis

Affiliations

Microtubule-based perception of mechanical conflicts controls plant organ morphogenesis

Dorothee Stöckle et al. Sci Adv. .

Abstract

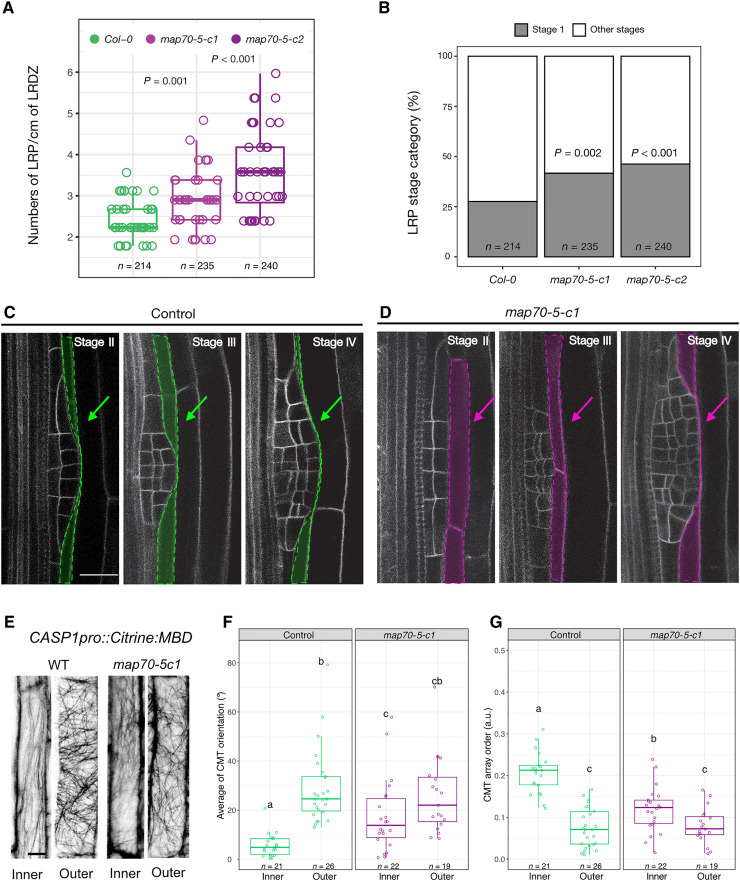
Precise coordination between cells and tissues is essential for differential growth in plants. During lateral root formation in Arabidopsis thaliana, the endodermis is actively remodeled to allow outgrowth of the new organ. Here, we show that microtubule arrays facing lateral root founder cells display a higher order compared to arrays on the opposite side of the same cell, and this asymmetry is required for endodermal remodeling and lateral root initiation. We identify that MICROTUBULE ASSOCIATED PROTEIN 70-5 (MAP70-5) is necessary for the establishment of this spatially defined microtubule organization and endodermis remodeling and thus contributes to lateral root morphogenesis. We propose that MAP70-5 and cortical microtubule arrays in the endodermis integrate the mechanical signals generated by lateral root outgrowth, facilitating the channeling of organogenesis.


Figures

Fig. 1.
Fig. 1.. Spatiotemporally regulated cortical microtubule reorganization in overlying endodermal cells during LRP initiation.
(A) Schematic representation of the remodeling of a differentiated endodermal cell (light brown) overlying lateral root founder cell founder cells as they radially expand and divide. The inner and outer sides of the cell remodel differently as the LRP grows (top versus bottom). Cortical microtubule (CMT) organization is simplified by lines. (B and C) Maximum projections of confocal microscopy z-stacks of CASP1pro::mVenus:MBD showing the organization of CMT arrays on the inner and outer side before (T = 0) (B) and after (T = 12 hours) (C) gravistimulation. (D and E) Distribution of CMT orientation before and after LRP initiation. (D) Depicts the CMT orientation in degrees with respect to the long axis of the cell, and (E) describes the CMT organization on the inner and outer side at indicated time points [arbitrary units (a.u.) 0 and 1, 0 = no order and 1 = order]. The number of endodermal cells measured is indicated (n). X, protoxylem; P, xylem pole pericycle; E, endodermis; C, cortex; and Ep, epidermis. Scale bars, 10 μm. Comparison between samples was performed using two-way analysis of variance (ANOVA) and Tukey’s post hoc test. Samples with identical letters do not significantly differ (α = 0.05).
Fig. 2.
Fig. 2.. The microtubule cytoskeleton of the endodermis is required for LRP development.
(A and C) LRP morphology in ELTPpro>>PHS1ΔP lines visualized by the plasma membrane marker UBQ10pro::EYFP:NPSN12 (gray) or CASP1pro>>PHS1ΔP lines carrying the fluorescent markers UBQ10pro::GFPx3:PIP1;4; GATA23pro:H2B:3xmCherry; DR5v2pro::3xYFP:NLS; RPS5Apro::tdTomato:NLS (sC111) (13) (B and D) under mock (A and B) or after induction (C and D). Only the DR5v2pro::3xYFP:NLS and UBQ10pro::GFPx3:PIP1;4 are visible. (B and D) Gravistimulation (GS)–induced LRP formation observed at 18 and 36 hours after GS. Scale bars, 20 μm. (A to D) The contour of the endodermal cells overlying the LRP is highlighted in green (A and B) under control conditions and pink (C and D) when PHS1ΔP was induced. (E) LRP density in the LR developmental zone (LRDZ). For each line, Wilcoxon rank sum test was used to compare LRP densities under the two treatments. (F) Analysis of stage I LRP upon disruption of the CMT. Pearson’s chi-square test with Yates’ continuity correction was used to assess whether LRP distribution is independent of CMT condition. (G) Quantification of relative thickness of endodermis. (H) Distribution of LRP developmental stages induced by GS upon induction of CASP1pro>>PHS1ΔP expression and in mock. (G and H) n = 59 seedlings for mock and n = 91 for Dex conditions.
Fig. 3.
Fig. 3.. SHY2-mediated local reorganization of cortical microtubules in the endodermis.
(A) Maximum projections of confocal z-stacks showing CMT arrays on the inner side of an differentiated endodermis cell in WT, CASP1pro::shy2-2, and slr-1 plants expressing the CASP1pro::mVenus:MBD reporter after 24 hours of dimethyl sulfoxide (DMSO) or 1 μM indole-3-acetic acid (IAA) treatment. (B) Quantification of CMT orientation (0° to 90°, in respect to the long axis of the cell) and (C) isotropy (a.u., 0 and 1, 0 = no order and 1 = order) on the inner side of endodermal cells after 24 hours of DMSO or IAA (1 μM) treatment. (D) Maximum projections of confocal z-stacks showing the organization of CMT arrays on the outer side of an endodermal cell in WT, CASP1pro::shy2-2, and slr-1 plants expressing the CASP1pro::mVenus:MBD reporter after 24 hours of DMSO or IAA (1 μM) treatment. (E) Quantification of CMT orientation (0° to 90°, respective to the long axis of the cell) and (F) isotropy (a.u., 0 and 1, 0 = no order and 1 = order) on the outer side of endodermal cells after 24 hours of DMSO or IAA (1 μM) treatment. Comparison between samples was performed using two-way ANOVA and post hoc multiple comparisons with Tukey’s post hoc test. Samples with identical letters do not significantly differ (α = 0.05). Scale bars, 10 μm.
Fig. 4.
Fig. 4.. MAP70-5 expression in the endodermis correlates with spatial accommodation.
(A to O) Confocal images of developing lateral roots in seedlings expressing LBD16pro::3xmCherry:SYP122 [plasma membrane, gray (A, D, G, and M) or magenta (C, F, I, and L)] to visualize the LRP and MAP70-5pro::CITRINE:MAP70-5 (gray: B, E, H, K, M, and N or green: C, F, I, and L). (A to C) Stage I: CITRINE:MAP70-5 is expressed in a differentiating metaxylem cell. (D to L) CITRINE:MAP70-5 is induced in endodermal cells overlying the LRP from stages II to IV. (A to L) Images are single confocal planes. (M and N) Maximum projections of confocal image stacks depicting a surface view of endodermal cells overlying the LRP: (M) stages IV and (N) V. (O) Single confocal image showing accumulation of CITRINE:MAP70-5 on the inner side of an endodermal cell overlying a stage IV LRP. (A to L and O) Images of single confocal sections. (M and N) Maximum projections of z-stacks. Green asterisks indicate endodermal cell files. Yellow dashed circles indicate the area of the LRP. (O) Stage III LRP showing accumulation of CITRINE:MAP70-5 (green) on the inner side of an overlying endodermal cell. Magenta shows plasma membrane labeled by UBQ10pro::RCI2a:tdTomato (46). (P) Schematic representation of inner and outer domains used for quantification of the accumulation index of CITRINE:MAP70-5 in endodermal cells overlying LRP (stages II to IV). (Q) Quantification of the mean gray values of the inner and outer domains. For the accumulation index, the collected data were normalized, and the ratio between the inner and outer domains was calculated. Scale bar, 20 μm.
Fig. 5.
Fig. 5.. MAP70-5 is required for spatial accommodation responses in the endodermis.
(A) lateral root density in the LRDZ of WT compared to map70-5-c1 and map70-5-c2. For each line, Wilcoxon rank sum test with continuity correction was performed to compare LR densities. (B) Staging of LRs reveals an accumulation of stage I LRP in the map70-5-c1 and map70-5-c2 compared to WT roots. Pearson’s chi-square test with Yates’ continuity correction was used to assess whether LRP distribution is independent in the map70-5 mutants. (C and D) Single confocal planes showing LRP morphology in WT and map70-5-c1 through stages I to IV visualized by the plasma membrane marker UBQ10pro::EYFP:NPSN12. Contours of endodermal cells overlying the LRP are highlighted in green (C) under control conditions and pink (D) when PHS1ΔP was induced. (E) Maximum projection of confocal z-stacks showing CMTs on the inner and outer side of WT and map70-5-c1 endodermal cells. (F) CMT orientation (0° to 90°, respective to the long axis of the cell). (G) CMT isotropy on the inner and outer side (a.u., 0 = no order and 1 = order). Scale bars, 10 μm. Comparison between samples was performed using two-way ANOVA and post hoc multiple comparisons with Tukey’s test. Samples with identical letters do not significantly differ (α = 0.05).

Similar articles

Cited by

References

    1. Hamant O., Widespread mechanosensing controls the structure behind the architecture in plants. Curr. Opin. Plant Biol. 16, 654–660 (2013). - PubMed
    1. Hamant O., Heisler M. G., Jönsson H., Krupinski P., Uyttewaal M., Bokov P., Corson F., Sahlin P., Boudaoud A., Meyerowitz E. M., Couder Y., Traas J., Developmental patterning by mechanical signals in Arabidopsis. Science 322, 1650–1655 (2008). - PubMed
    1. Hamant O., Saunders T. E., Shaping organs: Shared structural principles across kingdoms. Annu. Rev. Cell Dev. Biol. 36, 385–410 (2020). - PubMed
    1. Hamant O., Inoue D., Bouchez D., Dumais J., Mjolsness E., Are microtubules tension sensors? Nat. Commun. 10, 2360 (2019). - PMC - PubMed
    1. Sampathkumar A., Krupinski P., Wightman R., Milani P., Berquand A., Boudaoud A., Hamant O., Jönsson H., Meyerowitz E. M., Subcellular and supracellular mechanical stress prescribes cytoskeleton behavior in Arabidopsis cotyledon pavement cells. eLife 3, e01967 (2014). - PMC - PubMed