. 2022 Feb 11;8(6):eabm1759.
doi: 10.1126/sciadv.abm1759. Epub 2022 Feb 9.

Surface Ig variable domain glycosylation affects autoantigen binding and acts as threshold for human autoreactive B cell activation

Affiliations

Surface Ig variable domain glycosylation affects autoantigen binding and acts as threshold for human autoreactive B cell activation

Theresa Kissel et al. Sci Adv. .

Abstract

The hallmark autoantibodies in rheumatoid arthritis are characterized by variable domain glycans (VDGs). Their abundant occurrence results from the selective introduction of N-linked glycosylation sites during somatic hypermutation, and their presence is predictive for disease development. However, the functional consequences of VDGs on autoreactive B cells remain elusive. Combining crystallography, glycobiology, and functional B cell assays allowed us to dissect key characteristics of VDGs on human B cell biology. Crystal structures showed that VDGs are positioned in the vicinity of the antigen-binding pocket, and dynamic modeling combined with binding assays elucidated their impact on binding. We found that VDG-expressing B cell receptors stay longer on the B cell surface and that VDGs enhance B cell activation. These results provide a rationale on how the acquisition of VDGs might contribute to the breach of tolerance of autoreactive B cells in a major human autoimmune disease.


Figures

Fig. 1.
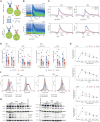
Fig. 1.. Generation of patient-derived IgG1 monoclonal anti–citrullinated protein (auto)antibodies (ACPA) with (WT) and without (NG) VDGs.
(A) Schematic representation of the generated ACPA-IgG (7E4, 2E4, 1F2, 2G9, 3F3, and 2D11) carrying various amounts of N-linked glycans in the variable regions of their HC (turquoise) and LC (light gray). (B) Size shift between WT and NG ACPA under nonreduced (IgG) and reduced (HC and LC) conditions on a 4 to 15% gradient SDS protein gel (Bio-Rad). The size was determined using the PageRuler Plus Prestained Protein Ladder (Thermo Fisher Scientific). (C) Size shift between WT and NG ACPA-IgG identified via analytical size exclusion chromatography (SEC). ACPA-IgG+ fractions were determined via the absorbance at 280 nm. mAU, milli absorbance unit (D) Schematic depiction of the four ACPA variants (WT, NG, WT + neu, and NG + neu) analyzed: variable domain glycosylated (VDG+), Fc-glycosylated (FcG+), sialylated (SA+), and nonsialylated (SA) after neuraminidase (neu) treatment. (E) MALDI-TOF MS analysis of N-linked variable domain and Fc-glycans from WT, WT + neu, NG, and NG + neu ACPA-IgG 7E4 and 3F3. Glycan structures of the most abundant N-linked glycan peaks are depicted. Blue square, N-acetylglucosamine (N); green circle, mannose/hexose (H); yellow circle, galactose/hexose (H); red triangl,: fucose (F); purple diamond, α 2,6-linked N-acetylneuraminic (sialic) acid (S). a.u., arbitrary units.
Fig. 2.
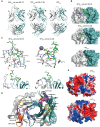
Fig. 2.. Crystal structures of ACPA Fab fragments and their peptide-binding modes.
(A) Crystal structures of ACPA-IgG Fab domains complexed with their respective peptides (3F3Fab:cit-vim 59-74 and 1F2Fab:cit-CII-C-39) and the unbound (APO) form of 1F2Fab in a cartoon representation. The peptides bound to the Fab are shown as sticks with carbon (green), oxygen (red), and nitrogen (blue) atoms. Citrulline residues are colored in magenta. (B) Top view of the ACPA paratope and the bound peptides for 3F3Fab:cit-vim 59-74 and 1F2Fab:cit-CII-C-39 and for 1F2Fab in an unbound state. The peptides are shown as sticks with carbon (green), oxygen (red), and nitrogen (blue) atoms. (C) Detailed paratope/epitope interactions between Fab fragments and their bound ligands shown for 3F3Fab:cit-vim 59-74 and 1F2Fab:cit-CII-C-39. Fab HC and LC are depicted as cartoon or sticks. All residues involved in the polar/hydrophobic interactions to the ligands are marked. Water molecules are depicted as red spheres, hydrogen bonds are depicted as black dashed lines, and the zinc ion is depicted as a dark sphere. Citrullinated residues are indicated as CIT. (D) Superposition of the CDR loops (CDR1, CDR2, and CDR3) of 3F3Fab, 1F2Fab, and 7E4Fab. (E) Electrostatic surface potentials of 3F3Fab and 1F2Fab are depicted. Positively charged regions are colored in red and negatively charged regions in blue. LC is depicted in light gray and HC in steel blue.
Fig. 3.
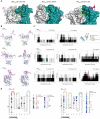
Fig. 3.. Fab structures crystallized with the starting (core) monosaccharides of the VDG and MD simulations to predict VDG-antibody interactions.
(A) Fab structures of 7E4Fab:cit-CII-C-48, 3F3Fab:cit-vim 59-74, and 1F2Fab:cit-CII-C-39 crystallized with the first two N-acetylglucosamines (GlcNAcs) of the VDG. LC is depicted in light gray and HC in steel blue. The peptides bound to the respective Fab are depicted as sticks with citrulline residues (yellow), carbon (green), oxygen (red), and nitrogen (blue) atoms. The GlcNAcs are presented as sticks in magenta. (B) MD simulation, two time points, of 7E4Fab, 3F3Fab, and 1F2Fab crystal structures modeled with full-length disialylated VDG represented as sticks in magenta. (C) Hydrogen bond (H-bond) interactions between the VDG (HC or LC) and the antibody structure are visualized over simulation time. (D) ACPA 3F3Fab HC and LC variable gene amino acid (aa) sequence is depicted on the basis of IMGT (2D). Acceptors/donors of H-bond interactions between the antibody structure and the HC (#1 and #2)/LC N-glycans are visualized. High occupancy is depicted in dark blue (HC: 13%, LC:16%), and low occupancy is depicted in light blue (0.01 to 0.2%). Amino acids and their respective interaction partners (N-glycan monosaccharides) are shown. Blue square, GlcNAc; green circle, mannose; yellow circle, galactose; red triangle, fucose; purple diamond, α 2,6-linked N-acetylneuraminic acid (sialic acid).
Fig. 4.
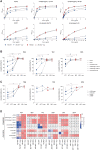
Fig. 4.. Impact of disialylated ACPA VDG on citrullinated (auto)antigen binding.
(A) ELISA titration binding curves of the ACPA 7E4 (0 to 10 μg/ml) variants (WT, WT + neu, NG, and NG + neu) toward citrullinated peptides (CCP2, CCP1, cit-fibrinogen α 27-43, cit-fibrinogen β 36-52, cit-vimentin 59-74, and cit-enolase 5-20). Binding to the arginine control peptide was subtracted. Reactivity was determined via the optical density (OD) at 415 nm. Each data point represents the mean of two technical replicates, and each binding experiment was repeated two to three times. (B) Relative binding of the ACPA mAb 7E4, 1F2, and 3F3 (2 to 40 μg/ml) variants (WT, WT + neu, NG, and NG + neu) toward citrullinated peptides. N = 2 to 6. Unpaired two-tailed t tests assuming the same SD. 7E4 WT-NG: ****P(CCP2, CCP1, cit-vimentin 59-74) < 0.0001 and **P(cit-enolase 5-20) = 0.0005; 7E4 WT-WT + neu: **P(CCP1) = 0.029, *P(CCP2) = 0.0227, and *P(cit-enolase 5-20) = 0.0419; 1F2 WT-NG: *P(cit-vimentin 59-74) = 0.0104 and *P(cit-enolase 5-20) = 0.0101; 1F2WT-WT + neu: **P(cit-enolase 5-20) = 0.0096 and *P(cit-vimentin 59-74) = 0.0449; 3F3 WT-NG: ***P(CCP1) = 0.0009 and **P(cit-vimentin 59-74) = 0.0010; 3F3WT-WT + neu: **P(CCP1) = 0.0017 and **P(cit-vimentin 59-74) = 0.0082. (C) Relative binding of the ACPA mAb 7E4, 1F2, and 3F3 (5 to 20 μg/ml) variants (WT, WT + neu, NG, and NG + neu) toward citrullinated proteins. N = 2. Unpaired two-tailed t tests assuming the same SD. 7E4 WT-NG: **P(cit-vinculin) = 0.0022, **P(cit-MBP) = 0.0014, and *P(cit-OVA) = 0.0032; 3F3 WT-NG: ***P(cit-MBP) = 0.0003; 3F3 WT-WT + neu: *P(cit-MBP) = 0.0213. (D) Heatmap of relative binding (0%, blue; 100%, red) of all monoclonal ACPA (7E4, 2E4, 1F2, 2G9, 3F3, and 2D11) toward citrullinated peptides and proteins. Nondetermined reactivities are illustrated with a cross. N = 2 to 3.
Fig. 5.
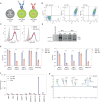
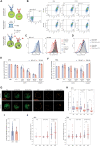
Fig. 5.. Generation of human Ramos B cell lines carrying disialylated VDG BCRs.
(A) Schematic depiction of generated human Ramos B cell transfectants with mIgG VDG+ BCRs (WT) and VDG BCRs (NG). The untransduced MDL-AID KO cell line shows no GFP and endogenous BCR expression (GFP, BCR, VDG). (B) GFP and BCR surface expression of the MDL-AID KO control cell line and Ramos cells expressing 3F3 mIgG with (WT) and without (NG) VDG. (C) Histograms depicting an identical WT and NG mIgG BCR expression of the 3F3 and 7E4 Ramos B cell lines and no BCR expression of the MDL-AID KO cell line. (D) Size shift between VDG+ and VDG 3F3 and 7E4 BCRs visualized on a 4 to 15% SDS–polyacrylamide gel (Bio-Rad). No mIgG BCR protein band was detected for the MDL-AID KO cell line. The size was determined using the PageRuler Plus Prestained Protein Ladder (Thermo Fisher Scientific). (E) Bar graphs of the relative abundance of galactosylation, sialylation, bisecting GlcNAc, and fucosylation per N-glycan and sialylation per galactosylation on the Ramos 3F3/7E4 WT, NG, and MDL IgG BCR after passing quality control (QC) settings. N = 3 (biological replicates). Multiple nonpaired t tests (Bonferroni-Dunn method): ****P < 0.0001, ***(3F3)P = 0.0008, and ***(7E4)P = 0.0004. (F) Absolute intensity of glycan traits expressed on the MDL and 3F3 WT and NG BCR after passing QC settings. (G) LC chromatogram of glycan traits expressed on the 3F3 WT and NG BCR after passing QC settings.
Fig. 6.
Fig. 6.. Binding of Ramos B cell lines carrying a VDG+ or VDG BCR to citrullinated antigens.
(A) Histograms of Ramos 3F3 and 7E4 B cells carrying VDG+ or VDG BCRs and their binding to CCP2/cit-vimentin 59-74 or CCP2/CCP1 strep.–APC–labeled tetramers, respectively. Binding to the arginine control peptides is shown in dark (WT) and light (NG) gray. (B) Binding titration curves of 7E4/3F3 WT and NG BCRs to citrullinated peptide-strep. tetramers (CCP2, CCP1, cit-fibrinogen α 27-43, cit-fibrinogen β 36-52, and cit-vimentin 59-74) and their respective control peptides. N = 2. The y axis depicts the MFI ratio between antigen binding and mIgG BCR expression. (C) Binding of 3F3/7E4 WT and NG Ramos B cells to citrullinated peptide-strep. tetramers (1 to 5 μg/ml). The y axis depicts the MFI ratio between antigen binding and mIgG BCR expression. (D) Relative binding of 7E4/3F3 WT and NG BCRs toward five citrullinated peptides (0%, blue; 100%, red).
Fig. 7.
Fig. 7.. Impact of mIgG BCR VDGs on human Ramos B cell activation.
(A) Ramos B cells (WT and NG) were stimulated with antigen (CCP2-strep.) or anti-IgG F(ab)′2. B cell activation was analyzed via Ca2+ release or the phosphorylation of Syk. (B) Ca2+ flux (Ca2+-bound Indo-1/unbound Indo-1) of 3F3 WT and NG Ramos B cells after stimulation with a-IgG F(ab)′2. (C) Ca2+ flux overlays of 7E4/3F3 WT and NG Ramos B cells after stimulation [CCP2-strep. or a-IgG F(ab)′2]. (D) Paired analysis of Ca2+ flux and pSyk(Y348) expression after 5 min of stimulation [a-IgG F(ab)′2 or CCP2-strep.] for 3F3/7E4 WT and NG Ramos B cells. Paired two-tailed t test. N = 5 to 7. 3F3 Ca2+ flux: **P = 0.005 and *P = 0.0316; 3F3 pSyk: *P = 0.0109; 7E4 Ca2+ flux: *P = 0.0309 and *P = 0.0441; 7E4 pSyk: **P = 0.0089 and *P = 0.0276. (E) pSyk (Y348) time-point analysis of 3F3/7E4 WT and NG Ramos B cells after adding no stimulus or 2, 5, 10, 15, and 20 min of stimulation [a-IgG F(ab)′2 or CCP2-strep.]. pSyk(Y348) MFI ratio (stimulated/unstimulated cells) is depicted. (F) pSyk (Y348) histograms of unstimulated or CCP2-strep.– or a-IgG F(ab)′2–stimulated 3F3/7E4 WT and NG Ramos B cells. (G) Western blot analyses of unstimulated (us) or 5-min a-IgG F(ab)′2–stimulated 3F3/7E4 WT and NG Ramos B cells. CD22, Syk, pCD22 (Y822), and pSyk(Y352) expressions are shown. Cell lysates of 1 million (unstimulated and stimulated first slot), 0.5 million (stimulated second slot), and 0.25 million (stimulated third slot) cells were blotted. Glyceraldehyde-3-phosphate dehydrogenase (GAPDH) was used as a loading control, and 1 million MDL-AID KO cells were added as an additional control.
Fig. 8.
Fig. 8.. Effect of BCR VDGs on antigen internalization and BCR downmodulation.
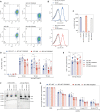
(A) Ramos B cells were incubated at 4°C, stimulated with antigen or PBS, and incubated at 4° or 37°C to allow BCR downmodulation. The remaining surface BCRs were stained (Fab anti-human IgG-AF647). (B) GFP and mIgG expression of MDL-AID KO, 3F3 WT, and NG cells after PBS or CCP2-strep. treatment (4°C or 15 min at 37°C). (C) Histograms (mIgG) of CCP2-strep.–stimulated 3F3 WT or NG Ramos B cells (4°C or 5, 15, and 30 min at 37°C). (D) Histogram (mIgG) overlay of 3F3 WT and NG Ramos B cells after PBS or CCP2-strep. treatment (4°C or 15 min at 37°C). (E) BCR downmodulation of 3F3 WT and NG (F) 7E4WT and NG after PBS, CCP2-strep., or CArgP2-strep. stimulation (4°C or 5, 15, and 30 min at 37°C). Paired two-tailed t test. N = 3 to 4. 3F3: *(5 min)P = 0.0146 and **P = 0.0054; 7E4: **P = 0.0054. (G) Spinning disk confocal microscopy of GFP+ 3F3 WT and NG cells after CCP2-strep.-AF568 stimulation (incubation at 4°C or 5 and 15 min at 37°C), 2% PFA fixation, and a-IgG-AF647 surface staining. (H) 3F3 WT and NG BCR expression after CCP2-strep. stimulation (4°C or 5 and 15 min at 37°C). N = 114, 213, 474, 224, 495, and 595 cell slices, respectively. Ordinary one-way ANOVA, ****P < 0.0001. MSI, mean signal intensity. (I) CCP2-strep. binding of 3F3 WT and NG at 4°C. (J) CCP2-strep. internalization of 3F3/7E4 WT and NG BCRs at 4°C or after 5 and 15 min of incubation at 37°C. N(3F3) = 114, 213, 474, 224, 495, and 595 cell slices, respectively. N(7E4) = 619, 459, 645, 433, 738, and 302 cell slices, respectively. Ordinary one-way ANOVA, ****P < 0.0001.
Fig. 9.
Fig. 9.. Impact of CD22 CRISPR-Cas9 KO on BCR VDG–mediated effects.
(A) GFP and CD22 (anti-CD22 APC) expression of 3F3 WT, WT CD22KO, NG, and NG CD22KO Ramos B cells. (B) Histogram overlay (CD22) of unstained cells, 3F3 WT, and WT CD22KO or 3F3NG and NG CD22KO Ramos B cells. (C) CD22 expression of 3F3 WT, WT CD22KO, NG, NG CD22KO, and MDL-AID KO Ramos B cells. (D) Percentage of pSyk(Y348)-positive cells of 3F3 WT, WT CD22KO, NG, and NG CD22KO Ramos B cells after 5, 10, and 15 min of a-IgG F(ab)′2 stimulation. Paired two-tailed t test. N = 4. 5 min: *(3F3 WT versus NG) P = 0.0318; 10 min: *(3F3 WT versus NG) P = 0.0106 and *(3F3 WT versus WT CD22KO) P = 0.0298; 15 min: *(3F3 WT versus NG) P = 0.0166 and *(3F3NG versus NG CD22KO) P = 0.0315. (E) Ca2+ flux of 3F3 WT, WT CD22KO, NG, and NG CD22KO Ramos B cells after a-IgG F(ab)′2 stimulation. Paired two-tailed t test. N = 4. *(3F3 WT versus WT CD22KO) P = 0.0177, *(3F3 WT versus NG) P = 0.0342, and *(3F3NG versus NG CD22KO) P = 0.0171. (F) Western blot analyses of 3F3 WT, WT CD22KO, NG, and NG CD22KO Ramos B cell lysates after 5 min of a-IgG F(ab)′2 stimulation. CD22 and pSyk(Y352) expression are shown. β-Actin was used as a loading control, and MDL-AID KO cell lysates were used as an additional control. (G) BCR downmodulation of 3F3 WT, WT CD22KO, NG, and NG CD22KO Ramos B cells after PBS or CCP2-strep. stimulation and incubation at 4°C or for 5, 15, or 30 min at 37°C. Paired two-tailed t test. N = 3. *(4°C) P = 0.0474, *(5 min, 37°C) P = 0.0132, *(15 min, 37°C) P = 0.0229, and *(30 min, 37°C) P = 0.0463.

Similar articles

Cited by

References

    1. Barnas J. L., Looney R. J., Anolik J. H., B cell targeted therapies in autoimmune disease. Curr. Opin. Immunol. 61, 92–99 (2019). - PMC - PubMed
    1. Hampe C. S., B cells in autoimmune diseases. Scientifica 2012, 1–18 (2012).
    1. Erikson J., Radic M. Z., Camper S. A., Hardy R. R., Carmack C., Weigert M., Expression of anti-DNA immunoglobulin transgenes in non-autoimmune mice. Nature 349, 331–334 (1991). - PubMed
    1. Goodnow C. C., Crosbie J., Adelstein S., Lavoie T. B., Smith-Gill S. J., Brink R. A., Pritchard-Briscoe H., Wotherspoon J. S., Loblay R. H., Raphael K., Trent R. J., Basten A., Altered immunoglobulin expression and functional silencing of self-reactive B lymphocytes in transgenic mice. Nature 334, 676–682 (1988). - PubMed
    1. Hartley S. B., Crosbie J., Brink R., Kantor A. B., Basten A., Goodnow C. C., Elimination from peripheral lymphoid tissues of self-reactive B lymphocytes recognizing membrane-bound antigens. Nature 353, 765–769 (1991). - PubMed