. 2022 Feb 11;8(6):eabj4437.
doi: 10.1126/sciadv.abj4437. Epub 2022 Feb 9.

Changes in supramolecular organization of cyanobacterial thylakoid membrane complexes in response to far-red light photoacclimation

Affiliations

Changes in supramolecular organization of cyanobacterial thylakoid membrane complexes in response to far-red light photoacclimation

Craig MacGregor-Chatwin et al. Sci Adv. .

Abstract

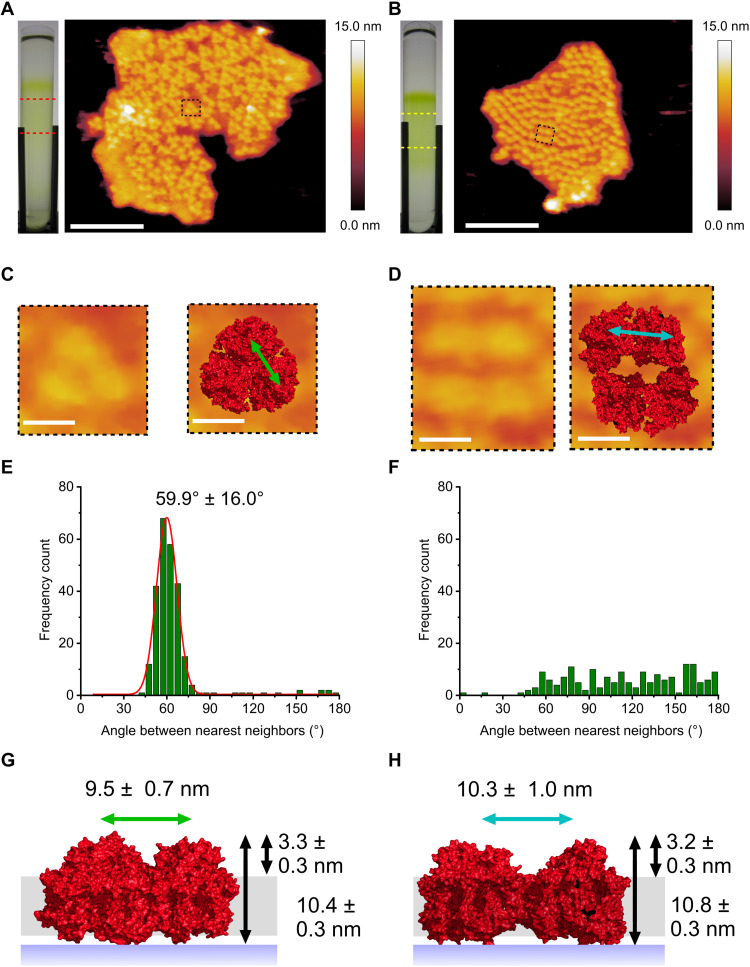
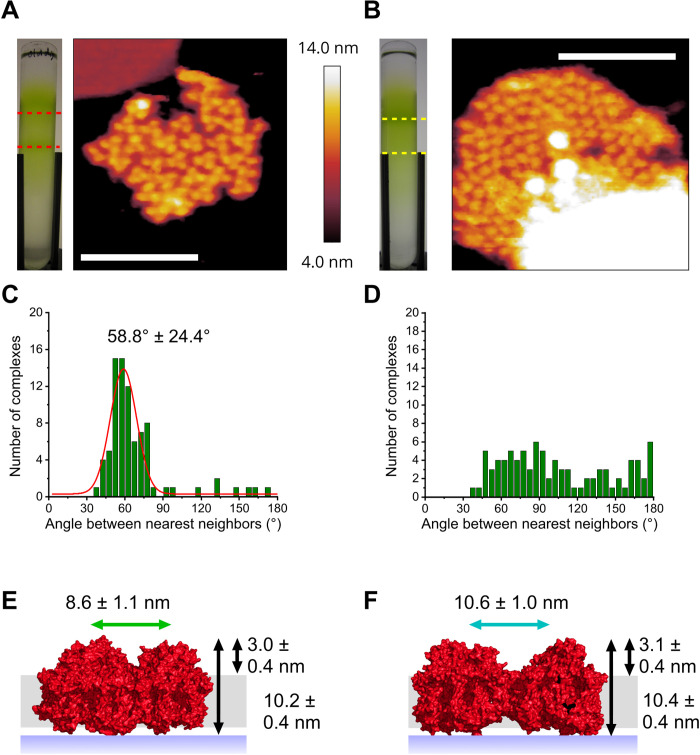
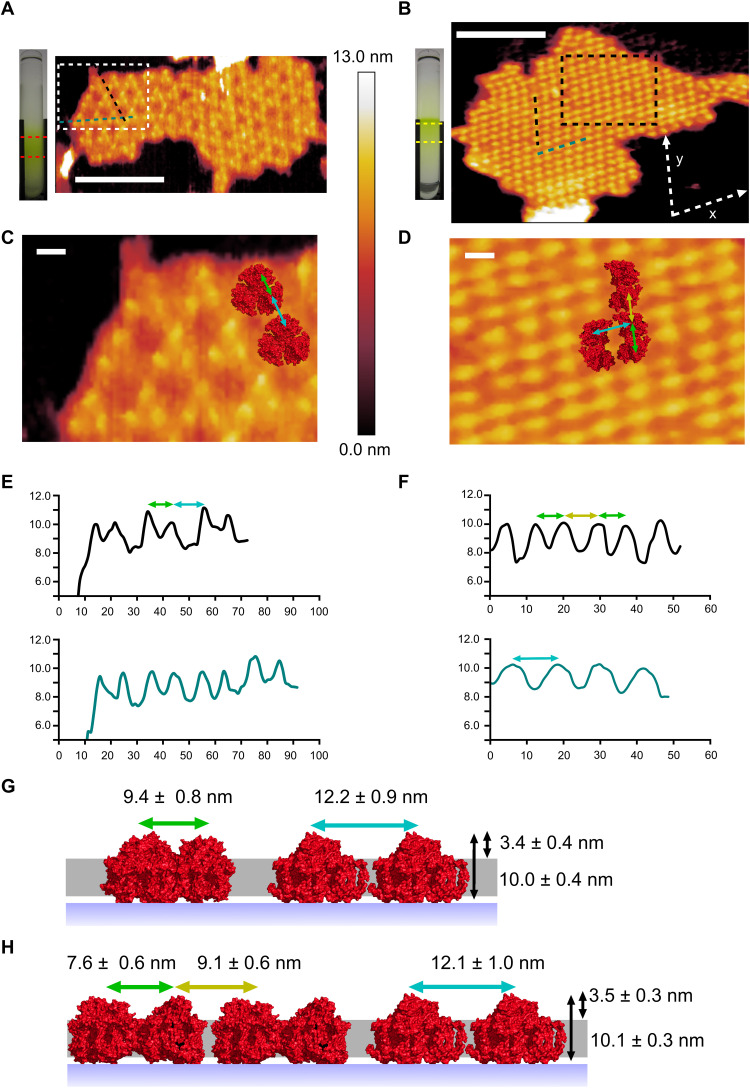
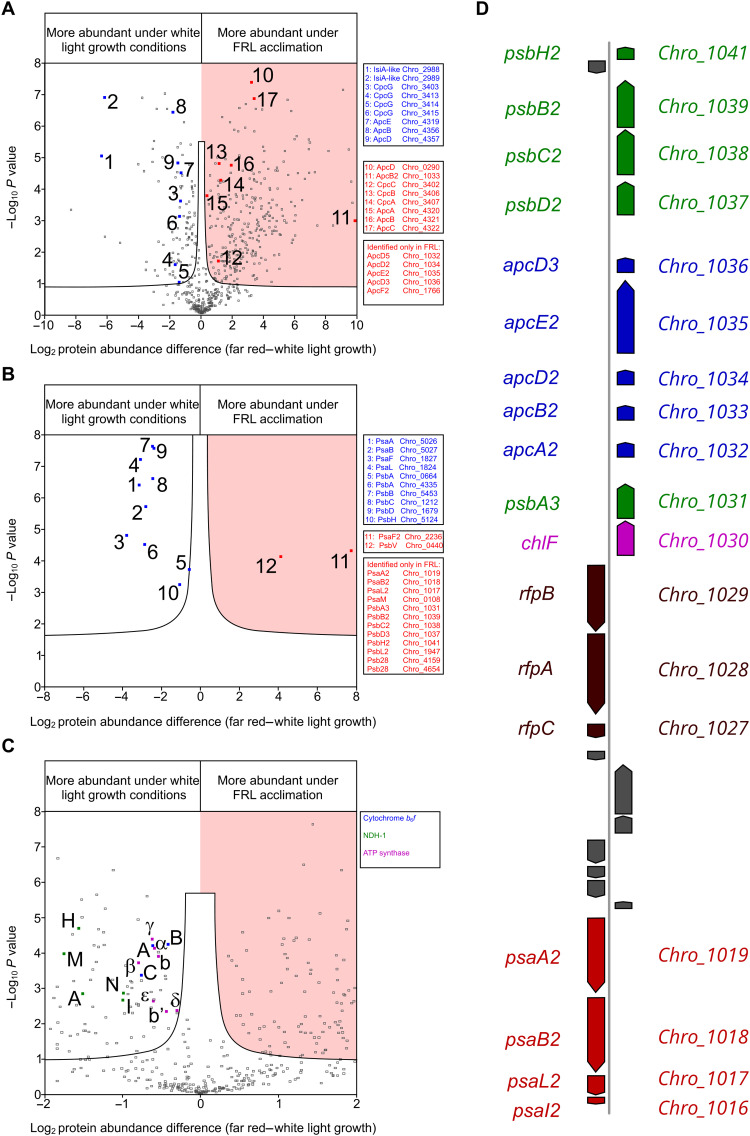
Cyanobacteria are ubiquitous in nature and have developed numerous strategies that allow them to live in a diverse range of environments. Certain cyanobacteria synthesize chlorophylls d and f to acclimate to niches enriched in far-red light (FRL) and incorporate paralogous photosynthetic proteins into their photosynthetic apparatus in a process called FRL-induced photoacclimation (FaRLiP). We characterized the macromolecular changes involved in FRL-driven photosynthesis and used atomic force microscopy to examine the supramolecular organization of photosystem I associated with FaRLiP in three cyanobacterial species. Mass spectrometry showed the changes in the proteome of Chroococcidiopsis thermalis PCC 7203 that accompany FaRLiP. Fluorescence lifetime imaging microscopy and electron microscopy reveal an altered cellular distribution of photosystem complexes and illustrate the cell-to-cell variability of the FaRLiP response.


Figures

Fig. 1.
Fig. 1.. AFM of PSI in thylakoid membranes from FRL-acclimated and WL-grown C. thermalis 7203.
(A) Thylakoid membranes from FRL-acclimated cells purified on sucrose gradients (left) and imaged by AFM (right) revealing trimeric PSI complexes; the red dashed lines delineate the region of the sucrose gradient that samples were harvested from for AFM imaging. (B) Thylakoid membranes from cells grown under WL conditions purified on sucrose gradients (left) and imaged by AFM (right) showing densely packed non-trimeric PSI complexes; the yellow dashed lines delineate the region of the sucrose gradient from which thylakoid membranes were harvested for AFM analysis. (C) Zoomed-in view of the area outlined in (A) showing the AFM topography of a single trimeric PSI complex (left) and the trimeric cryo–electron microscopy (cryo-EM) structure [Protein Data Bank (PDB) ID: 6PNJ] fitted to the AFM topology (right). (D) Zoomed-in view of the area highlighted by the black box in (B) showing the AFM topology of non-trimeric PSI complexes (left) with the PSI cryo-EM structure (PDB ID: 6JEO) fitted to the AFM topograph (right). (E and F) Histograms showing the angle between the two PSI complexes that are the nearest neighbors for a given PSI complex in (A) and (B), respectively. (G) Schematic showing the heights of complexes above the mica surface and the lipid bilayer for FRL membranes and the distance between constituent PSI complexes that make up the trimeric complex (green arrow) and height of PSI complexes above the mica surface (long black arrow) and the lipid bilayer (short black arrow). (H) Schematic showing the same distances as in (G) for PSI complexes in membranes from WL-grown cells with the intracomplex distance also shown (blue arrow). Black arrows as in (G). Scale bars, 100 nm (A and B) and 10 nm (C and D).
Fig. 2.
Fig. 2.. AFM of PSI in thylakoid membranes from FRL-acclimated and WL-grown C. fritschii 9212.
(A) Sucrose gradient of thylakoid membranes purified from FRL-acclimated cells (left) and an AFM topograph of thylakoid membranes showing trimeric PSI complexes (right) harvested from the region indicated by the red dashed lines. (B) Sucrose gradient of thylakoid membranes purified from cells grown under WL conditions (left) and an AFM topograph of a thylakoid membrane patch with densely packed PSI complexes visible (right); the yellow dashed lines show where the thylakoid membranes were harvested for AFM imaging. (C and D) Angles between the two nearest neighbors of each PSI complex in the membrane patches in (A) and (B), respectively. (E) Schematic showing the height above the mica surface (long black arrow) and lipid bilayer (short black arrow) measured for PSI complexes in FRL thylakoid membranes (PDB ID: 6PNJ). The internal distance between members of trimeric PSI complexes is also shown (green arrow). (F) Schematic of the PSI complexes in WL thylakoid membranes in (B) showing the height above the mica surface (long black arrow) and the lipid bilayer (short black arrow) of PSI complexes (PDB ID: 6JEO). The average distance between neighboring PSI complexes is also shown (blue arrow). Scale bars, 100 nm (A and B).
Fig. 3.
Fig. 3.. AFM of PSI in thylakoid membranes from FRL-acclimated and WL-grown Synechococcus 7335 cells.
(A) Thylakoid membranes from FRL-acclimated cells purified on a sucrose gradient (left) and imaged by AFM (right) showing a pseudo-hexagonal lattice of PSI trimers; the red dashed lines represent the areas that membranes were selected from for AFM imaging. The black and dark blue dashed lines correspond to the height sections in (E). Scale bar, 100 nm. (B) Membranes purified from WL-grown cells were fractioned on a sucrose gradient (left) and imaged by AFM (right); the yellow dotted lines show the location the membranes were isolated from in the sucrose gradient. The dashed lines correspond to the height sections in (F). Scale bar, 100 nm. (C) Topograph of the area indicated by the white box in (A) showing trimeric FRL-acclimated PSI (PDB ID: 6PNJ) fitted to the AFM data. The colored arrows correspond to the distances in (E) and (G). Scale bar, 10 nm. (D) Topograph of the area delineated by the black box in (B); a dimer unit within a PSI tetramer (PDB ID: 6JEO) was fitted to the AFM data. The colored arrows correspond to those in (F) and (H). Scale bar, 10 nm. (E and F) Height sections for FRL PSI and WL PSI complexes in (A) and (B), respectively. (G) Diagram of the average height of FRL PSI complexes in (A, C) above the mica surface (long black arrow) and the lipid bilayer (short black arrow), the average distance between constituent members of the trimeric PSI complex (green arrow), and the periodicity of the pseudo-hexagonal lattice (blue arrow). (H) Diagram for WL PSI complexes in (B, D), black arrows as in (G); PSI intradimer (green arrow) and interdimer (yellow and blue arrows) distances are indicated.
Fig. 4.
Fig. 4.. The effect of WL growth and FRL acclimation on the relative distribution of light-harvesting, photosystem, electron transport and ATP synthase subunits from C. thermalis 7203.
(A) Volcano plot showing the WL/FRL distributions of thylakoid proteins quantified by iBAQ. The data points are listed in data S1 together with details of the statistical analysis. The threshold of significance at P = 0.05 is indicated by a black line. Light-harvesting antenna proteins predominating under WL growth conditions are shown in blue points and those at relatively higher levels under FRL as red points shaded by a red background. Proteins that were only detected in the FRL group are not shown on the volcano plot but are listed alongside. (B) Relative distributions of PSI (Psa) and PSII (Psb) subunits quantified by the Top-N method to account for the occurrence of shared tryptic peptides resulting from shared sequence identity (see fig. S5). The data points are listed in data S2. (C) Relative distributions of thylakoid proteins quantified by iBAQ shown on an expanded x-axis scale. All highlighted subunits are more abundant in cells grown under WL: cytochrome b6f (PetA, PetB, and PetC in blue), NDH-1 (NdhA, NdhH, NdhI, NdhM, and NdhN in green), and ATP synthase (α, β, γ, δ, ε, b, and b′ in magenta). (D) FaRLiP gene cluster from C. thermalis 7203 showing PSI subunits (red), PSII subunits (green), phycobiliprotein subunits (blue), regulatory genes (brown), and Chl f synthase (magenta). The gene name is on the left of the gene cluster, and the locus tag is on the right.
Fig. 5.
Fig. 5.. Functional and structural imaging of C. thermalis 7203 cells grown under WL and FRL.
(A) False-color fluorescence images of WL cells. Scale bar, 4 μm. (B) False-color fluorescence images of FRL cells. Scale bar, 4 μm. (C) Left: Individual emission spectrum recorded from a single WL cell in (A) showing a peak emission at 680 nm. Right: Emission spectra of two FRL cells in (B) showing a peak at 680 nm and an additional peak at 735 nm. (D) Spectral maps of WL cells showing the emission intensity at 680 nm (left) and 735 nm (right); the strong signal at 680 nm is due to the maximal emission intensity of Chl a at this wavelength, and the much weaker signal at 735 nm is due to the weak emission of Chl a at this wavelength. Scale bars, 4 μm. (E) Spectral maps of FRL cells showing the emission intensity at 680 nm (left) and 735 nm (right); the strong signal at 680 nm is due to the presence of Chl a in FRL cells, and the much stronger signal at 735 nm relative to WL cells is due to the presence of Chl f, which maximally emits at this wavelength. Scale bars, 4 μm. (F to H) Cellular distribution of amplitude-weighted average lifetime images obtained at 680 nm for WL cells, 680 nm for FRL cells, and 735 nm for FRL cells, respectively. Scale bars, 4 μm. (I to K) Distribution of the lifetime values from (F) to (H), respectively, with the mean and SD of 1315 ± 121 ps for WL cells at 680 nm, 1090 ± 93 ps for FRL cells at 680 nm, and 964 ± 55 ps for FRL cells at 735 nm. (L) Electron micrograph of a thin section from WL cells. Scale bar, 1 μm. (M) Zoomed view of the area highlighted by the black square in (L) showing membrane spacings and morphology in more detail. Scale bar, 500 nm. (N) Electron micrograph of thin sections from FRL cells. Scale bar, 1 μm. (O) Zoomed view of the area highlighted by the black square in (N) showing a reduced spacing between adjacent thylakoid membranes relative to WL cells that is typical of FRL cells. Scale bar, 500 nm.

Similar articles

Cited by

References

    1. Flombaum P., Gallegos J. L., Gordillo R. A., Rincón J., Zabala L. L., Jiao N., Karl D. M., Li W. K., Lomas M. W., Veneziano D., Vera C. S., Present and future global distributions of the marine Cyanobacteria Prochlorococcus and Synechococcus. Proc. Natl. Acad. Sci. U.S.A. 110, 9824–9829 (2013). - PMC - PubMed
    1. Garcia-Pichel F., Belnap J., Neuer S., Schanz F., Estimates of global cyanobacterial biomass and its distribution. Algol. Stud. 109, 213–227 (2003).
    1. D. A Bryant, The Molecular Biology of Cyanobacteria (Springer Science & Business Media, 1994), vol. 1.
    1. Kühl M., Chen M., Ralph P. J., Schreiber U., Larkum A. W., A niche for cyanobacteria containing chlorophyll d. Nature 433, 820 (2005). - PubMed
    1. Chen M., Schliep M., Willows R. D., Cai Z. L., Neilan B. A., Scheer H., A red-shifted chlorophyll. Science 329, 1318–1319 (2010). - PubMed