. 2022 Feb 11;8(6):eabg9455.
doi: 10.1126/sciadv.abg9455. Epub 2022 Feb 9.

Screening of ETO2-GLIS2-induced Super Enhancers identifies targetable cooperative dependencies in acute megakaryoblastic leukemia

Affiliations

Screening of ETO2-GLIS2-induced Super Enhancers identifies targetable cooperative dependencies in acute megakaryoblastic leukemia

Salima Benbarche et al. Sci Adv. .

Abstract

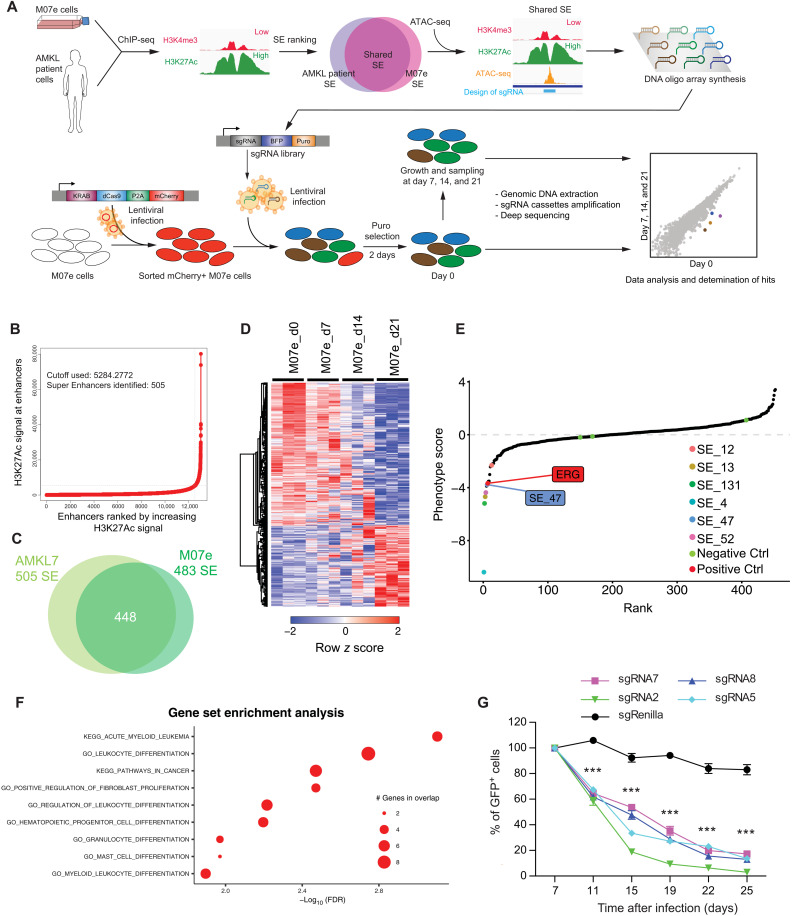
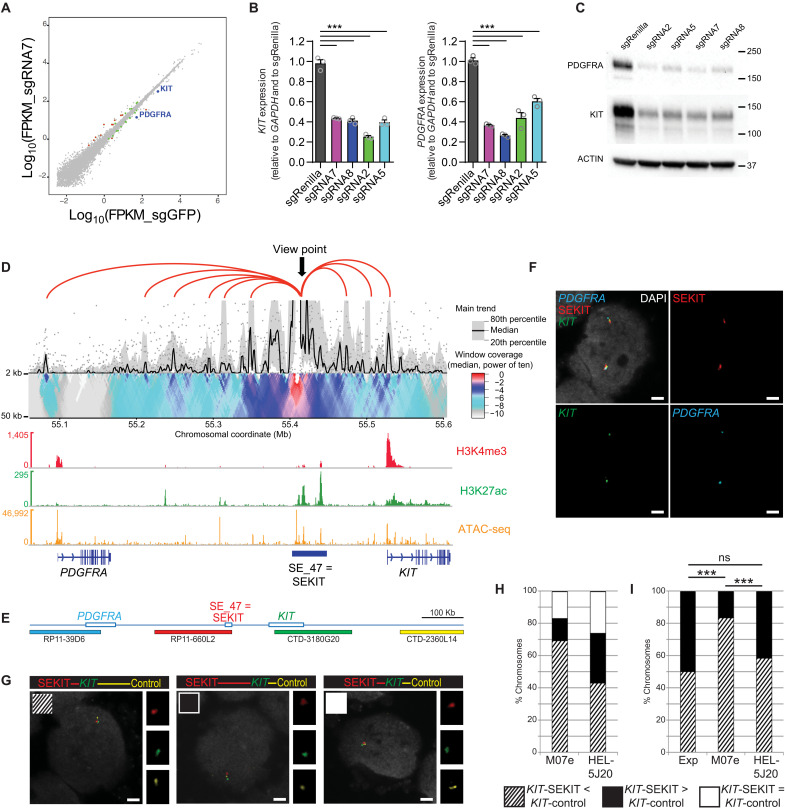
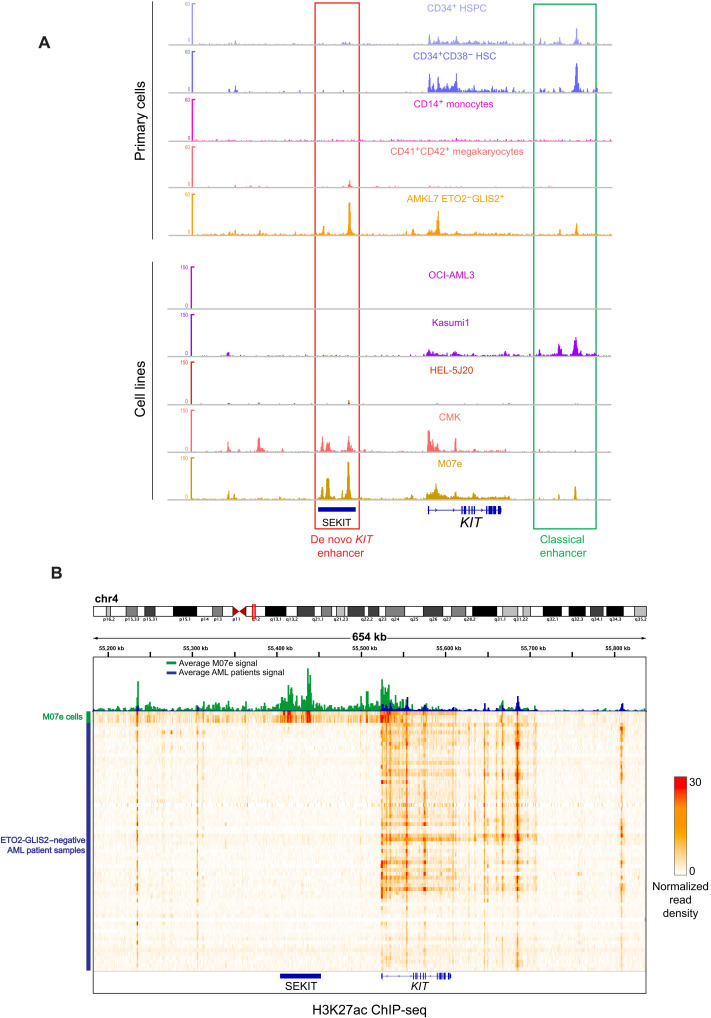
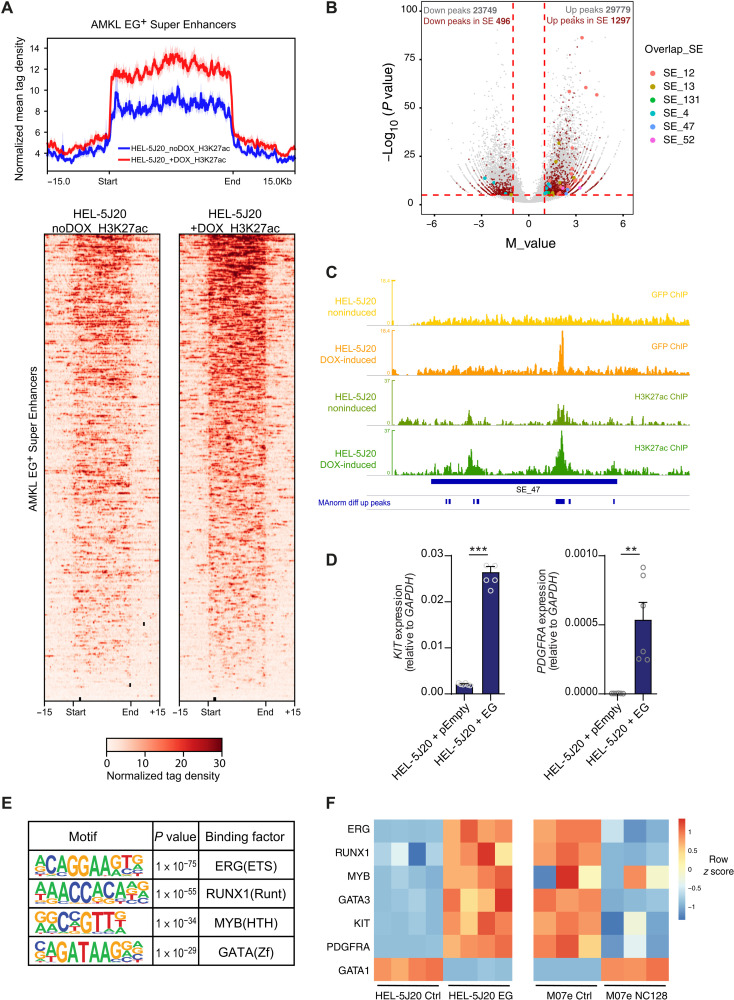
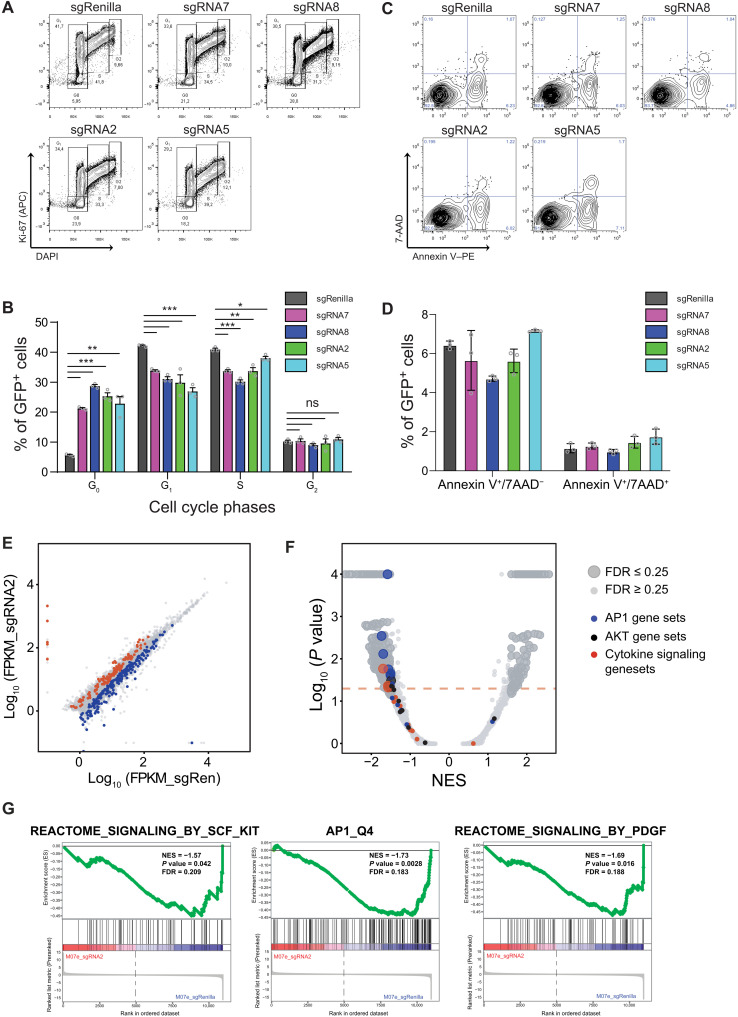
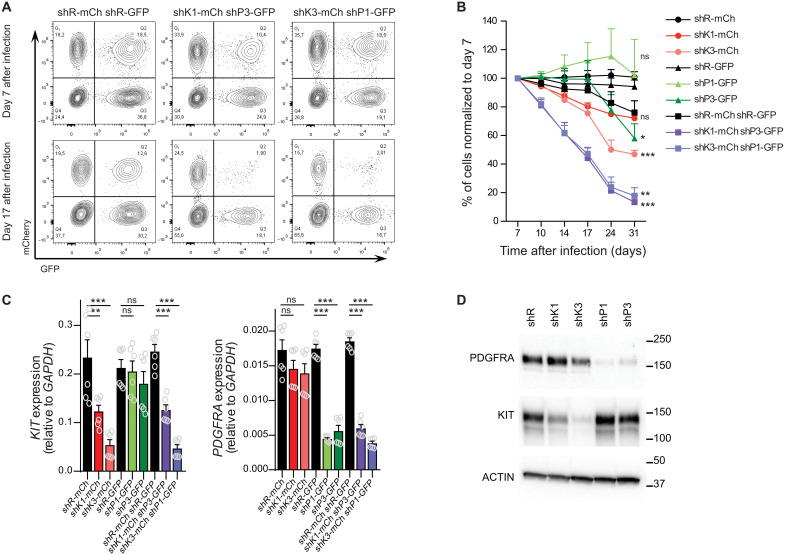
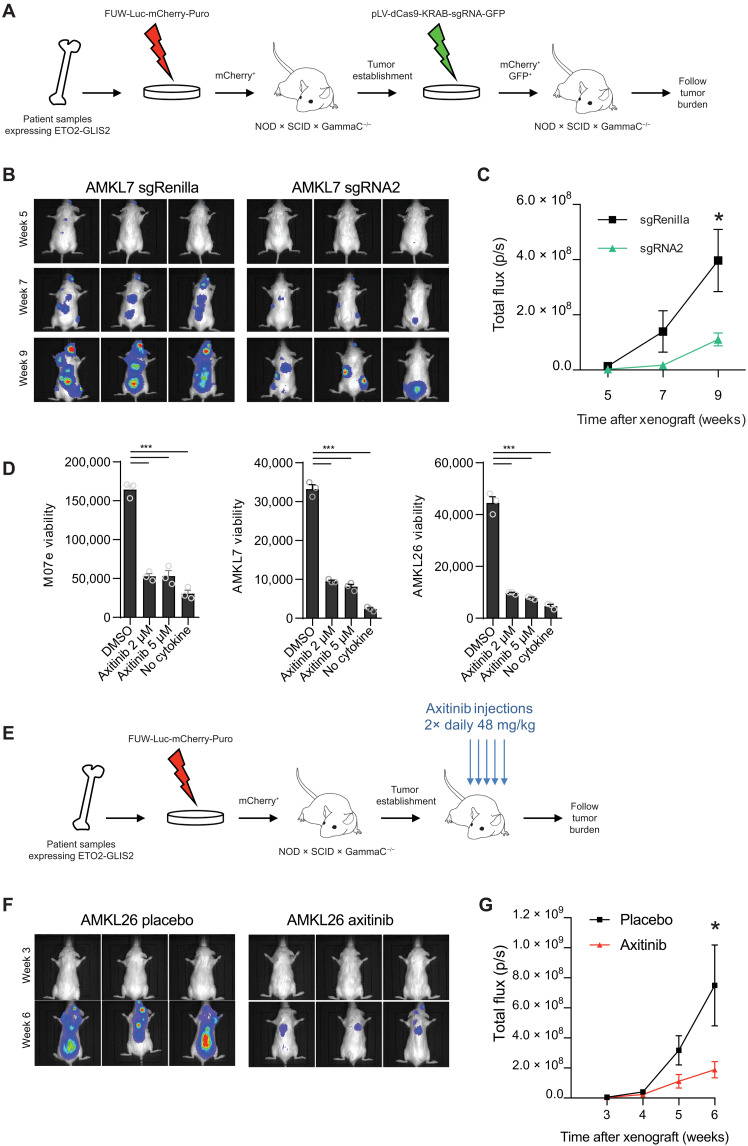
Super Enhancers (SEs) are clusters of regulatory elements associated with cell identity and disease. However, whether these elements are induced by oncogenes and can regulate gene modules cooperating for cancer cell transformation or maintenance remains elusive. To address this question, we conducted a genome-wide CRISPRi-based screening of SEs in ETO2-GLIS2+ acute megakaryoblastic leukemia. This approach revealed SEs essential for leukemic cell growth and survival that are induced by ETO2-GLIS2 expression. In particular, we identified a de novo SE specific of this leukemia subtype and regulating expression of tyrosine kinase-associated receptors KIT and PDGFRA. Combined expression of these two receptors was required for leukemic cell growth, and CRISPRi-mediated inhibition of this SE or treatment with tyrosine kinase inhibitors impaired progression of leukemia in vivo in patient-derived xenografts experiments. Our results show that fusion oncogenes, such as ETO2-GLIS2, can induce activation of SEs regulating essential gene modules synergizing for leukemia progression.


Figures

Fig. 1.
Fig. 1.. Genome-wide CRISPRi screen identifies essential SEs for leukemia growth.
(A) Schematic illustration of SEs screening strategy using CRISPRi in AMKL. (B) Distribution of H3K27Ac ChIP-seq density across enhancers in AMKL7 patient cells: the 505 enhancers located above the tangent with high level of signal represent SEs. (C) Venn diagram depicting the overlap between SE in M07e and AMKL7 cells. (D) Heatmap representation of 474 significantly enriched and 278 significantly depleted sgRNAs among three replicates of SE screening experiments in M07e cells. Representation of sgRNA with a minimum of 40× coverage and P < 0.05. (E) Pooled negative selection screening depicting changes in representation of all SE ranked by the average of their depletion or enrichment score of all sgRNAs across the three replicates at day 21 compared to day 0. Significantly depleted SE are highlighted in color. Position of SE_47 and ERG-positive control are shown. Negative controls are marked in green. (F) Two dimensional dot plot representing gene set enrichment analysis (GSEA) results of top SE hits associated genes. (G) Percentage of GFP+ M07e cells following CRISPRi targeting of SE_47 with indicated sgRNAs compared to control sgRenilla and normalized to day 7 after infection. Means ± SEM, n = 3, significance is determined using Student’s t test, ***P < 0.001.
Fig. 2.
Fig. 2.. SEKIT controls KIT and PDGFRA expression.
(A) Scatterplot showing gene expression variations following CRISPRi targeting with sgRNA7 compared to control sgGFP in M07e cells. Green dots P < 0.05, red dots P < 0.05, and >2-fold change. (B) qPCR showing KIT and PDGFRA expression following CRISPRi targeting of SE_47 (SEKIT) with indicated sgRNAs in M07e cells. Means ± SEM, n = 3, *** P < 0.001. (C) Western blot probing KIT, PDGFRA, and β-actin levels upon CRISPRi inhibition of SE_47 (SEKIT). (D) 4C-seq domainogram showing cis-contacts around SEKIT locus in M07e cells using 5-kb window size (top). Gene tracks with normalized read density histograms of H3K4me3 and H3K27ac ChIP-seq and ATAC-seq (bottom). (E) Scheme of the genomic region including PDGFRA (blue), SEKIT (red), KIT (green), and a control region for KIT (yellow) and corresponding BAC probes. (F) DNA FISH for PDGFRA (cyan), SEKIT (red), and KIT (green) in M07e cells. DNA was stained with DAPI (gray). Scale bars, 2 μm. (G) DNA FISH for KIT (green), SEKIT (red), and control region (yellow) in M07e or HEL-5J20 cells. DNA was stained with DAPI (gray). Scale bars, 2 μm. (H) Frequencies of chromosomes displaying the three configurations of distances in M07e and HEL-5J20 cells: KIT-SEKIT < KIT-control (striped bar), KIT-SEKIT > KIT-control (black bar), and KIT-SEKIT = KIT-control (white bar). (I) Frequencies of chromosomes displaying either the KIT-SEKIT < KIT-control (striped bar) or the KIT-SEKIT > KIT-control (black bar) configuration in M07e and HEL-5J20 cells as well as the expected distribution (Exp; 50/50%). ***P < 0.001, not significant (ns) P > 0.5.
Fig. 3.
Fig. 3.. SEKIT is a de novo enhancer strongly associated with ETO2-GLIS2+ leukemia cells.
(A) Gene track showing normalized read density histograms of H3K27ac ChIP-seq around the KIT gene in primary hematopoietic cells (CD34+ HSPC, CD34+CD38 HSC, CD14+ monocytes, CD41+CD42+ megakaryocytes, and ETO2-GLIS2+ AMKL7; top) and AML cell lines (Kasumi-1, OCI-AML3, and HEL-5J20) and AMKL cell lines (CMK and M07e) (bottom). Classical and de novo KIT enhancers are highlighted. Read densities are shown as unique reads per million. (B) Heatmap representing normalized read density of H3K27ac ChIP-seq of 66 AML patients negative for ETO2-GLIS2 fusion and three replicates of ETO2-GLIS2+ M07e cell line at SEKIT, and KIT locus. Top panel shows average intensity signal for AML patients (blue histogram) and M07e cells (green histogram).
Fig. 4.
Fig. 4.. Ectopic ETO2-GLIS2 expression induces specific Super Enhancer activation.
(A) Profile plot of normalized mean tag density (top) and heatmap of normalized tag density (bottom) of H3K27ac ChIP-seq in HEL-5J20 cells stably expressing doxycycline (DOX)–inducible ETO2-GLIS2 (EG) before and after DOX treatment at 448 SE regions defined in EG+ AMKL cells. (B) Volcano plot showing M value against −log10(P value) of H3K27ac peaks upon differential analysis. Clarets, peaks overlapping SE regions of EG+ AMKL; colors, peaks overlapping top hit SE from CRSIPRi screen. (C) Normalized read density histograms of H3K27ac ChIP-seq analysis at SEKIT locus upon ETO2-GLIS2 expression induction in HEL-5J20 cells compared to noninduced cells (khaki and green tracks, respectively) and read densities of GFP ChIP-seq in noninduced versus DOX-induced HEL-5J20 cells (yellow and orange tracks, respectively) showing ETO2-GLIS2 binding in SEKIT locus. Differentially up-regulated peaks are shown. (D) qPCR showing KIT and PDGFRA expression upon DOX-induced ETO2-GLIS2 expression in HEL-5J20 cells compared cells transduced with empty vector. Means ± SEM, representative of two independent experiments in triplicate, **P < 0.01, ***P < 0.001. (E) Motifs analysis under AMKL ATAC-seq peaks overlapping H3K27ac peaks up-regulated in HEL-5J20 cells expressing ETO2-GLIS2. (F) Heatmap showing variation of expression of selected genes in HEL-5J20 control or expressing ETO2-GLIS2 (left) or M07e cells expressing control or NC128 peptide (right).
Fig. 5.
Fig. 5.. SEKIT inhibition induces down-regulation of pro-proliferative transcriptional programs.
(A) Representative flow cytometry analysis showing Ki-67 (APC) and DAPI staining gated on transduced GFP+ M07e cells following CRISPRi targeting of SEKIT with indicated sgRNAs and compared to control sgRenilla. APC, Allophycocyanin. (B) Quantification of cell cycle phases as analyzed in (A). Means ± SEM, n = 3, significance is determined using Student’s t test, *P < 0.05, ** P < 0.01, ***P < 0.001. (C) Representative flow cytometry analysis showing annexin V–PE and 7-AAD (viable dye) staining gated on transduced GFP+ M07e cells following CRISPRi targeting of SEKIT with indicated sgRNAs and compared to control sgRenilla. (D) Quantification of apoptosis as analyzed in (C). Means ± SEM, n = 3. (E) Scatterplot showing significantly depleted (blue) or enriched (red) genes after 4 days of transduction with sgSEKIT2. Dots represent average of log10FPKM across the two replicates. (F) Volcano plot representing GSEA of expression changes in M07e cells expressing SEKIT-targeting sgRNA2 versus sgRenilla. Normalized enrichment scores (NES) are plotted against P values. Red dotted line represents threshold of P < 0.05, gene sets with false discovery rate (FDR) > 0.25 are represented as small dots and gene sets with FDR < 0.25 are represented as large dots. (G) GSEA profiles of representative gene sets negatively correlated in sgRNA2.
Fig. 6.
Fig. 6.. Combined KIT and PDGFRA expression is required for M07e cell growth.
(A to D Two independent shRNAs targeting either KIT (shK) or PDGFRA (shP) were expressed in M07e cells separately or in combination. shK are expressed with mCherry (mCh) in cells while shP are expressed with GFP. Corresponding shRNAs targeting Renilla (shR) were used as control. Cells are maintained in the presence of GM-CSF. (A) Representative flow cytometry analysis of shRNA expressing cells at days 7 and 17 after infection. (B) Percentage of shRNA expressing M07e cells normalized to day 7 after infection. Means ± SEM, n = 4, significance is determined using Student’s t test, *P < 0.05, **P < 0.01, ***P < 0.001. (C) qPCR showing KIT and PDGFRA expression at day 4 after infection. Means ± SEM, n = 3, significance is determined using Student’s t test, **P < 0.01, ***P < 0.001. (D) Western blot probing KIT and PDGFRα levels upon shRNA knockdown. Western blot against β-actin is shows as a loading control.
Fig. 7.
Fig. 7.. SEKIT targeting inhibits AMKL progression in vivo.
(A) Schematic illustration describing CRISPRi targeting of SEKIT in vivo using patient-derived xenograft model. (B) Representative bioluminescent imaging of NSG recipient mice transplanted with sgRNA2- or sgRenilla-transduced AMKL7lucmCherry+ patient cells at indicated posttransplant time. (C) Quantification of bioluminescence in vivo as analyzed in (B). Means ± SEM, n = 5, statistical significance is determined using Student’s t test, *P < 0.05. (D) Viability of the M07e cell line, AMKL7, and AMKL26 patient cells treated with axitinib or vehicle (DMSO) for 96 hours. Negative control without cytokine is shown. Means ± SEM, n = 3, significance is determined using Student’s t test, ***P < 0.001. (E) Schematic illustration describing axitinib treatment strategy in vivo using patient-derived xenograft model. (F) Representative bioluminescent imaging of NSG recipient mice transplanted with AMK26lucmCherry+ patient cells treated with vehicle or axitinib at indicated posttransplant time. (G) Quantification of bioluminescence in vivo as analyzed in (F). Means ± SEM, n = 10, statistical significance is determined using Student’s t test, *P < 0.05.

Similar articles

Cited by

References

    1. Meyerson M., Gabriel S., Getz G., Advances in understanding cancer genomes through second-generation sequencing. Nat. Rev. Genet. 11, 685–696 (2010). - PubMed
    1. Pott S., Lieb J. D., What are super-enhancers? Nat. Genet. 47, 8–12 (2015). - PubMed
    1. Sengupta S., George R. E., Super-enhancer-driven transcriptional dependencies in cancer. Trends Cancer 3, 269–281 (2017). - PMC - PubMed
    1. Whyte W. A., Orlando D. A., Hnisz D., Abraham B. J., Lin C. Y., Kagey M. H., Rahl P. B., Lee T., Young R. A., Master transcription factors and mediator establish super-enhancers at key cell identity genes. Cell 153, 307–319 (2013). - PMC - PubMed
    1. Lovén J., Hoke H. A., Lin C. Y., Lau A., Orlando D. A., Vakoc C. R., Bradner J. E., Lee T., Young R. A., Selective inhibition of tumor oncogenes by disruption of super-enhancers. Cell 153, 320–334 (2013). - PMC - PubMed