. 2022 Feb 11;8(6):eabm6393.
doi: 10.1126/sciadv.abm6393. Epub 2022 Feb 9.

Mutant glucocerebrosidase impairs α-synuclein degradation by blockade of chaperone-mediated autophagy

Affiliations

Mutant glucocerebrosidase impairs α-synuclein degradation by blockade of chaperone-mediated autophagy

Sheng-Han Kuo et al. Sci Adv. .

Abstract

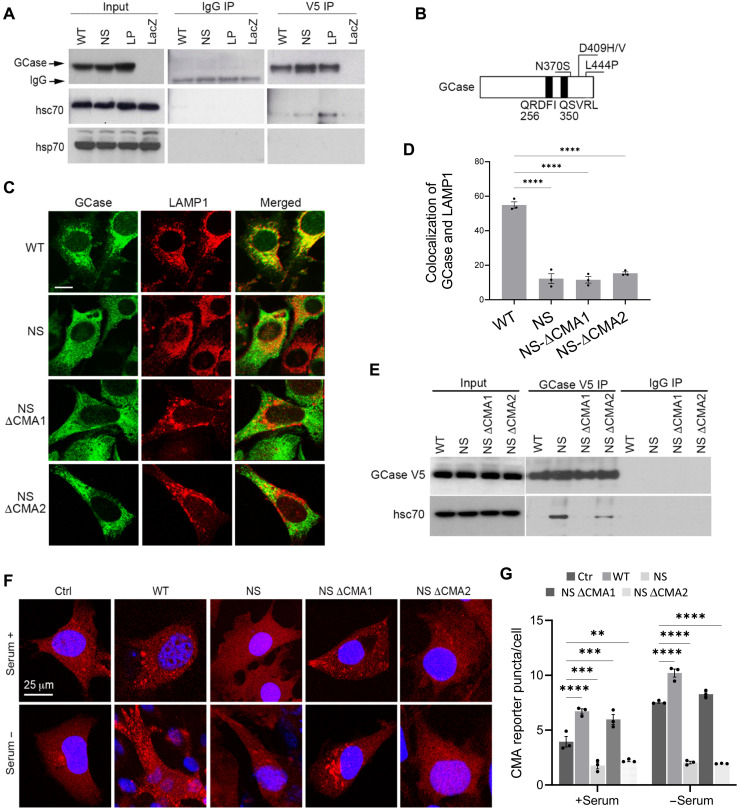
The most common genetic risk factors for Parkinson's disease (PD) are a set of heterozygous mutant (MT) alleles of the GBA1 gene that encodes β-glucocerebrosidase (GCase), an enzyme normally trafficked through the ER/Golgi apparatus to the lysosomal lumen. We found that half of the GCase in lysosomes from postmortem human GBA-PD brains was present on the lysosomal surface and that this mislocalization depends on a pentapeptide motif in GCase used to target cytosolic protein for degradation by chaperone-mediated autophagy (CMA). MT GCase at the lysosomal surface inhibits CMA, causing accumulation of CMA substrates including α-synuclein. Single-cell transcriptional analysis and proteomics of brains from GBA-PD patients confirmed reduced CMA activity and proteome changes comparable to those in CMA-deficient mouse brain. Loss of the MT GCase CMA motif rescued primary substantia nigra dopaminergic neurons from MT GCase-induced neuronal death. We conclude that MT GBA1 alleles block CMA function and produce α-synuclein accumulation.


Figures

Fig. 1.
Fig. 1.. Differential lysosomal status of WT and MT GCase.
(A to D) SH-SY5Y cells stably expressing myc-tagged WT or indicated MT GCase (NS, N370S; LP, L444P; DH, D409H) were immunolabeled with myc and the lysosomal marker LAMP1 or the ER marker BiP. n = 3 independent experiments. Scale bar, 10 μm. (E) Primary mouse dopamine neuronal cultures were transduced with lentivirus to express human WT or NS GCase constructs tagged with V5 and immunolabeled with V5, LAMP1, and tyrosine hydroxylase (TH). n = 3 independent experiments. Scale bar, 10 μm. (F) Subcellular fractionation of SH-SY5Y expressing indicated MT GCase. Top: Representative immunoblots for the indicated proteins of homogenates (H, Hom) and lysosomes (Lys). Bottom: Quantification of lysosomal GCase content relative to WT and LAMP1 levels, an endosomal/ lysosomal marker: LAMP1 was used as LAMP2A levels are highly altered by cellular stress. n = 3 in each group. (G to I) SH-SY5Y cells expressing WT or indicated MT GCase constructs were subjected to subcellular fractionation to separate ER and cytosol. Representative immunoblots of cytosol and ER for the indicated proteins [(G); only immature cathepsin D (50 kDa) is detected in the ER fractions] and quantification of the amount of each protein in the ER expressed relative to control assigned an arbitrary value of 1 (H) and in the cytosol as percentage of their content in ER (I). n = 3. Values are means ± SEM and individual experiments in (C) to (E). Differences with control were significant for *P < 0.05, **P < 0.01, ***P < 0.001, and ****P < 0.0001.
Fig. 2.
Fig. 2.. Subcellular distribution of WT and MT GBA in human iPSC-derived DA neurons and fibroblasts and transgenic mouse brains.
(A) Representative immunoblots of ER and cytosol (Cyt) from iPSCs-derived human DA neurons from a healthy control with WT GBA1 (WT/WT) and a pair of twins with heterozygous N370S GBA1 mutation (WT/NS), one with (**) and one without PD (*). (B) Representative immunoblot (top) and quantification of GCase (bottom) in lysosomes isolated from human iPSCs derived from WT/WT and CRISPR-mediated knock-in three isogenic NS/NS MT lines. (C) iPSC-derived DA neurons from a healthy WT/WT and PD WT/NS subject labeled by LysoTracker. Scale bar, 25 μm. (D) iPSC-derived DA neurons from subjects with WT/WT, WT/NS (non-PD), and WT/NS (PD) were FACS-sorted to ~80% purity, and lysosomal markers were analyzed by Western blot. n = 2 clones from each individual. (E to H) Representative immunoblots of cytosol (E) and lysosomes (G and H) from brains of heterozygous L444P GBA1 (WT/LP) and WT mice. Quantification of each protein is shown at the right. n = 3. (I and J) Representative immunoblots (I) and quantification of GCase (J) in homogenates and cytosol from human fibroblasts with WT/WT or WT/LP. (K) Trypsin resistance of GCase in lysosomes isolated from postmortem human brain of control WT/WT and PD cases with NS/LP. Values are means ± SEM. Differences with control were significant for *P < 0.05, **P < 0.01, and ***P < 0.001.
Fig. 3.
Fig. 3.. MT GCase binding and uptake by lysosomes.
(A) Immunoblot of human fibroblasts with either WT/WT or WT/NS genotypes incubated with NH4Cl and leupeptin (N/L) or the proteasome inhibitor MG-132 (MG), a pan-deubiquitinase inhibitor (DUBi), or an inhibitor of p97. Ubiquitin is shown as control of inhibitor efficiency and Ponceau staining as loading control. (B) Quantification of the levels of GCase upon the indicated treatments in the indicated human fibroblast genotypes. n = 3. (C) Schematic of the assays for in vitro lysosomal binding and uptake in the isolated lysosomes. (D) Purified and denatured WT GCase and the indicated MTs were incubated with intact isolated lysosomes untreated or treated with proteinase inhibitors (PI). (E) Percentage of denatured GCase bound or taken up by lysosomes. n = 5. (F and G) Association of increasing concentrations of denatured LP (E) or NS (F) GCase proteins with lysosomes. Representative immunoblot (left) and quantification (right). (H and I) Trypsin and proteinase K resistance of WT and different MT GCase incubated with isolated lysosomes as in (A) (H) or of lysosomes from brains of GBA+/L444P and WT mice (I). (J) High exposure of a representative immunoblot of the incubation of denatured GCase proteins with lysosomes to reveal formation of high–molecular weight complex of the proteins at the lysosomal membrane. (K) Intact rat liver lysosomes were incubated with either WT or MT GCase alone (−) or with increasing concentrations of the CMA substrate RNase A at 37°C. Samples were collected by centrifugation and immunoblotted for GCase. Input: 0.04 μg of WT or MT GCase protein (left). Calculation of the amount of GCase associated with lysosomes (right). Values are expressed as percentage of the protein bound when incubated alone. n = 3. Values are means ± SEM. Differences with control were significant for *P < 0.05 and **P < 0.01.
Fig. 4.
Fig. 4.. MT GCase blocks CMA.
(A to D) CMA activity in cells transduced with a lentiviral vector carrying the KFERQ-PA-mCherry1 fluorescent reporter. (A and B) NIH3T3 cells stably transduced with AAV carrying GFP (Ctrl), WT GCase, or MT GCase (NS, LP, or DH) in the presence or absence of serum for 12 hours after photoactivation. (C and D) Human fibroblasts from WT/WT, WT/NS, or WT/LP in the presence or absence of serum for 12 hours after photoactivation. Representative micrographs (A and C) and quantification of the average number of puncta per cell in n = 3 independent experiments (B and D). (E to H) NIH3T3 cells expressing lentivirus carrying V5-tagged WT or NS or WT or NS GCase without the leader sequence of the first 39 amino acids, immunolabeled for V5 and LAMP1, n = 3 independent experiments (E and F). The same NIH3T3 lines transduced with a lentiviral vector carrying the KFERQ-PA-mcherry1 CMA reporter in the presence or absence of serum for 12 hours after photoactivation, n = 3 independent experiments (G and H). Values are means ± SEM and individual experiments. *P < 0.05, **P < 0.01, ***P < 0.001, and ****P < 0.0001.
Fig. 5.
Fig. 5.. Hsc70-mediated lysosomal targeting of MT GCase blocks CMA.
(A) NIH3T3 cells transduced with lentivirus carrying LacZ and WT or MT GCase tagged with V5 were subjected to coimmunoprecipitation using anti-V5 antibodies and probed with V5, hsc70, and hsp70. (B) Scheme of GCase protein depicting the two putative KFERQ-like CMA-targeting motifs and MT GCases. (C and D) NIH3T3 cells transduced with lentivirus carrying WT, NS, NS with the first CMA motif mutated (NSΔCMA1), or NS GCase with the second CMA motif mutated (NSΔCMA2) tagged with V5 were subjected to dual immunolabel for V5 and LAMP1. Representative images. Scale bar, 10 μm. (C) Quantification of the colocalization of GCase and LAMP1, n = 3 independent experiments (D). (E) Coimmunoprecipitation using anti-V5 antibodies in the same cells as (C), probed with V5 and hsc70. (F and G). The same cells were transduced with a lentiviral vector carrying the KFERQ-PA-mCherry1 fluorescent reporter and after photoactivation maintained 12 hours in the presence of serum or in the serum withdrawal condition. (F) Representative micrographs. (G) Number for puncta per cell. n = 3 independent experiments. Values are means ± SEM and individual experiments. Differences with control were significant for **P < 0.01, ***P < 0.001, and ****P < 0.0001.
Fig. 6.
Fig. 6.. GCase and degradation of α-synuclein and tau.
(A and B) Representative immunoblot (A) and quantification of α-synuclein monomer levels (B) in rat cortical neuronal cultures expressing WT or MT GCase (NS, LP, and DH) for 7 days. (C) α-Synuclein levels in M17 cells at indicated times after 24-hour induction with doxycycline. (D and E) α-Synuclein degradation in the same cells as (C) transduced with lentivirus carrying WT, MT GCase, or MT GCase with the first or second CMA motifs mutated (NSΔCMA1 and NSΔCMA2, respectively). (F) Immunoblots of α-synuclein incubated with lysosomes treated or not with proteinase inhibitors (PI) in the presence of increased concentration of denatured WT and MT GCase. (G and H) Monomers of α-synuclein bound or taken up by lysosomes. (I) Oligomers of α-synuclein bound to lysosomes. (J) GCase proteins bound and taken up by lysosomes in the presence or absence of α-synuclein. (K) Immunoblots of tau incubated with lysosomes treated as in (F). (L and M) Quantification of tau bound or taken up by lysosomes. (N) Quantification of GCase bound or taken up in the presence of tau. (O) Immunoblot (left) and quantification (right) of endogenous levels of tau and GAPDH in homogenate and CMA active lysosomes isolated from brains of GBA+/L444P (LP) and WT mice. (P) Blue native electrophoresis and immunoblot for LAMP2A of lysosomes incubated as in (F) in the presence of PI but with indicated GCase MTs. (Q) Changes in levels of multimeric LAMP2A. n = 3. (R) Viability of ventral midbrain dopamine neuronal cultures from WT or α-synuclein knockout mice transduced with lentivirus carrying WT or NS GCase for 7 days. Values are means ± SEM. Differences with control (*) were significant for *P < 0.05 or **P < 0.01.
Fig. 7.
Fig. 7.. Disruption of CMA phenocopies the proteostasis alterations of GBA-PD human neurons.
(A and B) Normalized gene (A) or protein (B) expression (z scoring within each cell type) of CMA network components (organized in functional groups) (top) and CMA activation score (bottom) of excitatory and inhibitory neurons from brains of healthy controls and idiopathic PD and GBA-PD patients (A) or human iPSC differentiated dopaminergic (hiPSCd DA) neurons from control (WT/WT) or GBA MT (WT/NS) patients. (C) CMA activity in the same cells as (B) transduced with a lentiviral vector carrying the KFERQ-PA-mCherry1 fluorescent reporter 12 hours after photoactivation. Representative images (top) and quantification n = 3 independent experiments (bottom). Individual values per experiment and means ± SEM are shown. Insets show the boxed regions at high magnification to display puncta (arrows). **P < 0.01. (D) Comparison of proteome changes between GBA-PD and healthy control brains and between human iPSC differentiated dopaminergic (DA) neurons from GBA1 WT/WT and GBA1 WT/NS patients in Log2 fold change (FC) in levels of proteins. Red and green indicate proteins that increase or decrease, respectively, in both groups and number of protein in each group are indicated in blue. (E) Changes in protein and mRNA levels of the indicated PD-related genes and genes associated with PD risk in the soluble fraction of brains from GBA-PD patients relative to healthy controls. Values are expressed as log fold change. (F to H) Comparison of proteome changes between GBA-PD and healthy control brains and between L2AKO mice brains relative to their matching controls. Log2 fold change (FC) in levels of proteins (F). Red and green indicate proteins that increase or decrease, respectively, in both groups, Venn diagram of significantly changing proteins in each group (G), and STRING pathway analysis (H) with the proteins changing in both groups. (I and J) Examples of proteins more abundant in the GBA-PD human brain and L2AKO mice brain relative to their respective controls that show decreased association with lysosomes (I) and of proteins with detectable lower levels of both groups that show decreased association with lysosomes and increased abundance in protein aggregates (J). All GO terms are statistically enriched with P < 0.001.
Fig. 8.
Fig. 8.. MT GCase induces CMA toxicity.
Upon folding in the ER, GCase normally traffics through the Golgi from where it is targeted to lysosomes in the lumen of small vesicles. MT GCase that fails to achieve proper folding is retrotranslocated from the ER into the cytosol for ER-associated degradation (ERAD) by the proteasome. In this study, we found that a fraction of this MT GCase is recognized by hsc70 that targets it to lysosomes for CMA degradation. MT GCase displays a very inefficient lysosomal internalization via the LAMP2A multimeric translocation complex, thus blocking degradation of other CMA substrates including α-synuclein.

Similar articles

Cited by

References

    1. Cuervo A. M., Stefanis L., Fredenburg R., Lansbury P. T., Sulzer D., Impaired degradation of mutant alpha-synuclein by chaperone-mediated autophagy. Science 305, 1292–1295 (2004). - PubMed
    1. Orenstein S. J., Kuo S. H., Tasset I., Arias E., Koga H., Fernandez-Carasa I., Cortes E., Honig L. S., Dauer W., Consiglio A., Raya A., Sulzer D., Cuervo A. M., Interplay of LRRK2 with chaperone-mediated autophagy. Nat. Neurosci. 16, 394–406 (2013). - PMC - PubMed
    1. Kabuta T., Furuta A., Aoki S., Furuta K., Wada K., Aberrant interaction between Parkinson disease-associated mutant UCH-L1 and the lysosomal receptor for chaperone-mediated autophagy. J. Biol. Chem. 283, 23731–23738 (2008). - PMC - PubMed
    1. Wang B., Cai Z., Tao K., Zeng W., Lu F., Yang R., Feng D., Gao G., Yang Q., Essential control of mitochondrial morphology and function by chaperone-mediated autophagy through degradation of PARK7. Autophagy 12, 1215–1228 (2016). - PMC - PubMed
    1. Tang F. L., Erion J. R., Tian Y., Liu W., Yin D. M., Ye J., Tang B., Mei L., Xiong W. C., VPS35 in dopamine neurons is required for endosome-to-golgi retrieval of Lamp2a, a receptor of chaperone-mediated autophagy that is critical for α-synuclein degradation and prevention of pathogenesis of Parkinson’s disease. J. Neurosci. 35, 10613–10628 (2015). - PMC - PubMed