. 2022 Feb 11;8(6):eabm2382.
doi: 10.1126/sciadv.abm2382. Epub 2022 Feb 9.

A functional genomic approach to actionable gene fusions for precision oncology

Affiliations

A functional genomic approach to actionable gene fusions for precision oncology

Jun Li et al. Sci Adv. .

Abstract

Fusion genes represent a class of attractive therapeutic targets. Thousands of fusion genes have been identified in patients with cancer, but the functional consequences and therapeutic implications of most of these remain largely unknown. Here, we develop a functional genomic approach that consists of efficient fusion reconstruction and sensitive cell viability and drug response assays. Applying this approach, we characterize ~100 fusion genes detected in patient samples of The Cancer Genome Atlas, revealing a notable fraction of low-frequency fusions with activating effects on tumor growth. Focusing on those in the RTK-RAS pathway, we identify a number of activating fusions that can markedly affect sensitivity to relevant drugs. Last, we propose an integrated, level-of-evidence classification system to prioritize gene fusions systematically. Our study reiterates the urgent clinical need to incorporate similar functional genomic approaches to characterize gene fusions, thereby maximizing the utility of gene fusions for precision oncology.


Figures

Fig. 1.
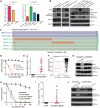
Fig. 1.. Overview of our functional genomics approach and the fusion candidates assayed.
(A) Schematic representation of the functional genomics platform for fusion genes. ORF 1, open reading frame 1; GFP, green fluorescent protein. ****P < 0.0001. (B) The Pharos target classification for 90 gene fusions. TClin, genes with at least one FDA-approved drug; TChem, genes with at least one ChEMBL compound with an activity cutoff of <30 nM; and TBio, genes without known drug or small-molecule activities. (C) Snapshot of the FASMIC: Gene fusion data portal.
Fig. 2.
Fig. 2.. Summary of our large-scale functional annotation of gene fusions in cancer.
(A) Proportions of partner genes exhibiting activating effects in activating fusions versus no-effect fusions. P value is based on a chi-square test. (B) Numbers of TCGA samples (left) and cancer types (right) associated with characterized recurrent fusions (detected in ≥2 samples). The activating fusions are labeled in red; otherwise, in blue. P value is based on a Wilcoxon test. (C) Comparison of centrality scores between activating and no-effect fusions. P value is based on a Wilcoxon test. (D) Distribution of partner genes in the same or different chromosomes between activating fusions and no-effect fusions. P value is based on a chi-square test.
Fig. 3.
Fig. 3.. Summary of assayed fusion genes in the RTK/RAS pathway.
(A) All 42 RTK/RAS fusions are highlighted in solid rectangular boxes with the numbers in the brackets indicating the number of corresponding gene fusions assayed. (B) Summary of all tumors across 33 TCGA cancer types, including cases that carry gene fusions and/or mutations in genes of the RTK-RAS pathway (n = 9105). The presence of aberration is displayed on the Y axis, while all patients are displayed on the X axis. Color indicates tumor type. Gray indicates the absence of RTK-RAS aberration. (C) The bipartite network shows the occurrence of each fusion family across cancer types. The width of each edge is proportional to the number of patients harboring the linked fusion.
Fig. 4.
Fig. 4.. Effects of ALK fusions on cell viability and drug response.
(A) Schematics of the genomic structure and mRNA transcript of the TPM1-ALK fusion gene. Breakpoints in both genes are indicated by linked arrows. The mRNA expression levels relative to expression levels in the tumor type at the exon level are illustrated. The red bar indicates exons coding for the tyrosine kinase domains. (B) Ba/F3 cell survival assay for TPM1-ALK (mean luminescence, error bars denote SD, n = 3) compared to the positive control, EML4-ALK. GFP = negative control. (C) Quantitative PCR-based expression of full-length wild-type TPM1 and ALK expressed in Ba/F3 (mean expression fold change normalized to the parental negative control, error bars denote SD, n = 3). (D) Ba/F3 cell survival assay for full-length, wild-type TPM1 and ALK compared to TPM1-ALK (mean luminescence, error bars denote SD, n = 3). (E) Immunoblots of TPM1-ALK and EML4-ALK expression and signaling pathway activation in Ba/F3. Arrows denote the correct sizes of TPM1-ALK and EML4-ALK. (F) Dose-dependent survival assays of Ba/F3 cells expressing TPM1-ALK treated with crizotinib for 72 hours (mean percentage of cell survival, error bars denote SD, n = 4). (G) Crizotinib drug sensitivity comparison between cell lines with and without ALK fusions. P value is based on a Wilcoxon test. (H and I) Correlation analysis between crizotinib drug sensitivity and ALK gene expression in cell lines with ALK fusions (H) or without ALK fusions (I). AUC, area under the curve. (J) NVP-TAE684 drug sensitivity comparison between cell lines with or without ALK fusions. (K and L) Correlation analysis between NVP-TAE684 drug sensitivity and ALK gene expression in cell lines with ALK fusions (K) or without ALK fusions (L). (B and D) All P values are calculated by t test; ns, not significant; ****P < 10−4. (G to L) Drug data: CTRPv2. RSEM, RNA-seq by expectation maximization.
Fig. 5.
Fig. 5.. Effects of RAF1 and BRAF fusions on cell viability and drug response.
(A) Ba/F3 cell survival assay for RAF1 and BRAF fusions (mean luminescence, error bars denote SD, n = 3 for each group). BRAFV600E = positive control and GFP = negative control. (B) Immunoblots of RAF1 and BRAF fusion expression and MAPK signaling activation in Ba/F3. (C) Distribution of the indicated fusion and somatic mutation events across TCGA melanoma cases. Samples with activating RAS/BRAF mutations are shown in red. (D) Dose-dependent survival assays of Ba/F3 cells expressing RAF1 fusions treated with trametinib for 72 hours. (E) End-point volumes (CLCN6-RAF1, day 23 after injection) of tumors by HMEL cells expressing CLCN6-RAF1 (n = 10) and GFP control (n = 10). (F) Trametinib drug sensitivity comparison between cell lines with or without RAF1 fusions. P value is based on a Wilcoxon test. Drug data: GDSC. (G) Immunoblot analysis of lysates from preinjected HMEL cells and tumors expressing CLCN6-RAF1. (H) BRAF fusions treated with trametinib for 72 hours (mean percentage of cell survival, error bars denote SD, n = 4 for all groups). (I) End-point volumes (TAX1BP1-BRAF, day 43 after injection) of tumors by HMEL cells expressing TAX1BP1-BRAF (n = 10) and GFP control (n = 10). Horizontal bars denote mean volumes; error bars denote SD. (J) Immunoblot analysis of lysates from preinjected HMEL cells, tumors, and tumor-derived cell line expressing TAX1BP1-BRAF. (A and E) All P values calculated by t test; ****P < 10−4.
Fig. 6.
Fig. 6.. Frequency and functional effects of FGFR fusions.
(A) Summary of FGFR fusions across TCGA Pan-Cancers. (B) Schematics of the genomic structure and mRNA transcripts of FGFR3-ELAVL3. (C) MCF10A anchorage–independent colony formation assays for FGFR3-ELAVL3 (mean colony count from 10 random areas, error bars denote SD, n = 3). PIK3CAH1047R = positive control and GFP = negative control. (D) Immunoblots of FGFR3-ELAVL3 expression and signaling pathway activation in MCF10A. All P values calculated by t test; ***P < 0.005 and ****P < 0.0001. BLCA, bladder urothelial carcinoma; BRCA, breast invasive carcinoma; CESC, cervical squamous cell carcinoma and endocervical adenocarcinoma; CHOL, cholangiocarcinoma; ESCA, esophageal carcinoma; GBM, glioblastoma multiforme; HNSC, head and neck squamous cell carcinoma; KIRP, kidney renal papillary cell carcinoma; LAML, acute myeloid leukemia; LGG, brain low-grade glioma; LIHC, liver hepatocellular carcinoma; LUAD, lung adenocarcinoma; LUSC, lung squamous cell carcinoma; OV, ovarian serous cystadenocarcinoma; PRAD, prostate adenocarcinoma; SKCM, skin cutaneous melanoma; STAD, stomach adenocarcinoma; THCA, thyroid carcinoma; UCEC, uterine corpus endometrial carcinoma; and UVM, uveal melanoma.
Fig. 7.
Fig. 7.. An evidence-based classification system for prioritizing actionable gene fusions.
(A) Overview of the four-level evidence-based classification system to actionable gene fusions for precision oncology. WT, wild type. (B) Summary of fusion classifications in the RTK-RAS pathway based on fusions identified from TCGA patient cohort. L2 fusions only include those that we assessed functionally, and L1 fusions include those with clinical evidence, not necessarily assessed in this study. **** indicates statistical significance. (C) Timeline of our fusion functional assessment pipeline in a clinical setting.

References

    1. Rowley J. D., Letter: A new consistent chromosomal abnormality in chronic myelogenous leukaemia identified by quinacrine fluorescence and Giemsa staining. Nature 243, 290–293 (1973). - PubMed
    1. Knezevich S. R., McFadden D. E., Tao W., Lim J. F., Sorensen P. H., A novel ETV6-NTRK3 gene fusion in congenital fibrosarcoma. Nat. Genet. 18, 184–187 (1998). - PubMed
    1. Tomlins S. A., Rhodes D. R., Perner S., Dhanasekaran S. M., Mehra R., Sun X.-W., Varambally S., Cao X., Tchinda J., Kuefer R., Lee C., Montie J. E., Shah R. B., Pienta K. J., Rubin M. A., Chinnaiyan A. M., Recurrent fusion of TMPRSS2 and ETS transcription factor genes in prostate cancer. Science 310, 644–648 (2005). - PubMed
    1. Parker B. C., Zhang W., Fusion genes in solid tumors: An emerging target for cancer diagnosis and treatment. Chin. J. Cancer 32, 594–603 (2013). - PMC - PubMed
    1. Kumar-Sinha C., Tomlins S. A., Chinnaiyan A. M., Recurrent gene fusions in prostate cancer. Nat. Rev. Cancer 8, 497–511 (2008). - PMC - PubMed

Publication types