. 2022 Feb 9;14(631):eabg8070.
doi: 10.1126/scitranslmed.abg8070. Epub 2022 Feb 9.

Targeting an alternate Wilms' tumor antigen 1 peptide bypasses immunoproteasome dependency

Affiliations

Targeting an alternate Wilms' tumor antigen 1 peptide bypasses immunoproteasome dependency

Miranda C Lahman et al. Sci Transl Med. .

Abstract

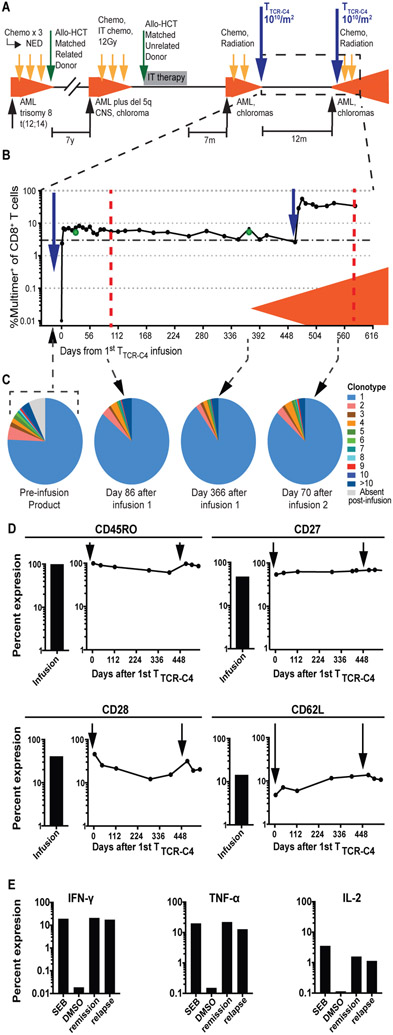
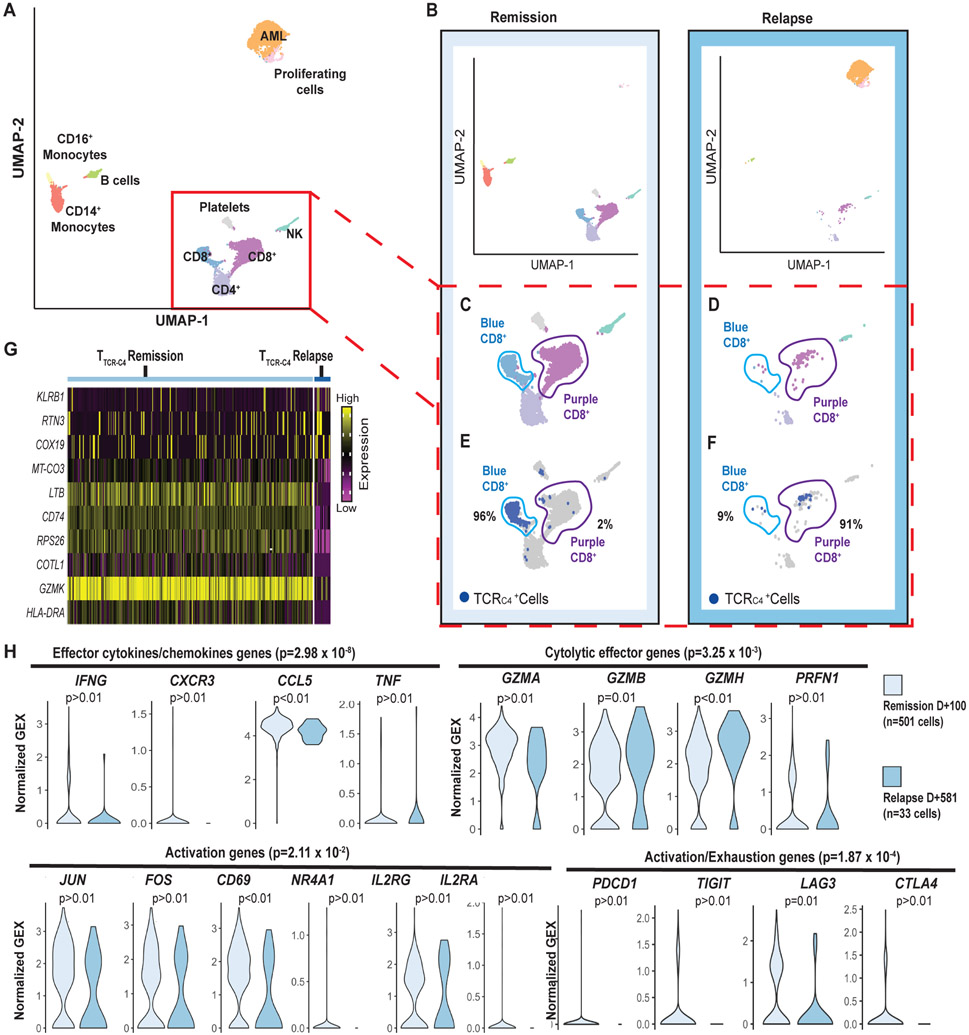
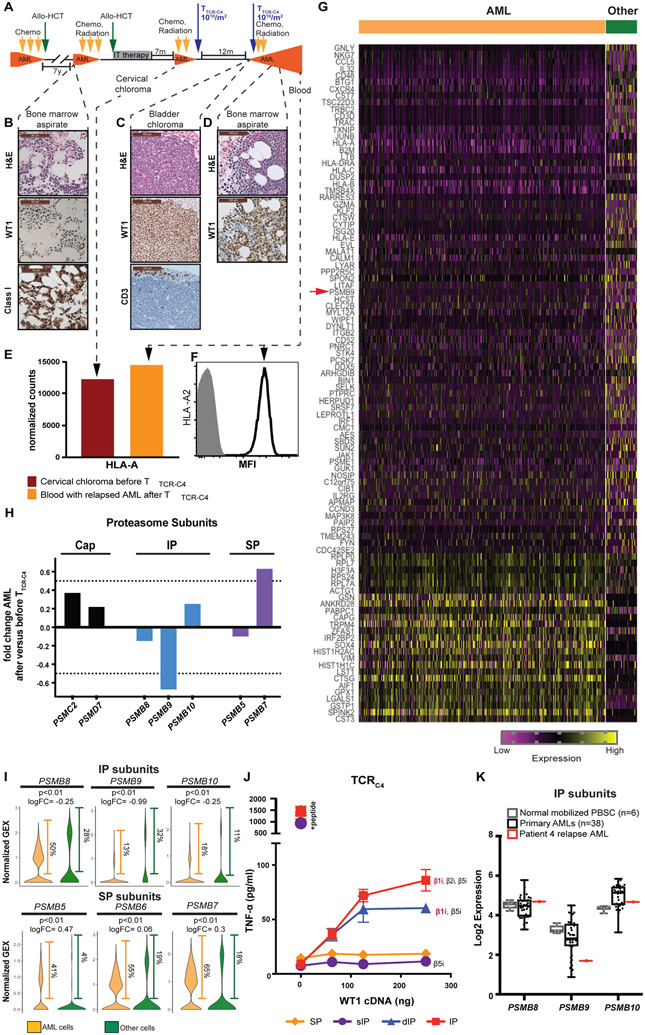
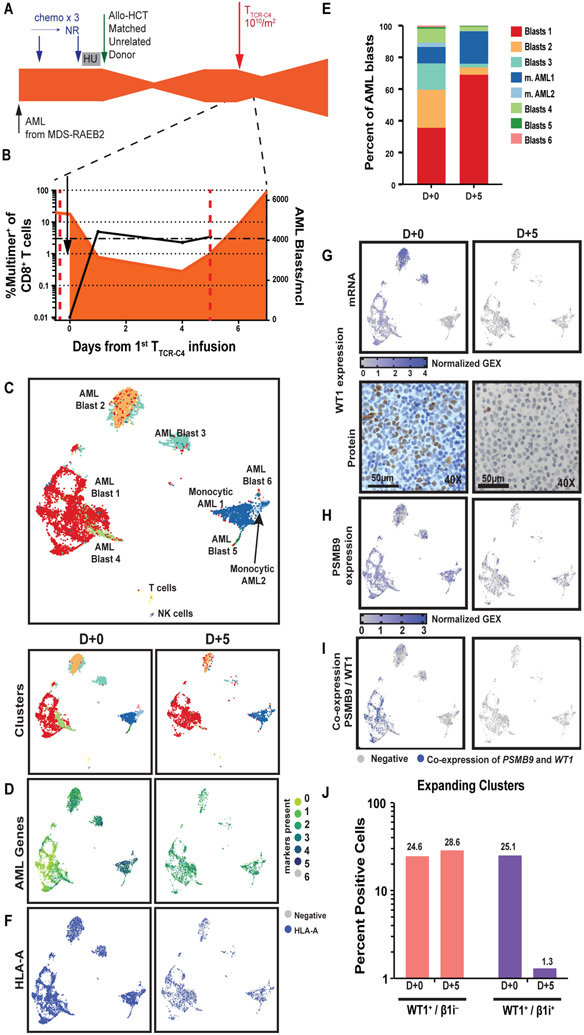
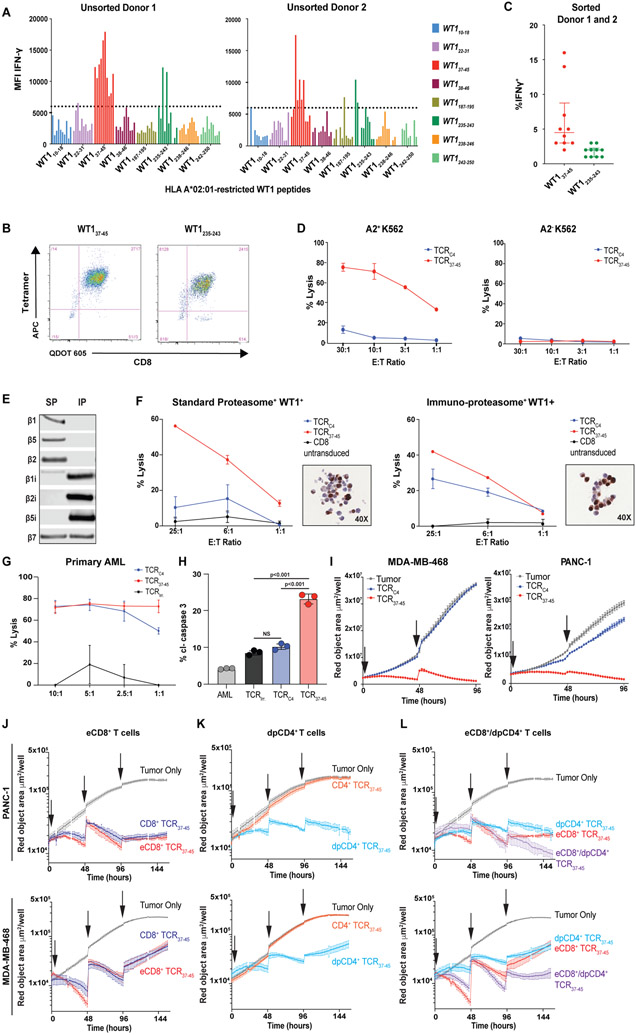
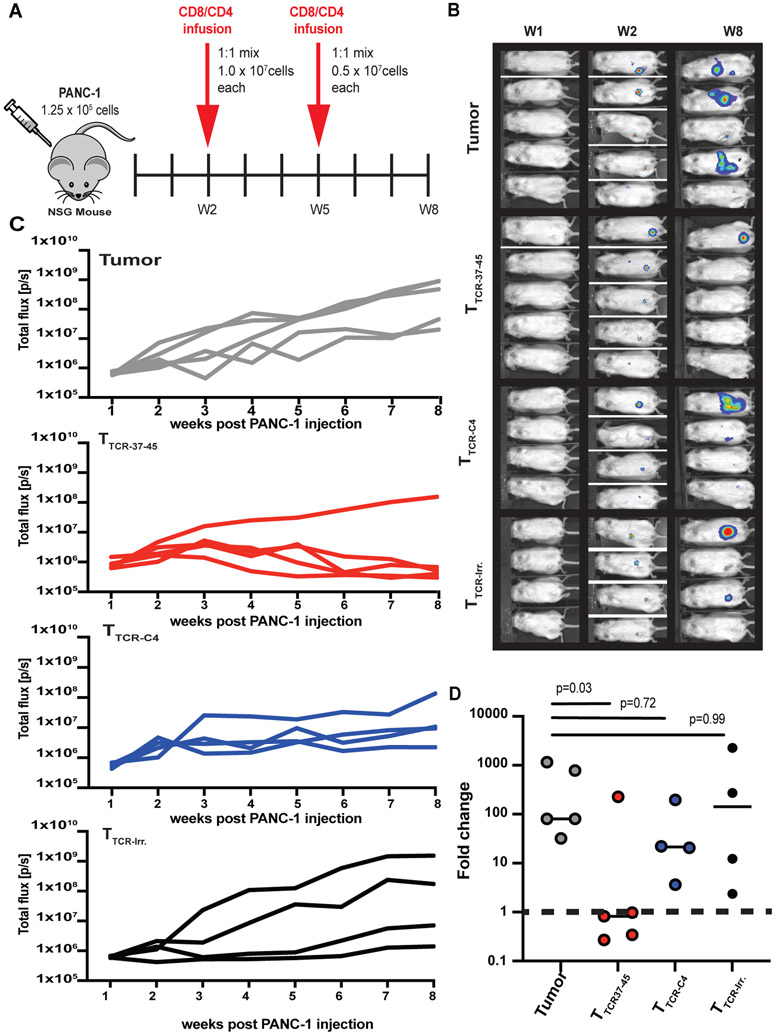
Designing effective antileukemic immunotherapy will require understanding mechanisms underlying tumor control or resistance. Here, we report a mechanism of escape from immunologic targeting in an acute myeloid leukemia (AML) patient, who relapsed 1 year after immunotherapy with engineered T cells expressing a human leukocyte antigen A*02 (HLA-A2)-restricted T cell receptor (TCR) specific for a Wilms' tumor antigen 1 epitope, WT1126-134 (TTCR-C4). Resistance occurred despite persistence of functional therapeutic T cells and continuous expression of WT1 and HLA-A2 by the patient's AML cells. Analysis of the recurrent AML revealed expression of the standard proteasome, but limited expression of the immunoproteasome, specifically the beta subunit 1i (β1i), which is required for presentation of WT1126-134. An analysis of a second patient treated with TTCR-C4 demonstrated specific loss of AML cells coexpressing β1i and WT1. To determine whether the WT1 protein continued to be processed and presented in the absence of immunoproteasome processing, we identified and tested a TCR targeting an alternative, HLA-A2-restricted WT137-45 epitope that was generated by immunoproteasome-deficient cells, including WT1-expressing solid tumor lines. T cells expressing this TCR (TTCR37-45) killed the first patients' relapsed AML resistant to WT1126-134 targeting, as well as other primary AML, in vitro. TTCR37-45 controlled solid tumor lines lacking immunoproteasome subunits both in vitro and in an NSG mouse model. As proteasome composition can vary in AML, defining and preferentially targeting these proteasome-independent epitopes may maximize therapeutic efficacy and potentially circumvent AML immune evasion by proteasome-related immunoediting.


Figures

Fig. 1:
Fig. 1:. TTCR-C4 persist and remain functional in the presence of relapsed AML.
(A) Timeline of patient’s treatment regimens. Chemo, chemotherapy; radiation, radiation therapy; IT, intrathecal; NED, no evidence of disease; CNS, central nervous system. (B) Percent multimer+ of CD8+ T cells in PBMCs (solid circles) and bone marrow (green circles) collected before and at defined timepoints after TTCR-C4 infusions are shown. The orange shaded area indicates presence of AML. Dotted red lines represent days 100 and 110 (or day 581 after the 1st) after 1st and 2nd infusion respectively. (C) Pie charts representing individual clonotypes composing the pre-infusion TTCR-C4 product (left) and at indicated timepoints (right) after both infusions are shown. (D) Percent expression of CD45RO, CD27, CD28 and CD62L on infusion products (bar graphs to the left) and at days 4, 42, 114, 289, 393, 478, 508 and 542 after the 1st infusion (graphs to the right) are shown. The three last timepoints are also days 7, 35 and 71 after the second infusion. Timing of infusions are indicated by black arrows. (E) Percent expression of IFN-γ, TNF-α and IL-2 (functional markers) in response to ex vivo stimulation WT1126-134 peptide (1nM) during remission (day 114 after 1st infusion) and relapse (day 581 after 1st infusion, day 110 after 2nd). Maximum and minimal cytokine expression following exposure to Staphylococcal enterotoxin B (SEB) and dimethylsufoxide (DMSO) are shown for each cytokine.
Fig. 2:
Fig. 2:. TTCR-C4 present an activated transcriptional profile during remission but not during relapse.
(A) UMAP visualization of PBMCs from both the remission (100 days after 1st infusion) and relapse (110 days after the second infusion or 581 days after the 1st) (red dotted lines Fig. 1A) samples are visualized together (see Supplementary Methods). PBMCs (n=7704) clustered into populations as indicated by labels. Clustering biostatistical analysis is described in Supplementary Methods and representative marker genes are shown in fig. S3. (B) UMAP visualization of the separated PBMCs obtained at remission (left) and relapse (right). (C) Close-ups are shown for clusters containing T cells during remission with identification of two (light blue and purple) distinct CD8+ T cell clusters based on their transcriptional programs. (D) Close-ups are shown for clusters containing T cells during relapse revealing the CD8+ T cells are predominantly in the purple cluster. (E) Localization of TTCR-C4 (dark blue dots) cells during remission is shown. (F) Localization of TTCR-C4 (dark blue dots) cells during relapse is shown. Percentage of the total TTCR-C4 cells in each cluster are indicated. (G) The heat map shows the 10 most differentially expressed genes (DEG) comparing TTCR-C4 during remission (n=501) to those during relapse (n=33). (H) Analysis of gene-sets representing effector cytokines, cytolytic effector genes activation, and exhaustion genes were compared in TTCR-C4 during remission (light blue) and relapse (darker blue), with each transcript in the gene-set shown as a violin plot. The shape of the violin displays frequencies of values. Model-based Analysis of Single Cell Transcriptomics (MAST) was used to determine the significance shown above each plot. Significance thresholds were set a priori at a threshold of false discovery rate of 5% and positive or negative fold change > log2(1.5).
Fig. 3:
Fig. 3:. Reduced immunoproteasome expression is observed in relapsed AML.
(A) The timeline shows occurrence of bone marrow aspirate, myeloid chloroma, or blood obtained relative to the timeline of successive therapies. Presence of AML is indicated in orange. (B) Pre-TTCR-C4 AML Hematoxylin and Eosin (H&E) (top panel), immunohistochemistry (IHC) of WT1 expression (middle panel) and HLA class I expression (bottom panel) is shown. Scale bars are 50 μm. (C) H&E (top panel), WT1 IHC expression (middle panel) and CD3 infiltration (bottom panel) is shown for bladder chloroma obtained early post-TTCR-C4 relapse. Scale bars are 100 μm. (D) Post-TTCR-C4 AML H&E (top panel) and WT1 IHC (bottom panel) are shown. Scale bars are 100 μm. (E) Normalized counts (y-axis) of bulk RNA expression of HLA-A obtained from the pre-TTCR-C4 cervical chloroma and a post-TTCR-C4 PBMC sample are shown, both containing greater than 89% AML. (F) HLA-A2 protein expression was detected by flow cytometry of the post-TTCR-C4 blood. MFI, median fluorescence intensity. (G) The heat map shows the top 100 significantly differentially expressed genes (DEG) (p <0.05 and logFC>∣log2(1.5)∣) comparing AML (n=2,447) during relapse after T cell therapy to other cells in the sample (n=306). The red arrow indicates immunoproteasome (IP) subunit β1i [PSBM9] (H) The plot shows the fold change (y axis) of transcripts encoding proteasome cap ([PSMC2] and [PSMD7]; black bars), IP (β5i [PSMB8], β1i [PSMB9] and β2i [PSMB10]; blue bars) and standard proteasome (SP) (β5 [PSMB5], and β2 [PSMB7]; purple bars) sub-units comparing expression in the post-TTCR-C4 obtained from PBMCs to pre-TTCR-C4 AML obtained from a chloroma FFPE sample. β1 [PSMB6] was not available in the commercial RNA probe-set utilized. Bold dotted line indicates 50% change over baseline. (I) Expression of transcripts encoding genes constituting the active proteolytic site of the IP (β5i [PSMB8], β1i [PSMB9] and β2i [PSMB10]) and the SP (β5 [PSMB5], β1 [PSMB6] and β2 [PSMB7]) are shown at relapse comparing AML (n=2,447, orange) and other non-malignant cells (n=306, green) in the sample. Frequencies of cells with the detectable transcript are shown to the right of each violin plot. P values are indicated as well as the log2 fold change. Positive values indicate increased and negative decreased expression in AML. MAST was used to determine significance shown above each plot. Significance thresholds were set a priori at a threshold of false discovery rate of 5% and positive or negative fold change > log2(1.5)). (J) TNF-α production (pg/mL) was measured from T cells expressing TCRC4 cultured with cells expressing a specific proteasome isoform and transfected with varying amounts of WT1 cDNA (29) or pulsed with WT1126-134 peptide as a positive control. Data are presented as mean ± standard deviation. (K) RNAseq on viable leukemic blasts shows expression of genes constituting the active proteolytic site of the IP (β5i [PSMB8], β1i [PSMB9] and β2i [PSMB10]) in peripheral blood stem cells obtained from healthy donors (n=6, light gray), primary AML samples obtained from the Fred Hutch-University of Washington Hematopoietic Diseases Repository (black, n=38) and the patient (red, n=1). Box and whisker plot represents median, interquartile and range. Dots represent individual patient samples.
Fig. 4:
Fig. 4:. TTCR-C4 preferentially eliminates WT1+ AML co-expressing β1i.
(A) Timeline of patient’s treatment regimens. Chemo, chemotherapy; NR, no response; HU, hydroxyurea. (B) Percent multimer+ of CD8+ T cells is shown in peripheral blood collected before and at day +1, +4, and +5. The orange shaded area indicates presence of AML. Dotted red lines represent days +0 and +5 after TTCR-C4. (C) UMAP visualization is shown for scRNAseq on PBMCs from both before (D+0, n=7,381) TTCR-C4 infusion and 5 days post 1st infusion (D+5, n=3,319) (red dotted lines shown in Fig. 4B) aggregated into a single UMAP (top) or as individual time points (bottom, D+0 left and D+5 right). (D to I) UMAP of AML clusters on D+0 (left) or D+5 (right) are shown. (D) Expression of AML specific markers CD34, CCND1, CDK6, FLT3, NPM1, RUNX1 are shown. (E) Relative proportions of AML clusters at D+0 and D+5 are shown. (F) Expression of the gene encoding HLA-A is shown. (G) Expression of WT1 transcripts from peripheral AML (top panel) and immunohistochemistry (bottom panel) of WT1 protein performed on a bone marrow biopsy (D+0) and a PBMC cell pellet (D+5) are shown. (H) Expression of immunoproteasome gene β1i (PSMB9) is shown. (I) Co-expression of WT1 and PSMB9 is shown. (J) The bar graph shows the percent of cells that express WT1 only (pink bars) or WT1 and β1i ([PSMB9]) (purple bars) before (D+0) and after (D+5) TTCR-C4 infusion. Percent values are indicated above each column.
Fig. 5:
Fig. 5:. Identification of an alternate HLA-A*02:01-restricted WT1 peptide (WT137-45 ) which is not dependent on immunoproteasome processing.
(A) Ten CD8+ T cell lines from 2 HLA-A*02:01-expressing healthy donors were generated against 8 candidate HLA-A*02:01-binding WT1 peptides (x-axis). Each cell line’s ability to produce IFN-γ following stimulation with the immunoproteasome-deficient but WT1+ HLA-A*02:01-transduced K562 cell line at an E:T of 1:1 was assessed. Peptides were considered to have elicited high reactivity from donor T cells as measured by MFI (above the arbitrary threshold of 6000) for the IFN-γ positive cells. (B) Representative flow plots show CD8+ T cell lines targeting WT137-45 or WT1235-243 that were sorted using the corresponding tetramers. (C) Sorted T cell lines targeting WT137-45 had the highest comparative reactivity, assessed by IFN-γ MFI, when cultured with HLA A*02:01-tansduced K562 cells. TCRs targeting WT137-45 were isolated from T cells in these lines. Data are presented as median with the interquartile range. All data points are shown. (D) Lysis of K562 ± expression of HLA-A*02:01 by CD8+ T cells from a healthy donor transduced with TCRC4 or a TCR targeting WT137-45 (TCRWT1-37-45 #1) confirmed that expression of the WT137-45 peptide was not dependent on IP processing. Error bars show standard deviation of triplicate wells. (E) The immunoblot shows protein expression of catalytic proteasome subunits in HEK-293 (endogenous SP expression) ± engineering to express the IP. (F) Percent lysis (y-axis) is shown for IP/SP-skewed HEK-293 cells lines by CD8+ T cells transduced to express either TCRC4 (blue lines), TCR37-45 (red lines) and untransduced CD8+ T cells (black lines) at indicated effector to target (E:T) ratios (x-axis). Inset depicts WT1 IHC of IP/SP HEK-293 cells transduced with WT1-and HLA-A*02:01. IP/SP cell lines demonstrate heterogeneity of WT1 expression. Error bars show standard deviation of triplicate wells. (G) Percent lysis (y-axis) of a primary leukemia by CD8+ T cells transduced to express either an irrelevant TCR (TCRirr.; black lines), TCRC4 (blue lines) or TCR37-45 (red lines) is shown. (H) Percent AML cells expressing cleaved caspase 3 (cl-caspase 3, y-axis) is shown for Patient 1’s relapsed AML either alone (gray) or cultured with CD8+ T cells with the endogenous TCR removed using CRISPR-Cas9 and transduced to express TCRirr. (black), TCRC4 (blue), or TCR37-45 (red). Error bars show standard deviation of triplicate wells. (I) Growth kinetics are shown for WT1+ cell lines PANC-1 and HLA-A*02:01-transduced MDA-MD-468 in live tumor-visualization assay in the absence (gray lines), or presence of CD8+ T cells transduced to express either TCRC4 (blue lines) or TCR37-45 (red lines). Effector to target (E:T) ratio of 10:1 was used and arrows indicate addition of tumor cells to culture. Standard error of triplicate wells are shown. (J to L) Growth kinetics are shown for WT1+ cell lines PANC-1 and HLA-A*02:01-transduced MDA-MB-468 in live tumor-visualization assay in the absence (gray lines), or presence of TTCR37-45 cells. (J) CD8+ T cells were transduced with only TCR37-45 (light-blue line) or a poly-cistronic construct containing TCR37-45 and CD8αβ (red line, eCD8+). (K) CD4+ T cells were transduced with only TCR37-45 (blue line) or a poly-cistronic construct containing TCR37-45 and CD8αβ (green line, dpCD4+). (L) A comparison of eCD8+ alone (red line), dpCD4+ alone (green line) or eCD8+/dpCD4+ in combination (1:1 ratio, purple line) is shown. For all conditions, arrows indicate addition of tumor cells to culture. Standard error of triplicate wells are shown. 4:1 E:T ratio, total T cells was kept consistent for all conditions.
Fig 6:
Fig 6:. TTCR37-45 cells reduce PANC-1 solid tumor burden in an NSG mouse model.
(A) Schematic for NSG experimental treatment model. (N=2) Data from one of two biological replicates is shown. (B) Bioluminescence images of mice are shown at weeks 1, 2, and 8 post PANC-1leu injection. All mice had detectable tumors at the time of adoptive transfer. (C) Total flux (p/s) for each treatment group was measured over time: Tumor (No T cells, n=5); TTCR37-45 (n=5); TTCR-C4 (n=4) TTCR-Irr. (n=4). (D) Fold change relative to baseline (Week 1) at week 8 is shown for each treatment group. Data in (D) were analyzed by a Kruskal-Wallis test for non-parametric data. n.s., not significant. Horizontal bars indicate the mean.

Similar articles

Cited by

References

    1. Dickinson AM, Norden J, Li S, Hromadnikova I, Schmid C, Schmetzer H, Jochem-Kolb H, Graft-versus-Leukemia Effect Following Hematopoietic Stem Cell Transplantation for Leukemia. Front Immunol 8, 496 (2017). - PMC - PubMed
    1. Lim F, Ang SO, Emerging CAR landscape for cancer immunotherapy. Biochem Pharmacol 178, 114051 (2020). - PubMed
    1. Perna F, Berman SH, Soni RK, Mansilla-Soto J, Eyquem J, Hamieh M, Hendrickson RC, Brennan CW, Sadelain M, Integrating Proteomics and Transcriptomics for Systematic Combinatorial Chimeric Antigen Receptor Therapy of AML. Cancer Cell 32, 506–519 e505 (2017). - PMC - PubMed
    1. Stone JD, Kranz DM, Role of T cell receptor affinity in the efficacy and specificity of adoptive T cell therapies. Frontiers in immunology 4, 244 (2013). - PMC - PubMed
    1. Sugiyama H, WT1 (Wilms' tumor gene 1): biology and cancer immunotherapy. Jpn J Clin Oncol 40, 377–387 (2010). - PubMed

Publication types