

Prevalence and Correlates of Phenazine Resistance in Culturable Bacteria from a Dryland Wheat Field
- PMID: 35138927
- PMCID: PMC8939311
- DOI: 10.1128/aem.02320-21
Prevalence and Correlates of Phenazine Resistance in Culturable Bacteria from a Dryland Wheat Field
Abstract
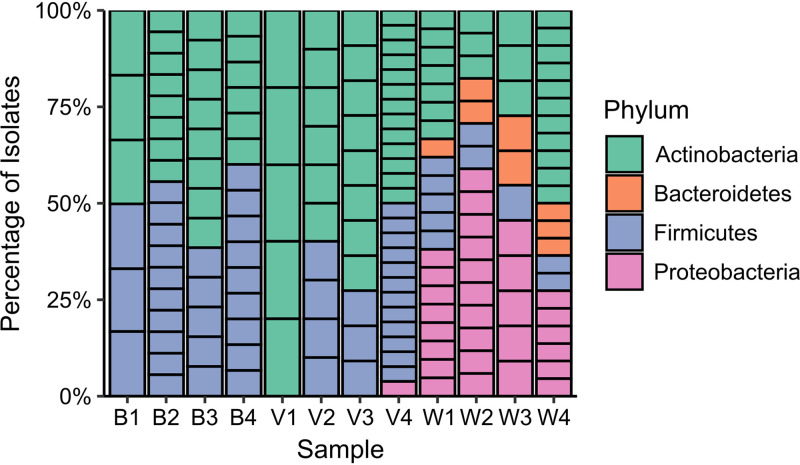
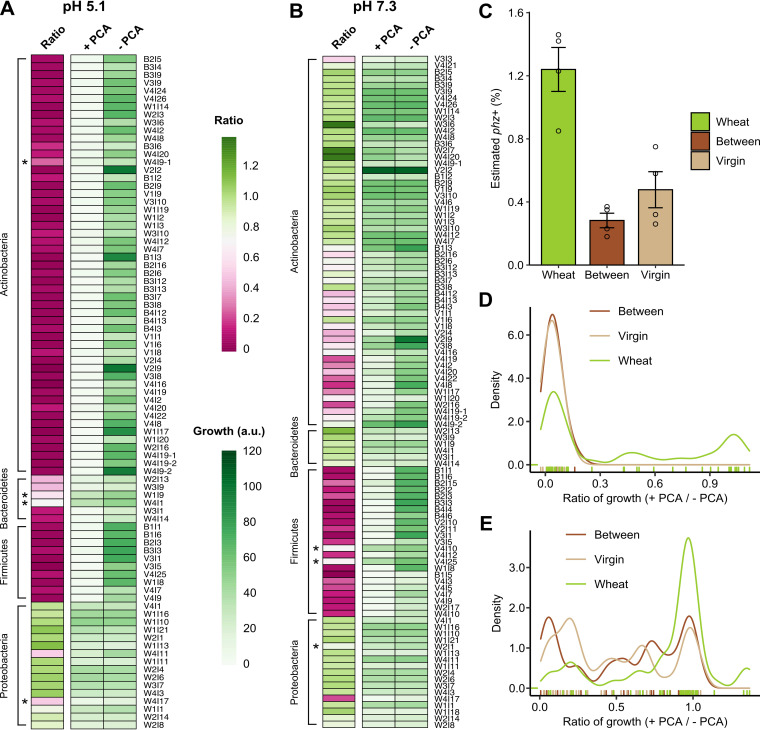
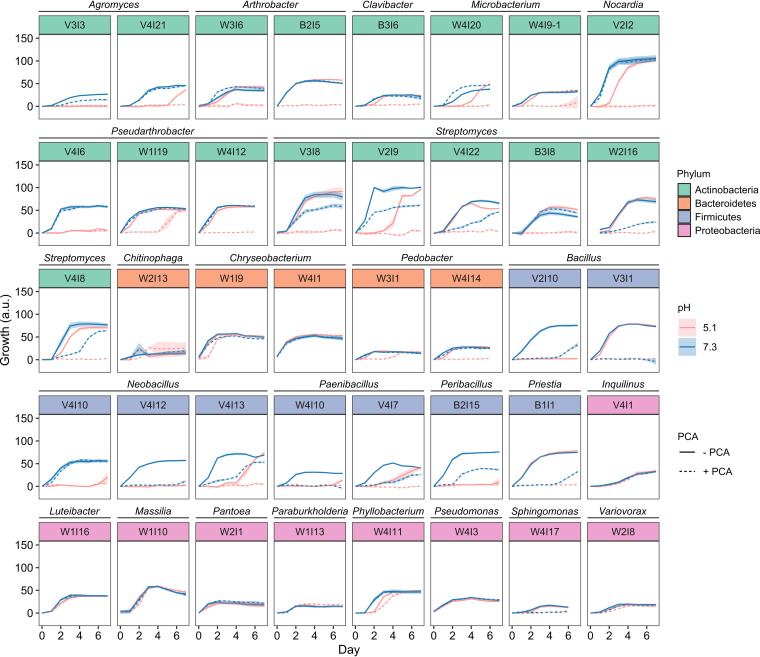
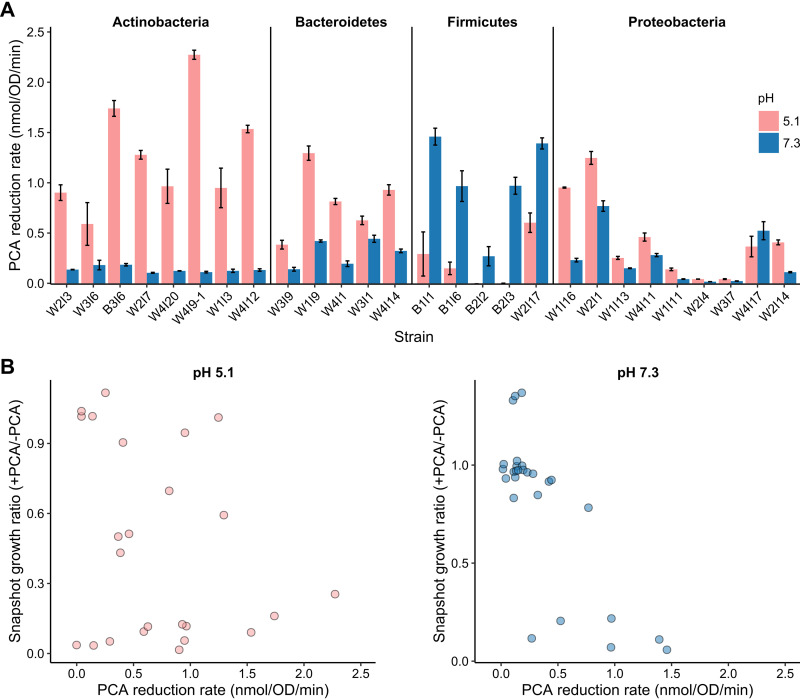
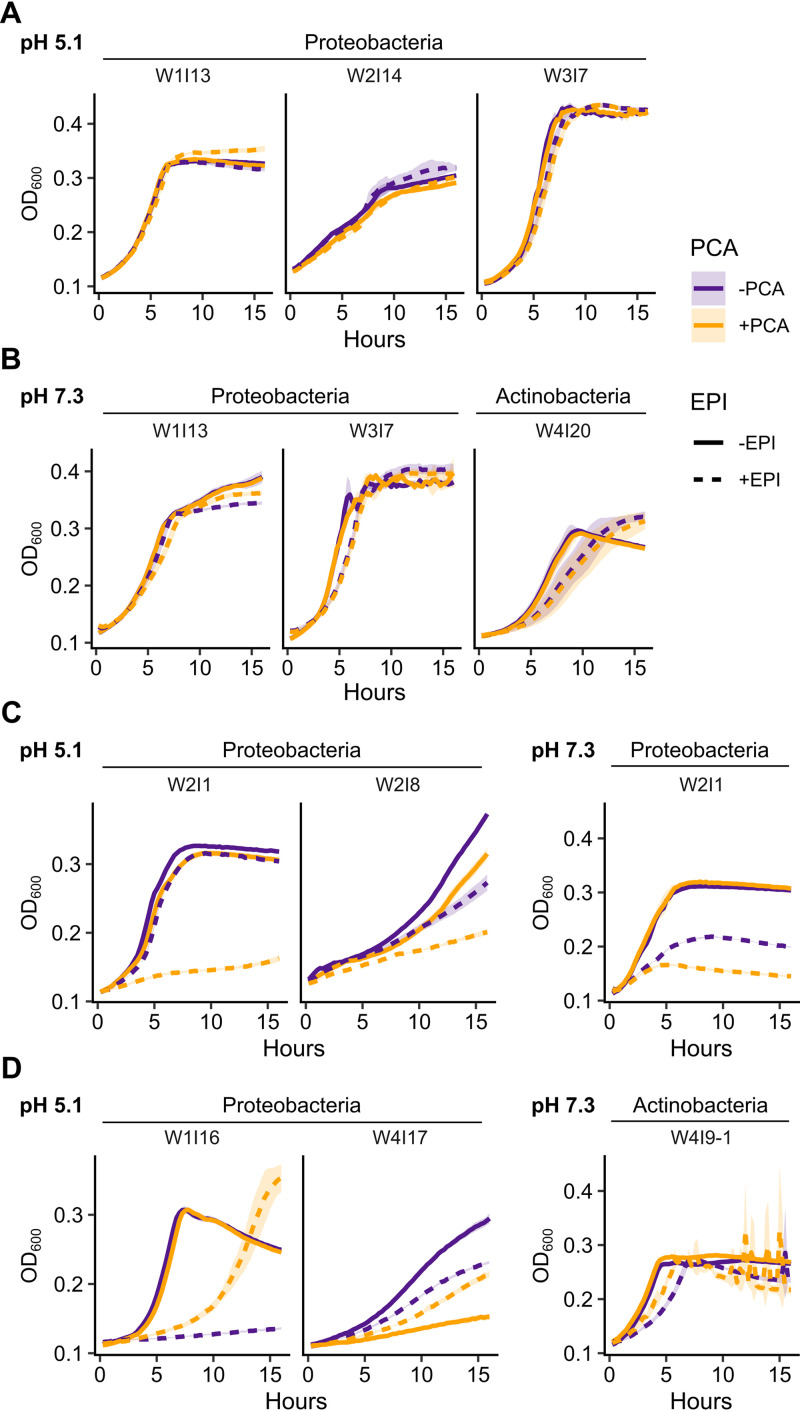
Phenazines are a class of bacterially produced redox-active natural antibiotics that have demonstrated potential as a sustainable alternative to traditional pesticides for the biocontrol of fungal crop diseases. However, the prevalence of bacterial resistance to agriculturally relevant phenazines is poorly understood, limiting both the understanding of how these molecules might shape rhizosphere bacterial communities and the ability to perform a risk assessment for off-target effects. Here, we describe profiles of susceptibility to the antifungal agent phenazine-1-carboxylic acid (PCA) across more than 100 bacterial strains isolated from a wheat field where PCA producers are indigenous and abundant. We found that Gram-positive bacteria are typically more sensitive to PCA than Gram-negative bacteria, and there was significant variability in susceptibility both within and across phyla. Phenazine-resistant strains were more likely to be isolated from the wheat rhizosphere, where PCA producers were also more abundant, compared to bulk soil. Furthermore, PCA toxicity was pH-dependent for most susceptible strains and broadly correlated with PCA reduction rates, suggesting that uptake and redox-cycling were important determinants of phenazine toxicity. Our results shed light on which classes of bacteria are most likely to be susceptible to phenazine toxicity in acidic or neutral soils. In addition, the taxonomic and phenotypic diversity of our strain collection represents a valuable resource for future studies on the role of natural antibiotics in shaping wheat rhizosphere communities. IMPORTANCE Microbial communities contribute to crop health in important ways. For example, phenazine metabolites are a class of redox-active molecules made by diverse soil bacteria that underpin the biocontrol of diseases of wheat and other crops. Their physiological functions are nuanced. In some contexts, they are toxic. In others, they are beneficial. While much is known about phenazine production and the effect of phenazines on producing strains, our ability to predict how phenazines might shape the composition of environmental microbial communities is poorly constrained. In addition, phenazine prevalence in the rhizosphere has been predicted to increase in arid soils as the climate changes, providing an impetus for further study. As a step toward gaining a predictive understanding of phenazine-linked microbial ecology, we document the effects of phenazines on diverse bacteria that were coisolated from a wheat rhizosphere and identify conditions and phenotypes that correlate with how a strain will respond to phenazines.
Keywords: correlates; dryland wheat; efflux pumps; phenazines; resistance; rhizosphere; toxicity.
Conflict of interest statement
The authors declare no conflict of interest.
Figures
Similar articles
-
Enzymatic Degradation of Phenazines Can Generate Energy and Protect Sensitive Organisms from Toxicity.mBio. 2015 Oct 27;6(6):e01520-15. doi: 10.1128/mBio.01520-15. mBio. 2015. PMID: 26507234 Free PMC article.
-
Nitrate Reduction Stimulates and Is Stimulated by Phenazine-1-Carboxylic Acid Oxidation by Citrobacter portucalensis MBL.mBio. 2021 Aug 31;12(4):e0226521. doi: 10.1128/mBio.02265-21. Epub 2021 Aug 31. mBio. 2021. PMID: 34465028 Free PMC article.
-
Effects of Pseudomonas putida modified to produce phenazine-1-carboxylic acid and 2,4-diacetylphloroglucinol on the microflora of field grown wheat.Antonie Van Leeuwenhoek. 2002 Aug;81(1-4):617-24. doi: 10.1023/a:1020526126283. Antonie Van Leeuwenhoek. 2002. PMID: 12448757
-
Phenazines in plant-beneficial Pseudomonas spp.: biosynthesis, regulation, function and genomics.Environ Microbiol. 2018 Nov;20(11):3905-3917. doi: 10.1111/1462-2920.14395. Epub 2018 Oct 15. Environ Microbiol. 2018. PMID: 30159978 Review.
-
Phenazines and their role in biocontrol by Pseudomonas bacteria.New Phytol. 2003 Mar;157(3):503-523. doi: 10.1046/j.1469-8137.2003.00686.x. New Phytol. 2003. PMID: 33873412 Review.
Cited by
-
The chemical ecology of coumarins and phenazines affects iron acquisition by pseudomonads.Proc Natl Acad Sci U S A. 2023 Apr 4;120(14):e2217951120. doi: 10.1073/pnas.2217951120. Epub 2023 Mar 30. Proc Natl Acad Sci U S A. 2023. PMID: 36996105 Free PMC article.
-
Genetic Circuit Design in Rhizobacteria.Biodes Res. 2022 Sep 1;2022:9858049. doi: 10.34133/2022/9858049. eCollection 2022. Biodes Res. 2022. PMID: 37850138 Free PMC article. Review.
-
The phospho-ferrozine assay: a tool to study bacterial redox-active metabolites produced at the plant root.Appl Environ Microbiol. 2025 Jan 31;91(1):e0219424. doi: 10.1128/aem.02194-24. Epub 2024 Dec 17. Appl Environ Microbiol. 2025. PMID: 39688434 Free PMC article.
-
Neobacillus driksii sp. nov. isolated from a Mars 2020 spacecraft assembly facility and genomic potential for lasso peptide production in Neobacillus.Microbiol Spectr. 2025 Jan 7;13(1):e0137624. doi: 10.1128/spectrum.01376-24. Epub 2024 Nov 29. Microbiol Spectr. 2025. PMID: 39611829 Free PMC article.
-
Evaluation of Resistance Induction Promoted by Bioactive Compounds of Pseudomonas aeruginosa LV Strain against Asian Soybean Rust.Microorganisms. 2024 Aug 2;12(8):1576. doi: 10.3390/microorganisms12081576. Microorganisms. 2024. PMID: 39203418 Free PMC article.
References
Publication types
MeSH terms
Substances
Grants and funding
LinkOut - more resources
Full Text Sources
Molecular Biology Databases
Research Materials
