

Ultrasound-based radiomics nomogram for differentiation of triple-negative breast cancer from fibroadenoma
- PMID: 35138938
- PMCID: PMC10993963
- DOI: 10.1259/bjr.20210598
Ultrasound-based radiomics nomogram for differentiation of triple-negative breast cancer from fibroadenoma
Abstract
Objective: This study aimed to develop a radiomics nomogram that incorporates radiomics, conventional ultrasound (US) and clinical features in order to differentiate triple-negative breast cancer (TNBC) from fibroadenoma.
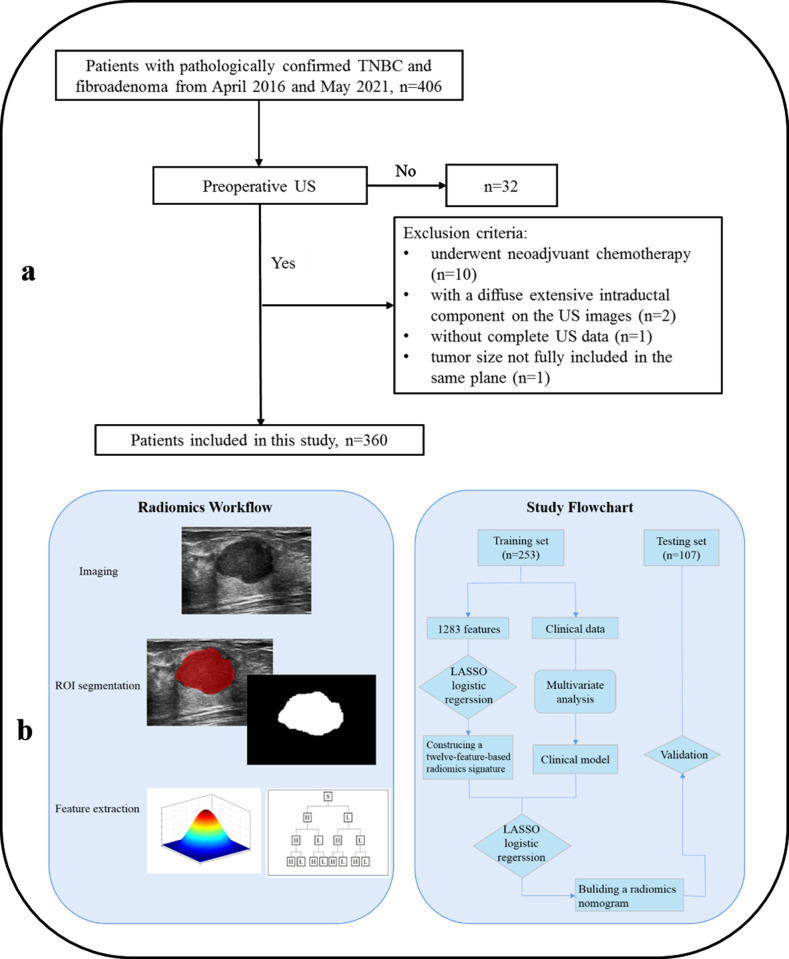
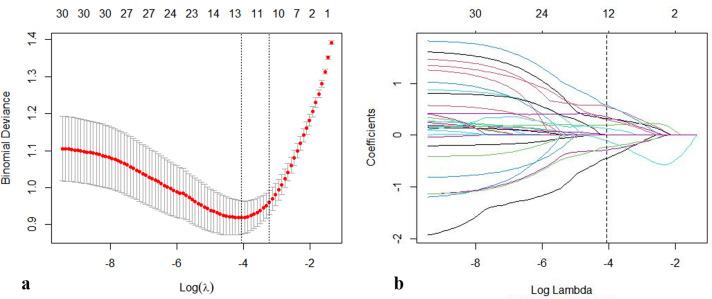
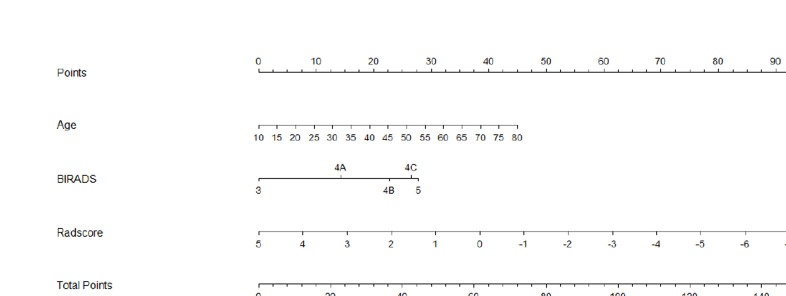
Methods: A total of 182 pathology-proven fibroadenomas and 178 pathology-proven TNBCs, which underwent preoperative US examination, were involved and randomly divided into training (n = 253) and validation cohorts (n = 107). The radiomics features were extracted from the regions of interest of all lesions, which were delineated on the basis of preoperative US examination. The least absolute shrinkage and selection operator model and the maximum relevance minimum redundancy algorithm were established for the selection of tumor status-related features and construction of radiomics signature (Rad-score). Then, multivariate logistic regression analyses were utilized to develop a radiomics model by incorporating the radiomics signature and clinical findings. Finally, the usefulness of the combined nomogram was assessed by using the receiver operator characteristic curve, calibration curve, and decision curve analysis (DCA).
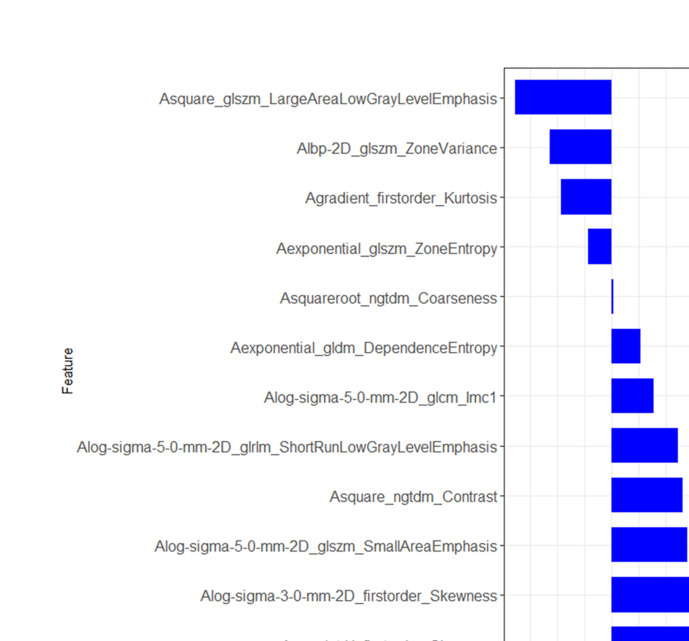
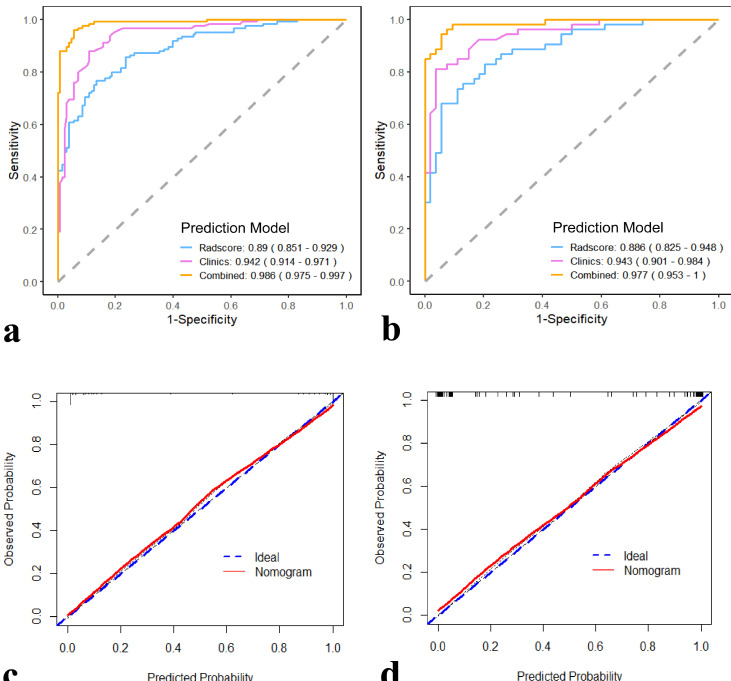
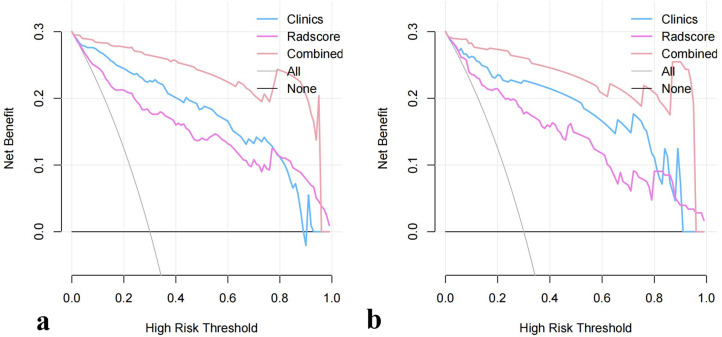
Results: The radiomics signature, composed of 12 selected features, achieved good diagnostic performance. The nomogram incorporated with radiomics signature and clinical data showed favorable diagnostic efficacy in the training cohort (AUC 0.986, 95% CI, 0.975-0.997) and validation cohort (AUC 0.977, 95% CI, 0.953-1.000). The radiomics nomogram outperformed the Rad-score and clinical models (p < 0.05). The calibration curve and DCA demonstrated the good clinical utility of the combined radiomics nomogram.
Conclusion: The radiomics signature is a potential predictive indicator for differentiating TNBC and fibroadenoma. The radiomics nomogram associated with Rad-score, US conventional features, and clinical data outperformed the Rad-score and clinical models.
Advances in knowledge: Recent advances in radiomics-based US are increasingly showing potential for improved diagnosis, assessment of therapeutic response and disease prediction in oncology. Rad-score is an independent predictive indicator for differentiating TNBC and fibroadenoma. The radiomics nomogram associated with Rad-score, US conventional features, and clinical data outperformed the Rad-score and clinical models.
Figures
Similar articles
-
Radiomics features on ultrasound imaging for the prediction of disease-free survival in triple negative breast cancer: a multi-institutional study.Br J Radiol. 2021 Oct 1;94(1126):20210188. doi: 10.1259/bjr.20210188. Epub 2021 Sep 3. Br J Radiol. 2021. PMID: 34478336 Free PMC article.
-
A Nomogram Based on Radiomics with Mammography Texture Analysis for the Prognostic Prediction in Patients with Triple-Negative Breast Cancer.Contrast Media Mol Imaging. 2020 Aug 25;2020:5418364. doi: 10.1155/2020/5418364. eCollection 2020. Contrast Media Mol Imaging. 2020. PMID: 32922222 Free PMC article.
-
Nomogram Based on Shear-Wave Elastography Radiomics Can Improve Preoperative Cervical Lymph Node Staging for Papillary Thyroid Carcinoma.Thyroid. 2020 Jun;30(6):885-897. doi: 10.1089/thy.2019.0780. Epub 2020 Mar 11. Thyroid. 2020. PMID: 32027225
-
Improving Prediction Accuracy of Residual Axillary Lymph Node Metastases in Node-Positive Triple-Negative Breast Cancer: A Radiomics Analysis of Ultrasound-Guided Clip Locations Using the SHAP Method.Acad Radiol. 2025 Apr;32(4):1827-1837. doi: 10.1016/j.acra.2024.10.039. Epub 2024 Nov 9. Acad Radiol. 2025. PMID: 39523140
-
Ultrasound radiomics-based nomogram to predict lymphovascular invasion in invasive breast cancer: a multicenter, retrospective study.Eur Radiol. 2024 Jan;34(1):136-148. doi: 10.1007/s00330-023-09995-1. Epub 2023 Jul 31. Eur Radiol. 2024. PMID: 37518678
Cited by
-
Nomograms predicting recurrence in patients with triple negative breast cancer based on ultrasound and clinicopathological features.Br J Radiol. 2022 Sep 1;95(1138):20220305. doi: 10.1259/bjr.20220305. Epub 2022 Aug 2. Br J Radiol. 2022. PMID: 35819909 Free PMC article.
-
Ultrasound-based comparative analysis and nomogram development for predicting triple-negative and non-triple-negative breast cancer: a 4-year institutional study in Quanzhou First Hospital.BMJ Open. 2024 Jun 13;14(6):e085340. doi: 10.1136/bmjopen-2024-085340. BMJ Open. 2024. PMID: 38871659 Free PMC article.
-
Imaging of fibroadenoma: Be careful with imaging follow-up.World J Clin Cases. 2022 Sep 6;10(25):9176-9179. doi: 10.12998/wjcc.v10.i25.9176. World J Clin Cases. 2022. PMID: 36157665 Free PMC article.
-
Expansive Receptive Field and Local Feature Extraction Network: Advancing Multiscale Feature Fusion for Breast Fibroadenoma Segmentation in Sonography.J Imaging Inform Med. 2024 Dec;37(6):2810-2824. doi: 10.1007/s10278-024-01142-6. Epub 2024 May 31. J Imaging Inform Med. 2024. PMID: 38822159 Free PMC article.
-
TMAN: A Triple Morphological Feature Attention Network for Fine-Grained Classification of Breast Ultrasound Images.J Imaging Inform Med. 2025 Apr 8. doi: 10.1007/s10278-025-01496-5. Online ahead of print. J Imaging Inform Med. 2025. PMID: 40199832
