. 2022 Feb 9;221(4):e202107135.
doi: 10.1083/jcb.202107135. Epub 2022 Feb 9.

Assessing Gq-GPCR-induced human astrocyte reactivity using bioengineered neural organoids

Affiliations

Assessing Gq-GPCR-induced human astrocyte reactivity using bioengineered neural organoids

Caroline Cvetkovic et al. J Cell Biol. .

Abstract

Astrocyte reactivity can directly modulate nervous system function and immune responses during disease and injury. However, the consequence of human astrocyte reactivity in response to specific contexts and within neural networks is obscure. Here, we devised a straightforward bioengineered neural organoid culture approach entailing transcription factor-driven direct differentiation of neurons and astrocytes from human pluripotent stem cells combined with genetically encoded tools for dual cell-selective activation. This strategy revealed that Gq-GPCR activation via chemogenetics in astrocytes promotes a rise in intracellular calcium followed by induction of immediate early genes and thrombospondin 1. However, astrocytes also undergo NF-κB nuclear translocation and secretion of inflammatory proteins, correlating with a decreased evoked firing rate of cocultured optogenetic neurons in suboptimal conditions, without overt neurotoxicity. Altogether, this study clarifies the intrinsic reactivity of human astrocytes in response to targeting GPCRs and delivers a bioengineered approach for organoid-based disease modeling and preclinical drug testing.


Figures

None
Graphical abstract
Figure 1.
Figure 1.
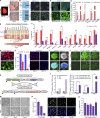
Genetic engineering enables rapid production of inducible human astrocytes. (A) TALEN targeting of inducible Sox9 and NFIA to generate inducible iAstro line. (B) Differentiation timeline of inducible astrocytes (iAstros, red) and neural progenitor cells (NPCs, blue) from hPSCs. S/D/X, SB431542/DMH-1/XAV939. (C) RNAseq selection criteria of Padj ≤ 0.05 from 15,150 total genes with FPKM > 1 yielded 1,766 DEGs (left). A subset of mature astrocyte-related transcripts upregulated (red) in day-12 iAstros compared with NPCs (n = 3 each) is highlighted in a volcano plot inset (right) of log2FoldChange versus −log10(Padj). (D) iAstro ICC in the presence of dox versus control NPCs (left). Day-12 iAstros exhibited mature astrocyte markers, including S100 and filamentous GFAP (n = 5 images each; top right). Expression of GFAP continued past 7 wk of culture (bottom right). (E) Semiquantitative proteomic analysis identified a total of 2,556 proteins from iAstros and NPCs (left). A subset of astrocyte-related proteins secreted from day-12 iAstros (restricted to those differentially upregulated in RNAseq) is shown as log10(iFOT × 105) (top) and log2FoldChange (bottom) compared with those from NPCs (n = 3 each). (F) Representative calcium traces (presented as a fraction of peak intensity; top) and average frequency of oscillations (bottom) of NPCs and iAstros (n = 16–49 cells or ROIs from 4 to 5 videos per group). 100 µM ATP was added to maximally simulate and synchronize cellular calcium levels (see Video 1). (G) Intracellular calcium levels in iAstros and hM3Dq-positive chemogenetic Astrostim cells in response to 10 µM CNO treatment (see Video 2). Data are presented as ratios of fluorescence intensity (F) to baseline intensity (n = 10 cells or ROIs from each of four videos per group; bold lines and bar plots indicate averages). All scale bars: 100 µm. Results are shown as mean ± SEM. For E, significance was determined using a two-tailed unpaired t test, with *, P ≤ 0.05; ***, P ≤ 0.001; ****, P ≤ 0.0001 (see asterisks overlaid on heatmap). Source data are available for this figure: SourceData F1.
Figure S1.
Figure S1.
Characterization of inducible astrocytes. (A) Control NPCs (−Dox) and iAstros (+Dox) 6 d after induction from transgenic hPSCs, with the mApple reporter, before cell line purification. Dox treatment induced cell migration and morphological changes. (B) Western immunoblotting confirmed upregulation of Sox9 and NFIA proteins after 2 d of initial transgene induction (dox treatment) compared with the control (left). ICC confirmed expression of Sox9 and NFIA proteins after 4 d (right) in a mixed population. (C) GFAP was evident after 8 d in the presence of, but not without, dox treatment. Expression increased with 2-d treatment of ciliary neurotrophic factor (CNTF), known to stimulate astrocyte GFAP production. (D) Confirmation of transgene induction and astrocyte-restricted gene expression by qPCR in day-8 iAstros, normalized to NPCs and compared to temporally derived human astrocytes (hAstros; n = 1 each). (E) Subset of upregulated mature astrocyte-related transcripts are shown in heatmaps as log2(FPKM+1) (top) and log2FoldChange (bottom) of day-12 iAstros compared to NPCs (n = 3 each). (F) Subset of astrocyte-related transcripts plotted as log2(FPKM+1) for iAstros and NPCs (n = 3 each). (G) Mature iAstros exhibited astrocyte markers including S100 (top) and filamentous GFAP (bottom). Images are replicated from Fig. 1 D with increased magnification of astrocyte morphology. (H) Ki67 expression indicated decreased proliferation with maturation of day-12 iAstros, compared with highly proliferative NPCs (n = 6 images each). (I) GFAP and S100 continued to be highly expressed in day-50+ iAstro spheres. (J) Representative still frames of ATP-induced calcium oscillation in iAstros and NPCs (see Fig. 1 F). (K) Targeting scheme used to generate hM3Dq-expressing iAstros (Astrostim). (L) Confirmation of transgene induction and astrocyte-restricted gene expression by qPCR in Astrostim cells after 2 d of dox treatment, normalized to day-2 no-dox controls (left) and after 15 and 30 d of dox treatment, normalized to day 15 no-dox controls (right; n = 3 each). (M) Live images of Astrostim cells with (bottom) and without (top) CNO treatment, after 1 d (left), 2 d (middle), and 4 d (right). (N) Ki67 expression indicated decreased proliferation with Astrostim cell maturation over a period of 4 wk (n = 8–9 images each). (O) Chronic CNO stimulation up to 14 d did not significantly alter the number of metabolically active Astrostim cells in monolayer culture compared to 2-h CNO treatment, as measured by monolayer viability assay (n = 3 each). Scale bars:I, 20 µm;A right, 500 µm; all others, 100 µm. Results are shown as mean ± SEM where appropriate. For E and F, significance was determined using the DESeq2 R package (see asterisks overlaid on heatmap). For L, significance was determined using a one-way ANOVA followed by Tukey’s multiple comparison test, with **, P ≤ 0.01; ***, P ≤ 0.001; ****, P ≤ 0.0001.
Figure 2.
Figure 2.
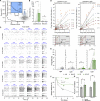
Validation of neuronal sphere cultures as a readout for health and activity. (A) iNeurons expressing a genetically encoded calcium indicator (GCaMP6) were cocultured with Astrostim (10:1) for 9 d. After subsequent chronic CNO treatment (12–14 d), calcium imaging was performed to measure spontaneous oscillations. Scale bar: 50 µm; inset: 10 µm. (B) Representative calcium trace of a control (non–CNO treated) coculture (top), presented as a ratio of fluorescence intensity (F) to maximum intensity. Average frequency of intracellular calcium oscillations (bottom) of control and CNO-treated cocultures (n = 2–4 cells or ROIs from three to five videos or cocultures per group). (C) Timeline of differentiation of OptoNeurons from hPSCs (top). Large-scale formation of OptoNeuron sphere cultures (with YFP-fused ChR2) was achieved using microwell plates (bottom). Dissociated cells compacted over time to form spheres. Scale bars: 200 µm. (D) Neural spheres formed with microwell (µ-well) plates allowed for customizable cellular density and demonstrated more consistent shape (circularity, with a value of 1 representing a circle; left) and size (right) compared with cultures which were allowed to self-aggregate (n = 6–33 spheres each). (E) RNAseq of day-14 OptoNeuron sphere cultures confirmed significant upregulation of neuronal-restricted genes compared to day-12 iAstros (n = 3; for Padj ≤ 0.05, FPKM > 1); see Data S3. (F) OptoNeuron spheres were attached to microelectrode arrays (MEAs) for live electrophysiological recordings. Shown are two merged spheres on an MEA (left). OptoNeurons on MEAs elicited voltage spikes after acutely induced blue light optical stimulation (5 ms pulse width) at increasing frequencies (right; see Fig. S3). Scale bar: 200 µm. (G) Viability (n = 7; measured by a CellTiter-Glo 3D Assay and normalized to sphere area; left) and spontaneous (middle) and blue light–evoked (right) activity of day-21 OptoNeuron spheres (n = 7–41 electrodes each, after threshold) under different media conditions, including neural media NM or BP, with or without ascorbic acid and BDNF/GDNF growth factors (GF). Results are shown as mean ± SEM. In D and G, dots represent individual spheres or electrodes. For G, significance was determined using a one-way ANOVA followed by Tukey’s multiple comparison test, with *, P ≤ 0.05; **, P ≤ 0.01; ****, P ≤ 0.0001.
Figure S2.
Figure S2.
Genetically encoded tools in human neurons. (A) Live calcium imaging of iNeurons expressing a genetically encoded calcium indicator (GCaMP6). Spontaneous calcium oscillations were measured as a function of time in day-19–21 GCaMP6-only monocultures (n = 2–5 cells or ROIs from five monocultures or videos). (B) OptoNeuron (iNeuron) targeting scheme. (C) Differentiation of OptoNeurons from hPSCs to a pure population expressing MAP2 on day 7. Scale bars: top left, 500 µm; all others, 100 µm. (D) Spheres that were cultured under continuous gentle rocking conditions generally remained as single, unmerged spheres compared to those cultured under stationary conditions after 24 h (left); moreover, spheres displayed smaller cross-sectional areas and greater circularity (middle) under rocking conditions. Those spheres that did merge under rocking conditions had fewer spheres per merged aggregate than those cultured under stationary conditions (right; n = 15–23 spheres per group). Dots represent individual electrodes, with mean ± SEM values shown above dot plots. Scale: 500 µm. (E) In comparison with media conditioned by day-9 OptoNeuron sphere cultures, day-12 iAstro–conditioned media contained significantly increased abundance of synaptogenic proteins, as confirmed by unbiased semiquantitative proteomic analysis. Only astrocyte-related proteins from Fig. 1 E were considered for this statistical comparison; see Data S2. Heatmap represents average of log2FoldChange (n = 3 each), with *, P ≤ 0.05; **, P ≤ 0.01; ****, P ≤ 0.0001 (see asterisks overlaid on heatmap).
Figure S3.
Figure S3.
Optogenetic stimulation and recording of human neurons. (A) A 30 mm distance (d) from the MEA electrodes provided an optimal power density of ∼0.29 mW/mm2 from a 470 nm LED, while limiting noise on the MEA measurement system. (B) Non-optogenetic iNeurons (i.e., GCaMP6) did not respond to blue light stimulation (denoted as +) on MEAs (n = 18–24 electrodes each). (C) Raster plots of OptoNeuron monocultures in response to increasing optical stimulation frequency (1–40 Hz) at pulse widths varying from 1 to 5 ms. Below 3 ms, there was minimal detectable pacing of cells in response to light. A 5 ms pulse width was deemed optimal for subsequent experiments. Each horizontal row represents one electrode (pre-threshold; n = 20 electrodes per group). (D) As there was no detectable correlation between spontaneous and stimulated (1–40 Hz) firing rates, we determined a minimum threshold cutoff of 0.1 Hz for both spontaneous and stimulated firing rates. This threshold was applied across monoculture and coculture groups. Dotted lines indicate linear regression fits (top). Inset boxes (bottom) show detail from x = [0,0.3]Hz and y = [0,0.8]Hz. (E and F) Spontaneous versus light-induced firing rates (n = 7–41 electrodes each, after threshold) of day-21 OptoNeuron spheres on MEAs (E) and temporal attachment to Matrigel (F; n = 8–9 spheres each time point) under different media conditions (see Fig. 2 G). (G) Viability (n = 5–10; measured by a CellTiter-Glo 3D Assay and normalized to sphere area) of day-12 and day-18 spheres in NM+Dox, in the absence or presence of chronic BDNF and NT3 treatment. Results are shown as mean ± SEM. In B, D and E, dots represent individual spheres or electrodes. For B, E, and G, significance was determined using two-tailed paired t tests, with *, P ≤ 0.05; **, P ≤ 0.01; ***, P ≤ 0.001; ****, P ≤ 0.0001.
Figure 3.
Figure 3.
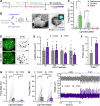
Cell-specific activation of astrocytes within all-inducible bioengineered organoids. (A) Differentiated iAstros or Astrostim cells were cocultured with OptoNeurons. (B) Neural spheres have genetically encoded capabilities for cell-selective optogenetic (neuronal) or chemogenetic (astrocyte-specific) activation. Cocultures exhibited cell-restricted markers including S100 (see Video 3). Scanning electron microscopy scale: 100 µm; inset: 10 µm. S100/ChR2/DAPI scale and inset: 200 µm. (C) Spheres containing day-22 OptoNeurons or cocultured with iAstros (1:1) exhibited significantly increased firing rates when exposed to 40 Hz blue light stimulation (denoted as +) on MEAs (n = 6–19 electrodes each, after threshold). OptoNeurons, Coculture, and iAstros data are shown left to right in the plots. (D) Astrostim-OptoNeuron coculture spheres (1:1,000), visualized with YFP-fused ChR2 and stained for S100, with (bottom) and without (top) 2-d CNO treatment. Shown are 1-µm slices (left) and maximum projections (133 µm, right). Scale: 50 µm. See Video 6. (E) Chronic CNO treatment of Astrostim cells for up to 18 d did not significantly affect viability of cocultured OptoNeurons (1:10) compared with controls, as measured by a CellTiter-Glo 3D Assay. Luminescence readings were normalized to sphere cross-sectional areas (n = 12–24 spheres each). (F) A significant increase in secreted THBS1 protein was observed in conditioned media from coculture spheres with 2-d CNO treatment compared with controls, as measured by ELISA (n = 3 each). (G) Spontaneous and light-induced response of OptoNeuron–Astrostim cocultures (10:1) on MEAs under basal conditions (NM). 11-d chronic treatment of cocultures resulted in significantly decreased activity compared with controls (n = 25–32 electrodes each, postthreshold). (H) Spontaneous and light-induced response of OptoNeuron–Astrostim cocultures (10:1) on MEAs under optimal conditions (BP+GF). Chronic 16-d CNO treatment did not significantly alter light-induced firing rates (n = 64–84 electrodes each, after threshold; left). Representative traces are shown (right). Results are shown as mean ± SEM. For F, significance was determined using a two-tailed unpaired t test. In C, E–H, dots represent individual electrodes or spheres. For C, G, and H, significance was determined using a two-tailed paired t test to compare spontaneous to light-induced firing rates within the same groups only. For G and H, significance was determined using a one-way ANOVA followed by a Šidák post hoc test for multiple comparisons between spontaneous or light-induced firing rates across groups, with *, P ≤ 0.05; **, P ≤ 0.01; ***, P ≤ 0.001; ****, P ≤ 0.0001.
Figure S4.
Figure S4.
OptoNeuron–astrocyte coculture and dual modulation. (A) Representative confocal Z stack of a single GFAP-positive astrocyte within coculture spheres (ratio of 1:1,000 iAstros:OptoNeurons) after 1 d of coculture (i.e., sphere formation) revealed multiple primary branches immediately extending into the tissue. By day 21, iAstros were extensively elongated and branched. Scale: 100 µm. (B) Synaptophysin (SYP)-positive presynaptic puncta were observed in close proximity to astrocytes by day 21 of coculture. Scale: 50 µm. (C) Spheres containing day-22 OptoNeuron monocultures or OptoNeuron-iAstro cocultures (1:1) demonstrated significantly increased firing rates when exposed to 40 Hz blue light stimulation (+), as measured on MEAs on day 22 of neuronal differentiation with 0.1 Hz cutoff threshold (n = 6–19 electrodes each, after threshold). Shown are mean firing rates after threshold with 40 Hz optical stimulation (left), stimulated response as a percentage of the spontaneous firing rate (middle), and Log2FoldChange (stimulated/spontaneous firing rates; right). Firing rates results are also displayed in Fig. 3 C. OptoNeurons, coculture, and iAstros data are shown left to right in the plots. (D) Oxygen consumption rates (OCR) of iAstro monocultures and OptoNeuron–iAstro cocultures (1:1) at baseline, ATP-linked, maximal, and spare capacity respiration (after treatment with oligomycin, carbonyl cyanide-4 (trifluoromethoxy) phenylhydrazone (FCCP), and rotenone/antimycin A, respectively), as measured by Seahorse assay (n = 6 spheres each). (E) Control (top) and 6-d CNO–treated (bottom) spheres stained for Synapsin1. Scale: 50 µm. (F) Average ClCasp3 signal as a fraction of total nuclear signal (measured by DAPI) in control and 6-d CNO–treated coculture spheres (n = 7–10 images each). (G) THBS1 protein was significantly increased in astrocyte-conditioned media from monocultures of Astrostim cells stimulated with 2-d CNO treatment compared with controls, as measured by ELISA (n = 3 each). (H) Neither OptoNeurons in monoculture (left) nor cocultured with Astrostim cells (10:1; right) displayed a significant different in either spontaneous or light-induced firing rates with 2-h or 2-d CNO treatment, compared with controls (n = 8–24 electrodes each, after threshold). Results are shown as mean ± SEM. In C and H, dots represent individual spheres or electrodes. For H, significance was determined using a one-way ANOVA followed by Tukey’s multiple comparison test between spontaneous or light-induced firing rates across groups, with *, P ≤ 0.05.
Figure 4.
Figure 4.
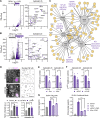
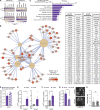
Characterization of chemogenetic astrocyte reactivity and discovery of downstream intracellular and extracellular signaling mechanisms. (A and B) Subset of inflammatory transcripts upregulated (purple) in day 14 Astrostim cells treated with CNO for 2 h (A) or 2 d (B), compared with nontreated control cells (gray; n = 3 each), as detected by RNAseq; see Data S4. (C) Top 5 KEGG pathways significantly upregulated in 2-h CNO treatment of Astrostim cells, shown as a simplified connectome map (CNet plot). Pathways are shown as hubs (gray, containing KEGG IDs and number of DEGs in pathway) with associated genes (purple). See Fig. S5 B and Data S4. For all pathways, Padj ≤ 0.0001. KS, Kaposi sarcoma. (D) CNO and IL-1α+TNF-α (10 ng/ml) treatments increased NF-κB nuclear translocation compared with controls. Shown are NF-κB (white) and DAPI (magenta) signals with insets of single cells (top left) and nuclear NF-κB confined to DAPI mask regions (top right), as well as nuclear NF-κB signal intensities normalized to controls (bottom; n = 3 each). (E) Gene expression of the inflammatory marker CCL2 significantly decreased with 2-h pretreatment of 20 µM Dex preceding 2-h and 2-d CNO treatment of Astrostim cells (normalized to non–Dex-treated controls; n = 5 each). (F) Gene expression of the inflammatory marker CCL2 decreased with 2-h pretreatment of 1 µM IκB inhibitor ACHP preceding 2-h and 2-d CNO treatment of Astrostim cells (normalized to non–ACHP treated controls; n = 4 each). (G) Quantification of CCL2 protein in cell lysate (left) or conditioned media (right) was quantified by ELISA. As expected, CNO treatment significantly increased CCL2 protein levels from non–CNO treated controls. Application of ACHP or Dex to Astrostim cells preceding CNO treatment significantly decreased CCL2 protein levels (n = 3 each). Asterisks under bars indicate a significant increase in CCL2 levels with CNO treatment, compared with the control; asterisks above bars indicate a significant decrease in CCL2 levels with drug pretreatments, compared with CNO treatment alone. All scale bars: 100 µm; inset of D: 10 µm. Results are shown as mean ± SEM. For D–F, significance was determined using two-tailed unpaired t tests. For G, significance was determined using a one-way ANOVA followed by Tukey’s multiple comparison test, with *, P or Padj ≤ 0.05; **, P or Padj ≤ 0.01; ***, P or Padj ≤ 0.001; ****, P or Padj ≤ 0.0001.
Figure S5.
Figure S5.
Inflammatory response and Astrostim cell intracellular signaling mechanisms via chemogenetic activation of human astrocytes. (A) Subset of reactive astrocyte markers significantly upregulated in day-12 Astrostim cells after 2-h (left) and 2-d (right) CNO treatment compared to controls (n = 3 each), as detected by RNAseq and shown as log2FoldChange. Identified genes were (i) restricted or (ii) not restricted to those also upregulated in iAstros compared with NPCs, with IEGs omitted; see Data S4. (B) Complete connectome map (CNet plot) of top 5 KEGG pathways significantly upregulated in 2-h CNO treatment of Astrostim cells (see Fig. 4 C). Pathways are shown as yellow hubs (left), with associated genes listed as geneIDs (right) and colorized according to FoldChange. (C) Top KEGG pathways upregulated in 2-d CNO treatment compared with 2-h CNO treatment. Numbers indicate total DEG counts concerning these pathways, for Padj ≤ 0.0001 and −log10(Padj) > 2. (D) Quantification of conditioned media using a Quantibody Human Cytokine Array revealed that CCL2 (MCP-1) protein was consistently secreted upon CNO treatment from Astrostim cells in monoculture (2-d CNO; n = 3) as well as in coculture spheres with OptoNeurons (6-d CNO; n = 2). (E) 2-h (left) and 2-d (right) CNO treatment resulted in upregulation of CCL2 expression in Astrostim cell monocultures, as quantified by qPCR (n = 4 each). (F) 6-d CNO treatment resulted in significant upregulation of CCL2 expression within cocultures spheres of Astrostim cells and OptoNeurons, as quantified by qPCR (n = 4 each). (G) Pretreatment with 10 µM of the IκB inhibitor ACHP for 1 h significantly decreased nuclear NF-κB signal in Astrostim cells, compared with Astrostim cells without ACHP pretreatment (n = 3 groups each, with five images per group). Scale: 100 µm. (H) Chronic (15 d) treatment with 100 nM recombinant human CCL2 in BP+GF did not significantly alter neuronal firing rates on MEAs compared with non–CCL2 treated controls (n = 8–10). Results are shown as mean ± SEM. In H, dots represent individual electrodes. For A, significance was determined using the DESeq2 R package. For E–G, significance was determined using two-tailed unpaired t tests, with *, P ≤ 0.05; **, P ≤ 0.01; ***, P ≤ 0.001; ****, P ≤ 0.0001 (see asterisks overlaid on heatmap).

Comment in

References

    1. Allen, N.J., and Eroglu C.. 2017. Cell biology of astrocyte-synapse interactions. Neuron. 96:697–708. 10.1016/j.neuron.2017.09.056 - DOI - PMC - PubMed
    1. Amin, N.D., and Paşca S.P.. 2018. Building models of brain disorders with three-dimensional organoids. Neuron. 100:389–405. 10.1016/j.neuron.2018.10.007 - DOI - PubMed
    1. Anders, S., and Huber W.. 2010. Differential expression analysis for sequence count data. Genome Biol. 11:R106. 10.1186/gb-2010-11-10-r106 - DOI - PMC - PubMed
    1. Artimovich, E., Jackson R.K., Kilander M.B.C., Lin Y.C., and Nestor M.W.. 2017. PeakCaller: an automated graphical interface for the quantification of intracellular calcium obtained by high-content screening. BMC Neurosci. 18:1–15. 10.1186/s12868-017-0391-y - DOI - PMC - PubMed
    1. Barbar, L., Jain T., Zimmer M., Kruglikov I., Sadick J.S., Wang M., Kalpana K., Rose I.V.L., Burstein S.R., Rusielewicz T., et al. . 2020. CD49f is a novel marker of functional and reactive human iPSC-derived astrocytes. Neuron. 107:436–453.e12. 10.1016/j.neuron.2020.05.014. - DOI - PMC - PubMed

Publication types

MeSH terms