. 2022 Aug 27;145(8):2910-2919.
doi: 10.1093/brain/awab453.

A recurrent machine learning model predicts intracranial hypertension in neurointensive care patients

Affiliations

A recurrent machine learning model predicts intracranial hypertension in neurointensive care patients

Nils Schweingruber et al. Brain. .

Abstract

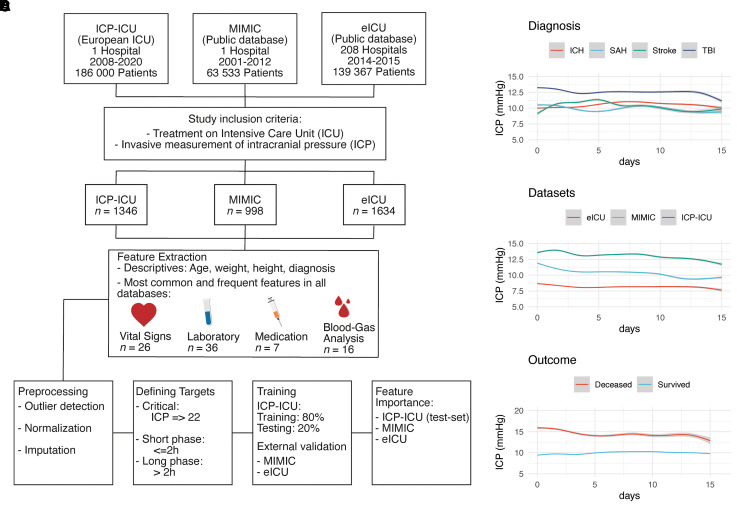
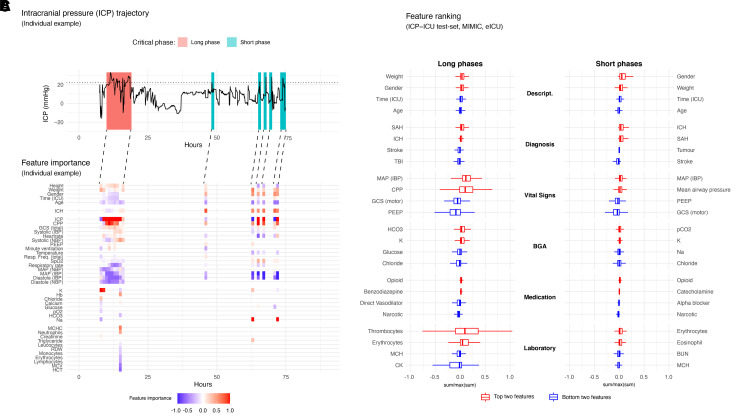
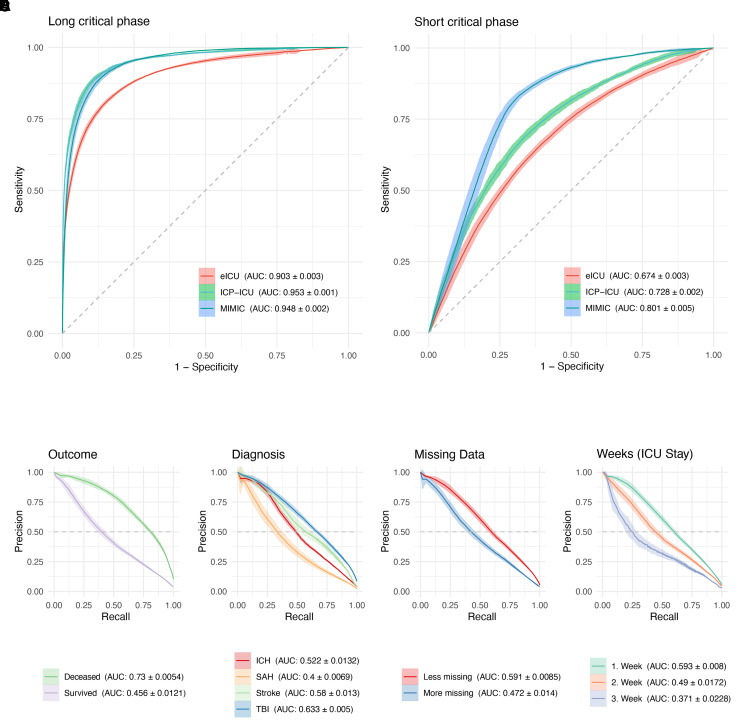
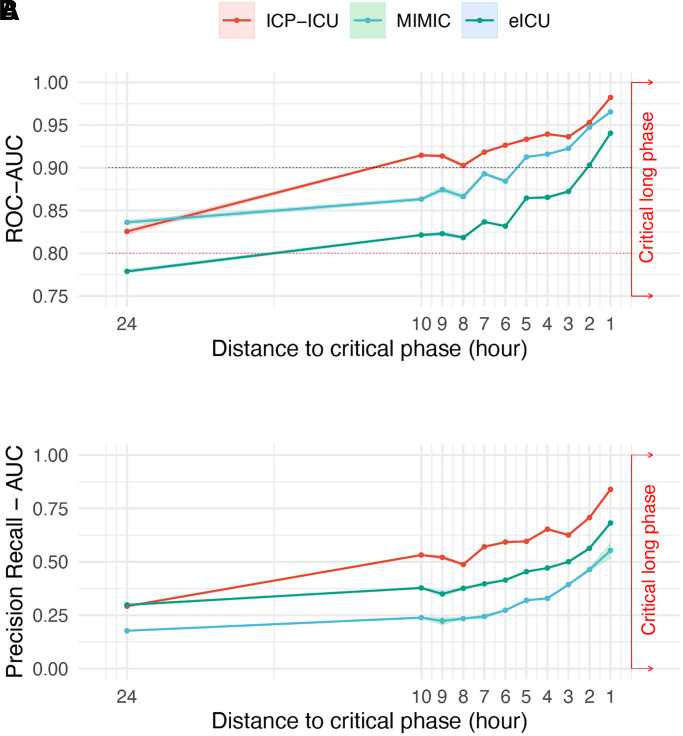
The evolution of intracranial pressure (ICP) of critically ill patients admitted to a neurointensive care unit (ICU) is difficult to predict. Besides the underlying disease and compromised intracranial space, ICP is affected by a multitude of factors, many of which are monitored on the ICU, but the complexity of the resulting patterns limits their clinical use. This paves the way for new machine learning techniques to assist clinical management of patients undergoing invasive ICP monitoring independent of the underlying disease. An institutional cohort (ICP-ICU) of patients with invasive ICP monitoring (n = 1346) was used to train recurrent machine learning models to predict the occurrence of ICP increases of ≥22 mmHg over a long (>2 h) time period in the upcoming hours. External validation was performed on patients undergoing invasive ICP measurement in two publicly available datasets [Medical Information Mart for Intensive Care (MIMIC, n = 998) and eICU Collaborative Research Database (n = 1634)]. Different distances (1-24 h) between prediction time point and upcoming critical phase were evaluated, demonstrating a decrease in performance but still robust AUC-ROC with larger distances (24 h AUC-ROC: ICP-ICU 0.826 ± 0.0071, MIMIC 0.836 ± 0.0063, eICU 0.779 ± 0.0046, 1 h AUC-ROC: ICP-ICU 0.982 ± 0.0008, MIMIC 0.965 ± 0.0010, eICU 0.941 ± 0.0025). The model operates on sparse hourly data and is stable in handling variable input lengths and missingness through its nature of recurrence and internal memory. Calculation of gradient-based feature importance revealed individual underlying decisions for our long short time memory-based model and thereby provided improved clinical interpretability. Recurrent machine learning models have the potential to be an effective tool for the prediction of ICP increases with high translational potential.

Keywords: deep learning; intensive care unit; intracranial pressure; machine learning; traumatic brain injury.


Figures

Figure 1
Figure 1
Overview of study design and ICP dynamics. (A) Workflow of data acquisition, preprocessing, and training. The institutional dataset is labelled as ICP-ICU which was processed the same as the external datasets: MIMIC-III (Medical Information Mart for Intensive Care) and the eICU (eICU Collaborative Research Database). Invasive measurement of intracranial pressure (ICP) and treatment in ICU were the main inclusion criteria. (BD) ICP values over the first 15 days in ICU (mmHg) are depicted according to the diagnosis (B), to the dataset (C), and to the outcome. Values are shown as a generative additive model with standard deviation in grey.
Figure 4
Figure 4
Feature importance of the prediction of long and short critical phases of intracranial pressure. (A) A representative ICU trajectory of an individual patient with invasive ICP monitoring is presented, having a long critical phase in the beginning and several shorter critical phases at the end. The individual ICP course is depicted over time (h); the horizontal dashed line represents our threshold for the definition of critical phases (ICP 22 mmHg). (B) Gradient based saliencies were calculated from five independent models based on the prediction 2 h in advance of the critical phases. All other features which had a low influence are not shown for that trajectory. The lines connecting the saliency and ICP plot demonstrate the predictive horizon. The prediction takes place 2 h in advance and the important features for that prediction at that time are demonstrated. The colour scale is continuous between −1 (blue) and 1 (red). Values being positive are red (to be considered as bad) because their higher values are positively correlated with the prediction of critical phases. Negative values (blue) represent negatively correlated values with the positive prediction. (C) To have a broader view on the top features over all validation datasets (ICP-ICU test set, MIMIC and eICU), the sum of all saliencies per timestep were calculated. The top (red) and bottom (blue) two features are shown for each group. Descript. = patient characteristic, diagnosis, vital signs, BGA, medication, laboratory value; and for each target long (left) and short (right) critical phase. The lower and upper hinges of box plots correspond to the first and third quartiles (the 25th and 75th percentiles) the middle line of the median. The upper and the lower whisker extends from the hinge to the largest and smallest value no further than 1.5 × IQR from the hinge.
Figure 3
Figure 3
Predicting critical phases 2 h in advance. (A) ROC curves are shown of the model predicting critical phases of ICP values of ≥22 mmHg for more than two consecutive hours (>2 h) and are referred to as long critical phases. (B) Critical phases under 2 h (≤2 h) are referred to as short critical phases. A whole hour was defined as critical (target) when one single ICP value measurement that hour was ≥22 mmHg. Ribbons represent the standard deviation of five independent models. Model performance on external datasets is also shown MIMIC (blue) and eICU (red) (A and B). Model performance according to certain subgroups was drawn as a PR curve. Outcome (C) is defined as deceased on ICU stay. (D) Diagnosis is defined by main diagnosis of ICD-10. (E) Missing data dichotomy was done by defining two groups of days per patient. One group had fewer than 77% missing data-points (of a total of 2016 possible data-points per day), splitting the days into two groups (49.8% Less Missing and 50.2% More Missing). (F) To show a possible decline in model performance over the time course of ICU stay, all days are grouped according to their week. For each group or subgroup drawn in a different colour, the corresponding AUC and the standard deviation are shown in the legend.
Figure 2
Figure 2
Performance of models with different distances between prediction time point and upcoming critical phase. (A) Five independent models were trained on different splits of training data from our institutional dataset to predict critical phases up to 24 h in advance. The AUC of ROC curves and (B) PR curves with the corresponding standard deviation of five independent models (ribbon) are depicted for each trained hour (1–10 h and 24 h). Performance on the underlying test set of the institutional dataset (ICP-ICU in red) and external datasets MIMIC (green) and eICU (blue) are depicted separately.

References

    1. Topol EJ. High-performance medicine: the convergence of human and artificial intelligence. Nat Med. 2019;25(1):44–56. - PubMed
    1. Bach TA, Berglund L-M, Turk E. Managing alarm systems for quality and safety in the hospital setting. BMJ Open Qual. 2018;7(3):e000202. - PMC - PubMed
    1. Bridi AC, da Silva RCL, de Farias CCP, Franco AS, dos Santos VdeLQ. Reaction time of a health care team to monitoring alarms in the intensive care unit: implications for the safety of seriously ill patients. Rev Bras Ter Intensiva. 2014;26(1):28–35. - PMC - PubMed
    1. Poole S, Shah N. Addressing vital sign alarm fatigue using personalized alarm thresholds. Pac Symp Biocomput. 2018;23:472–483. - PMC - PubMed
    1. Komorowski M, Celi LA, Badawi O, Gordon AC, Faisal AA. The Artificial Intelligence Clinician learns optimal treatment strategies for sepsis in intensive care. Nat Med. 2018;24(11):1716–1720. - PubMed

Publication types