. 2022 Mar 3;109(3):417-432.
doi: 10.1016/j.ajhg.2022.01.009. Epub 2022 Feb 8.

Accounting for age of onset and family history improves power in genome-wide association studies

Affiliations

Accounting for age of onset and family history improves power in genome-wide association studies

Emil M Pedersen et al. Am J Hum Genet. .

Abstract

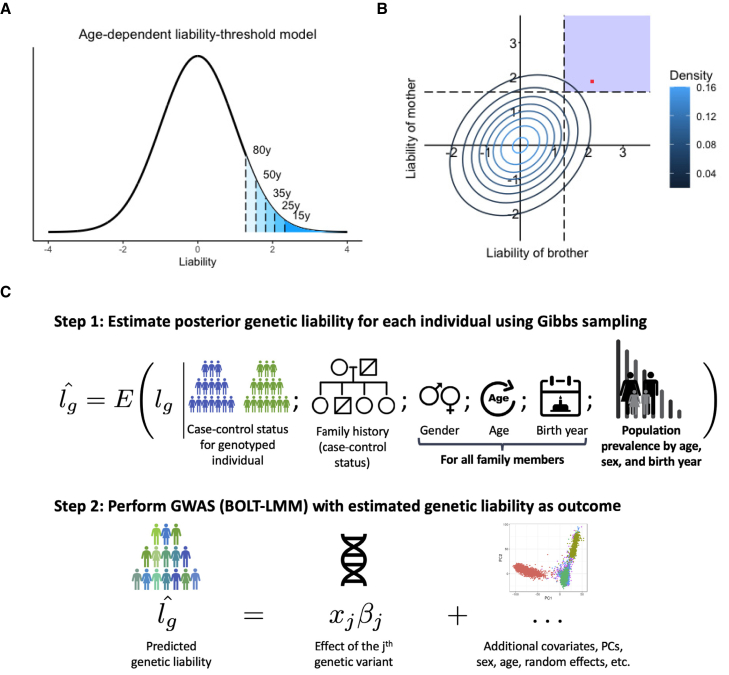
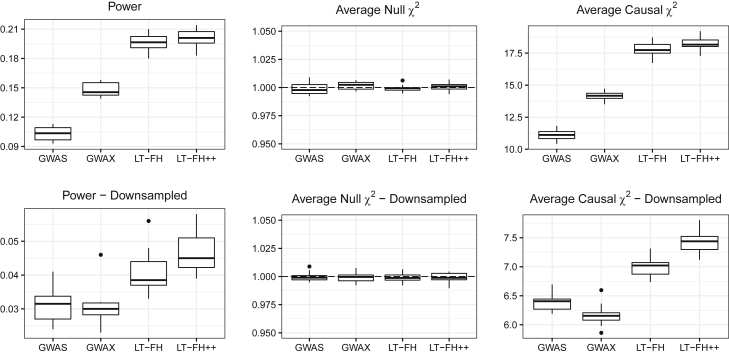
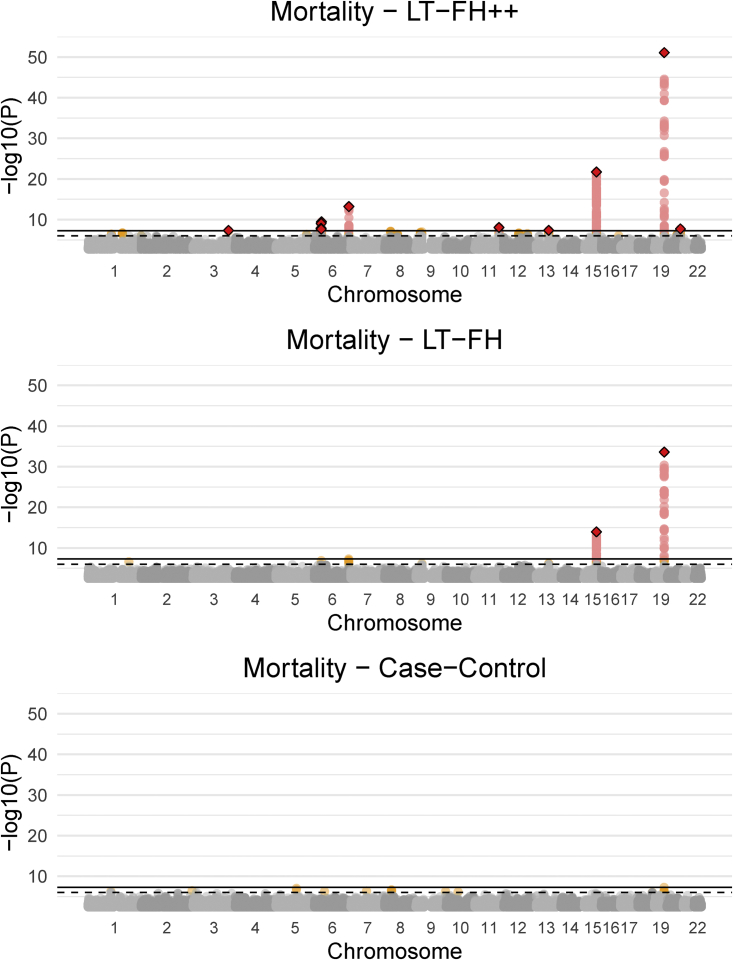
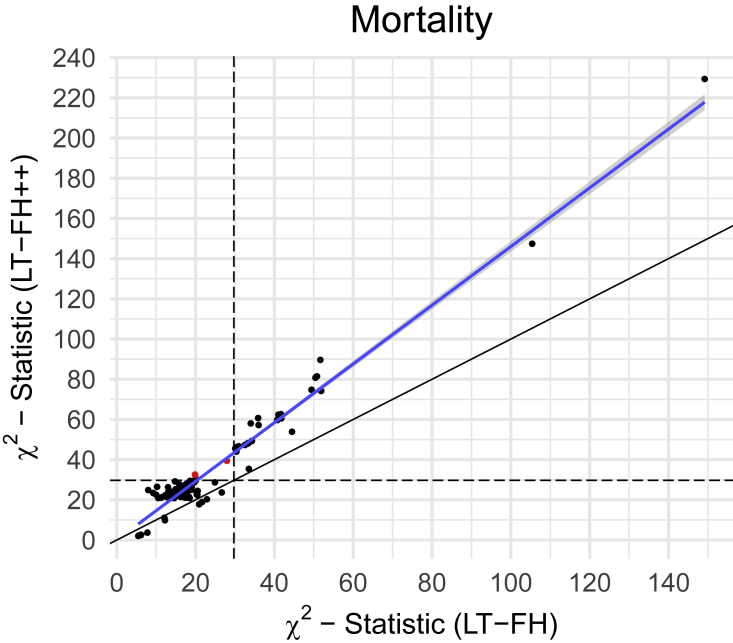
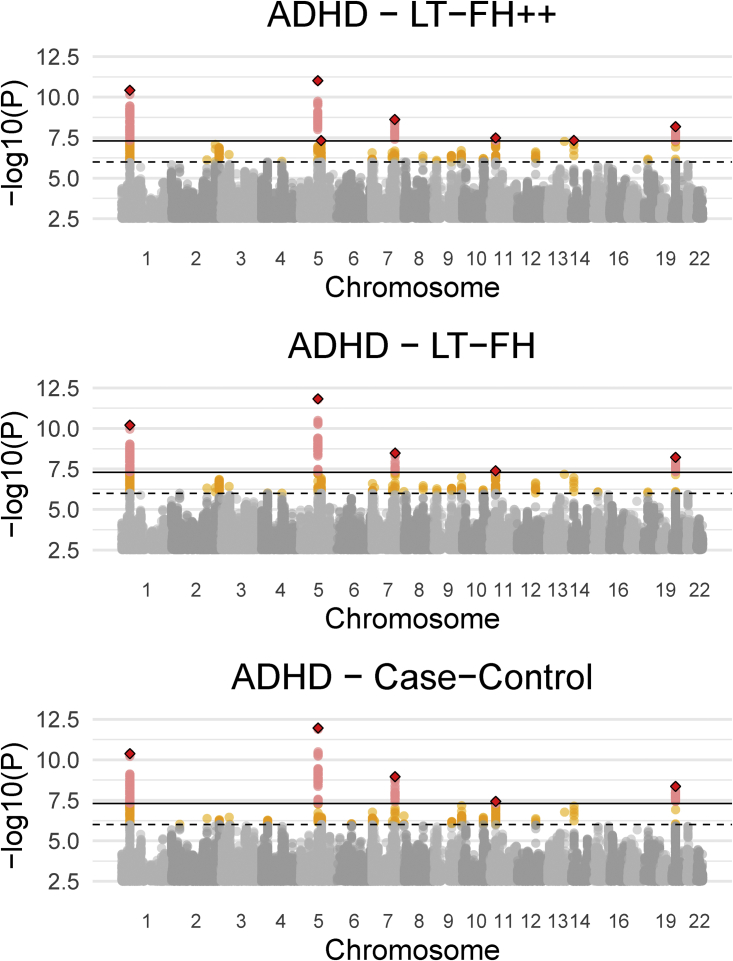
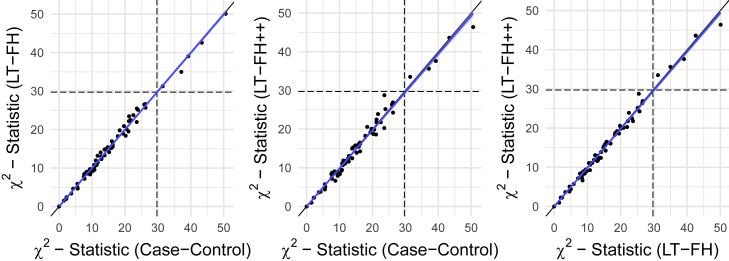
Genome-wide association studies (GWASs) have revolutionized human genetics, allowing researchers to identify thousands of disease-related genes and possible drug targets. However, case-control status does not account for the fact that not all controls may have lived through their period of risk for the disorder of interest. This can be quantified by examining the age-of-onset distribution and the age of the controls or the age of onset for cases. The age-of-onset distribution may also depend on information such as sex and birth year. In addition, family history is not routinely included in the assessment of control status. Here, we present LT-FH++, an extension of the liability threshold model conditioned on family history (LT-FH), which jointly accounts for age of onset and sex as well as family history. Using simulations, we show that, when family history and the age-of-onset distribution are available, the proposed approach yields statistically significant power gains over LT-FH and large power gains over genome-wide association study by proxy (GWAX). We applied our method to four psychiatric disorders available in the iPSYCH data and to mortality in the UK Biobank and found 20 genome-wide significant associations with LT-FH++, compared to ten for LT-FH and eight for a standard case-control GWAS. As more genetic data with linked electronic health records become available to researchers, we expect methods that account for additional health information, such as LT-FH++, to become even more beneficial.

Keywords: ADHD; LT-FH; LT-FH++; UKBB; age-of-onset; family history; genome-wide association study; iPSYCH; liability threshold model; mortality.


Conflict of interest statement

Declaration of interests J.C. has received honoraria for serving on the Scientific Advisory Board of Union Chimique Belge (UCB) Nordic and Eisai AB and for giving lectures for UCB Nordic and Eisai as well as travel funds from UCB Nordic and funding by the Novo Nordisk Foundation (grant number: NNF16OC0019126), the Central Denmark Region, and the Danish Epilepsy Association.

Figures

Figure 1
Figure 1
Overview of LT-FH++ and illustration of the differences between LT-FH and LT-FH++ (A and B) An age-dependent liability threshold model with different thresholds marked (A). The marks correspond to the prevalence at the age of 80 years (10%), 50 years (6%), 35 years (3.5%), 25 years (2%), and 15 years (1%). The posterior mean estimate of the liability is obtained by integrating over the liability space spanned by the genotyped individual and their family members (B). Here, we consider a brother and a mother, where the contour lines indicate the joint multivariate liability density of the mother and the brother (assuming a heritability of 0.5). Using fixed population prevalence for males and females (dashed lines), and assuming mother and brother are cases, LT-FH integrates over the blue shaded area to estimate the genetic liability. In contrast LT-FH++ considers the age of onset, sex, and birth year for family members to obtain a more precise genetic liability estimate highlighted by the red dot. In short, the additional information collapses the area to integrate to a single value. (C) An overview of how LT-FH++ GWAS works and what information it accounts for. In contrast to LT-FH, which accounts for the case-control status of the genotyped individual and family history, LT-FH++ also uses population prevalence information to account for gender, age, and birth year of family members. As with LT-FH, the predicted liabilities are then used as a continuous outcome in a GWAS via BOLT-LMM.
Figure 2
Figure 2
Simulation results for a 5% prevalence, with and without downsampling of controls Linear regression was used to perform the GWAS for LT-FH and LT-FH++, while a 1-df chi-squared test was used for case-control status. We assessed the power of each method by considering the fraction of causal SNPs with a p value below 5×10⁸. Here, GWAS refers to case-control status and LT-FH and LT-FH++ are both without siblings. Downsampling refers to downsampling the controls such that we have equal proportions of cases and controls, i.e., we have 10,000 individuals total for a 5% prevalence and 20,000 individuals for a 10% prevalence.
Figure 3
Figure 3
Manhattan plots for LT-FH++, LT-FH, and case-control GWAS of mortality in the UK Biobank The Manhattan plots display a Bonferroni-corrected significance level of 5×10⁸ and a suggestive threshold of 5×10⁶. The genome-wide significant SNPs are colored in red. The diamonds correspond to top SNPs in a window of size 300,000 base pairs.
Figure 4
Figure 4
The X2statistics for LT-FH++ versus the ones for LT-FH for the GWAS of mortality in the UK Biobank We restricted to variants with a p value below 5×10⁶ for at least one of the three compared outcomes. The common set of variants were LD clumped (prioritizing on minor allele frequencies) in an attempt to not bias one outcome over another. The red dots are variants identified as genome-wide significant for only one of the outcomes. The black dots are suggestive associations identified by either method, or genome-wide significant associations for both methods. The black line indicates the identity line and the blue line is the best fitted line via linear regression. The black dashed lines correspond to the threshold for genome-wide significance.
Figure 5
Figure 5
Manhattan plots for LT-FH++, LT-FH, and case-control GWAS of ADHD in the iPSYCH data The dashed line indicates a suggestive p value of 5×10⁶ and the fully drawn line at 5×10⁸ indicates genome-wide significance threshold. The genome-wide significant SNPs are colored in red. The diamonds correspond to top SNPs in a window of size 300,000 base pairs.
Figure 6
Figure 6
The X2 statistics from the GWAS of ADHD for each of the three methods (LT-FH++, LT-FH, and case-control GWAS) plotted against each other The dots correspond to LD-clumped SNPs that have a p value below 5×10⁶ in the largest published meta-analysis and present in the iPSYCH cohort (see material and methods for details). The blue line indicates the linear regression line between two methods and the black line indicates the identity line. The slopes of the regression lines are not significantly different from one for any pair of methods.

References

    1. Nielsen J.B., Thorolfsdottir R.B., Fritsche L.G., Zhou W., Skov M.W., Graham S.E., Herron T.J., McCarthy S., Schmidt E.M., Sveinbjornsson G., et al. Biobank-driven genomic discovery yields new insight into atrial fibrillation biology. Nat. Genet. 2018;50:1234–1239. - PMC - PubMed
    1. Wuttke M., Li Y., Li M., Sieber K.B., Feitosa M.F., Gorski M., Tin A., Wang L., Chu A.Y., Hoppmann A., et al. A catalog of genetic loci associated with kidney function from analyses of a million individuals. Nat. Genet. 2019;51:957–972. - PMC - PubMed
    1. Mahajan A., Taliun D., Thurner M., Robertson N.R., Torres J.M., Rayner N.W., Payne A.J., Steinthorsdottir V., Scott R.A., Grarup N., et al. Fine-mapping type 2 diabetes loci to single-variant resolution using high-density imputation and islet-specific epigenome maps. Nat. Genet. 2018;50:1505–1513. - PMC - PubMed
    1. Siewert K.M., Voight B.F. Bivariate Genome-Wide Association Scan Identifies 6 Novel Loci Associated With Lipid Levels and Coronary Artery Disease. Circ Genom Precis Med. 2018;11:e002239. - PMC - PubMed
    1. Nalls M.A., Blauwendraat C., Vallerga C.L., Heilbron K., Bandres-Ciga S., Chang D., Tan M., Kia D.A., Noyce A.J., Xue A., et al. Expanding Parkinson’s disease genetics: novel risk loci, genomic context, causal insights and heritable risk. bioRxiv. 2019 doi: 10.1101/388165. - DOI - PubMed

Publication types