. 2022 Feb 8;55(2):254-271.e7.
doi: 10.1016/j.immuni.2021.12.014.

Interferon gamma constrains type 2 lymphocyte niche boundaries during mixed inflammation

Affiliations

Interferon gamma constrains type 2 lymphocyte niche boundaries during mixed inflammation

Kelly M Cautivo et al. Immunity. .

Abstract

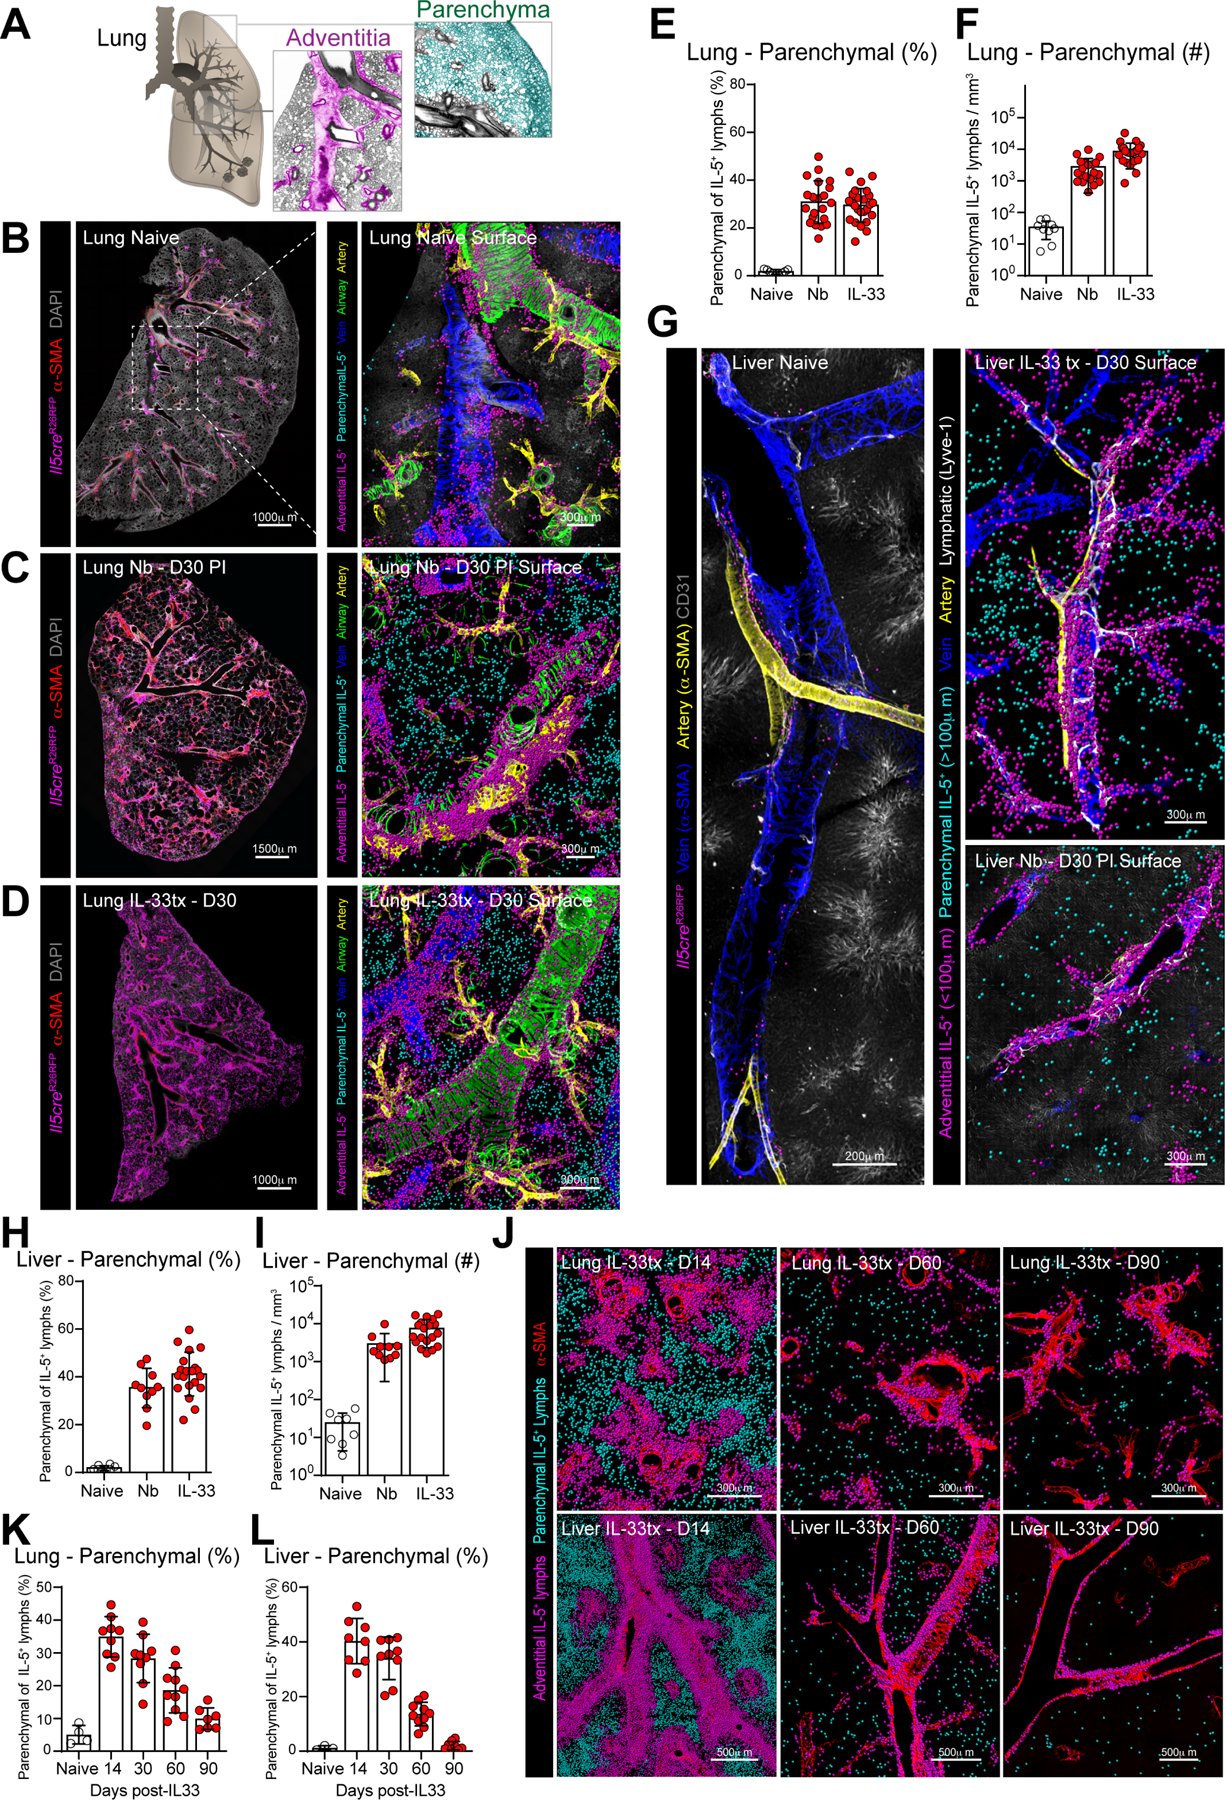
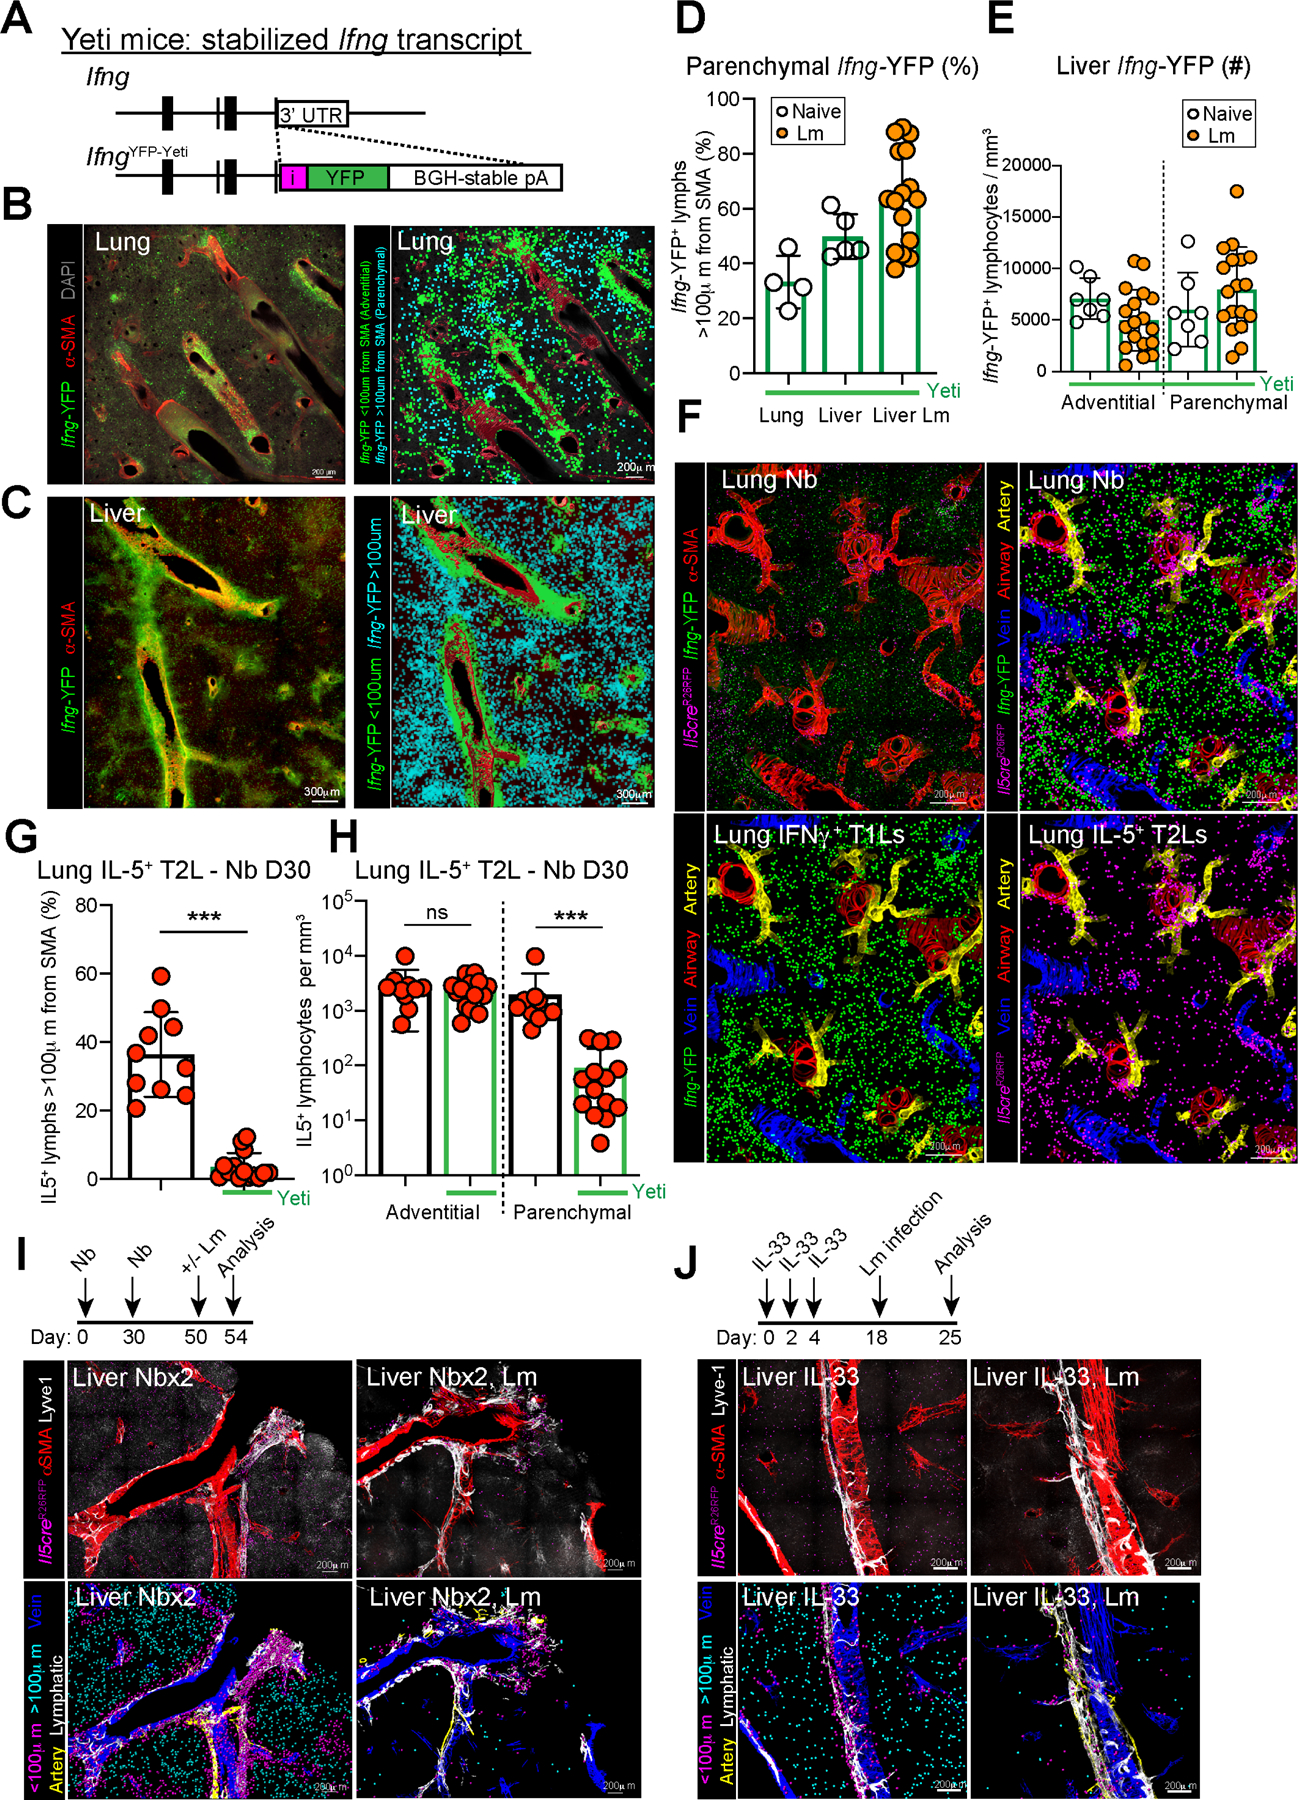
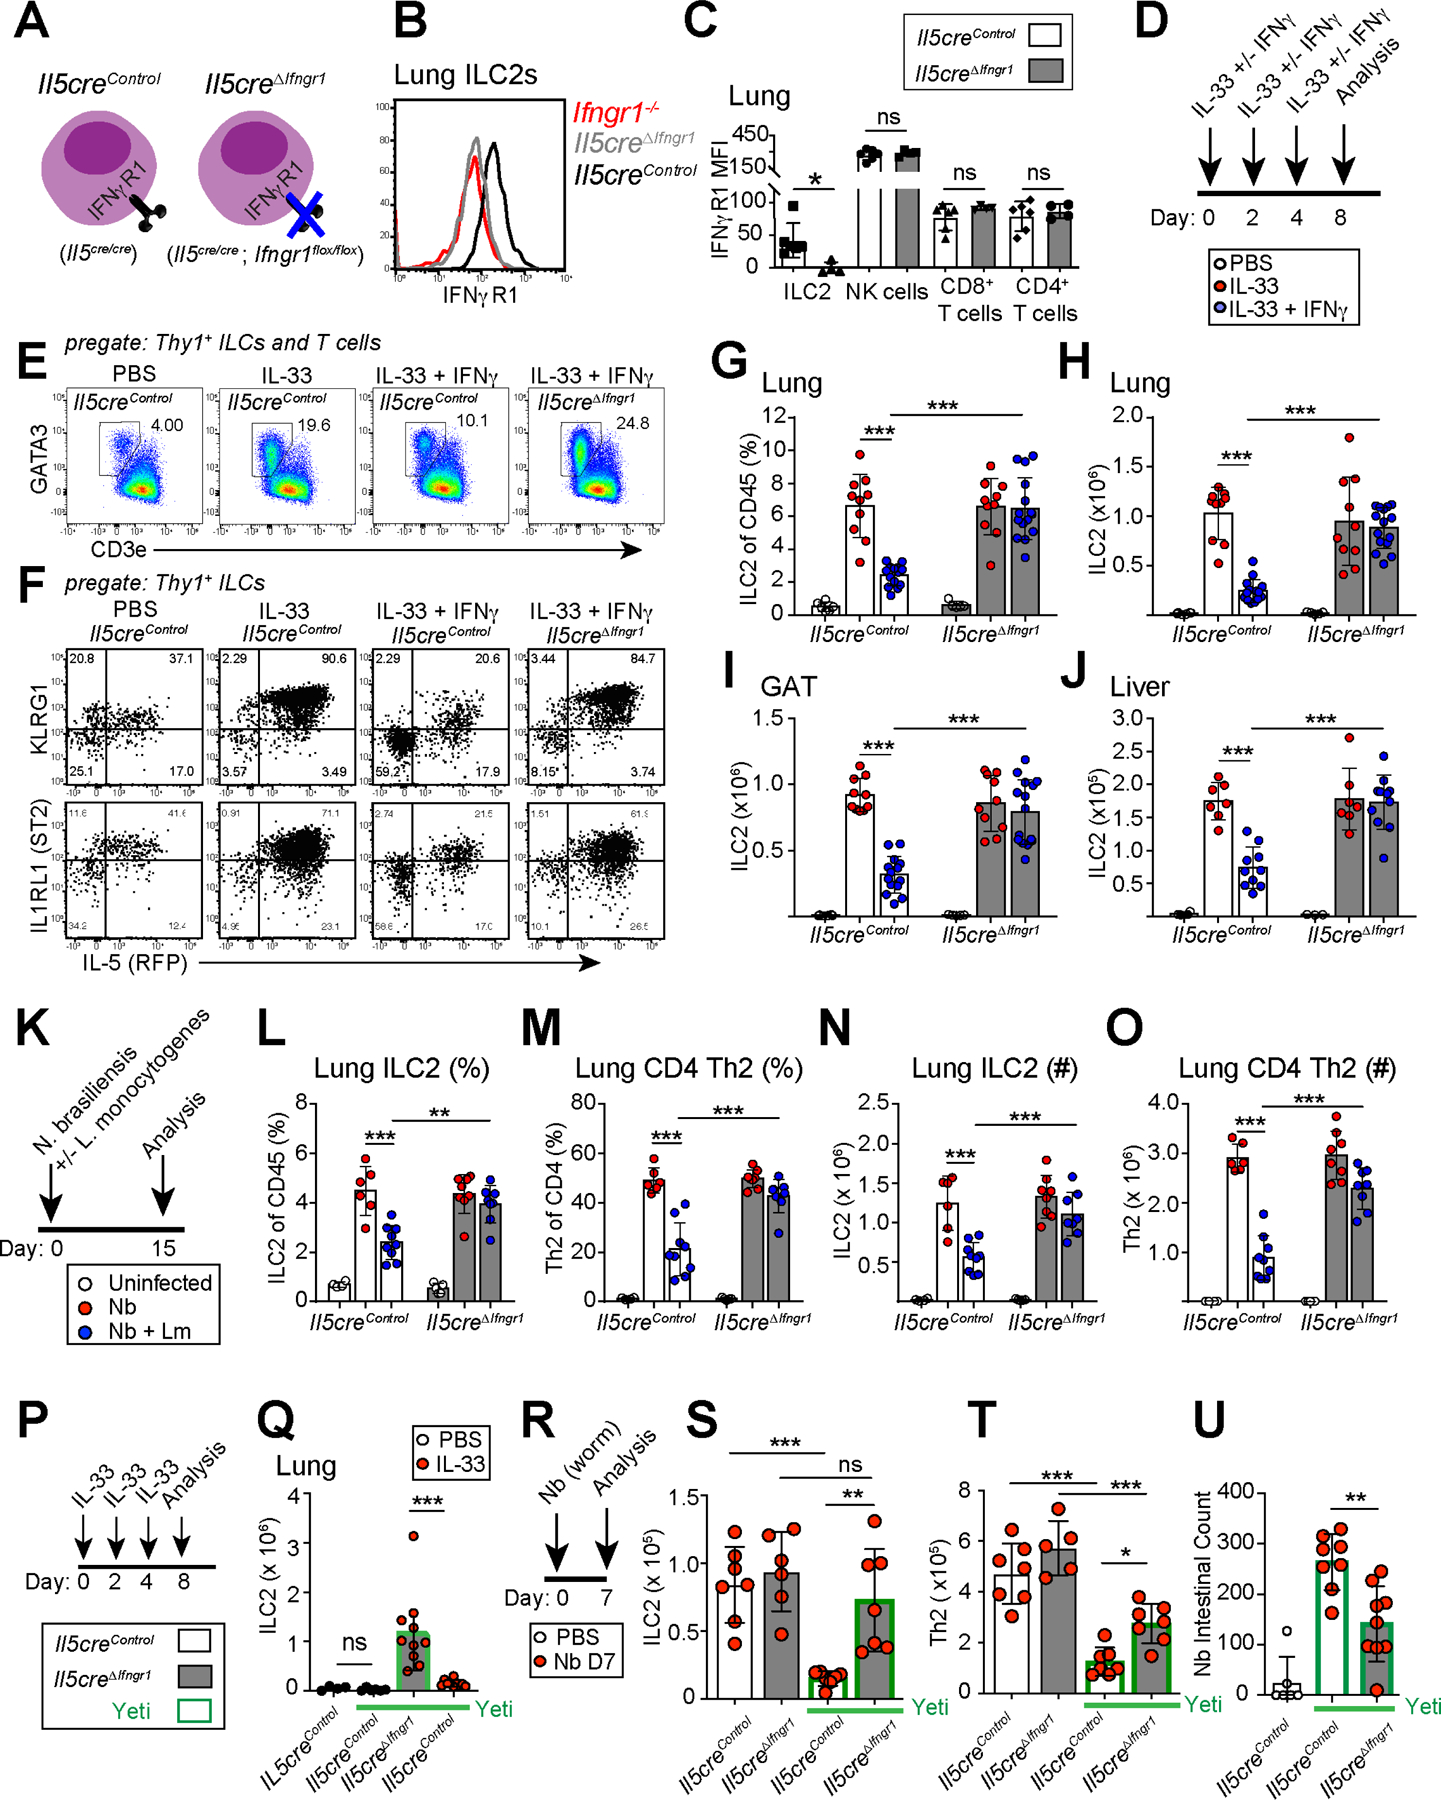
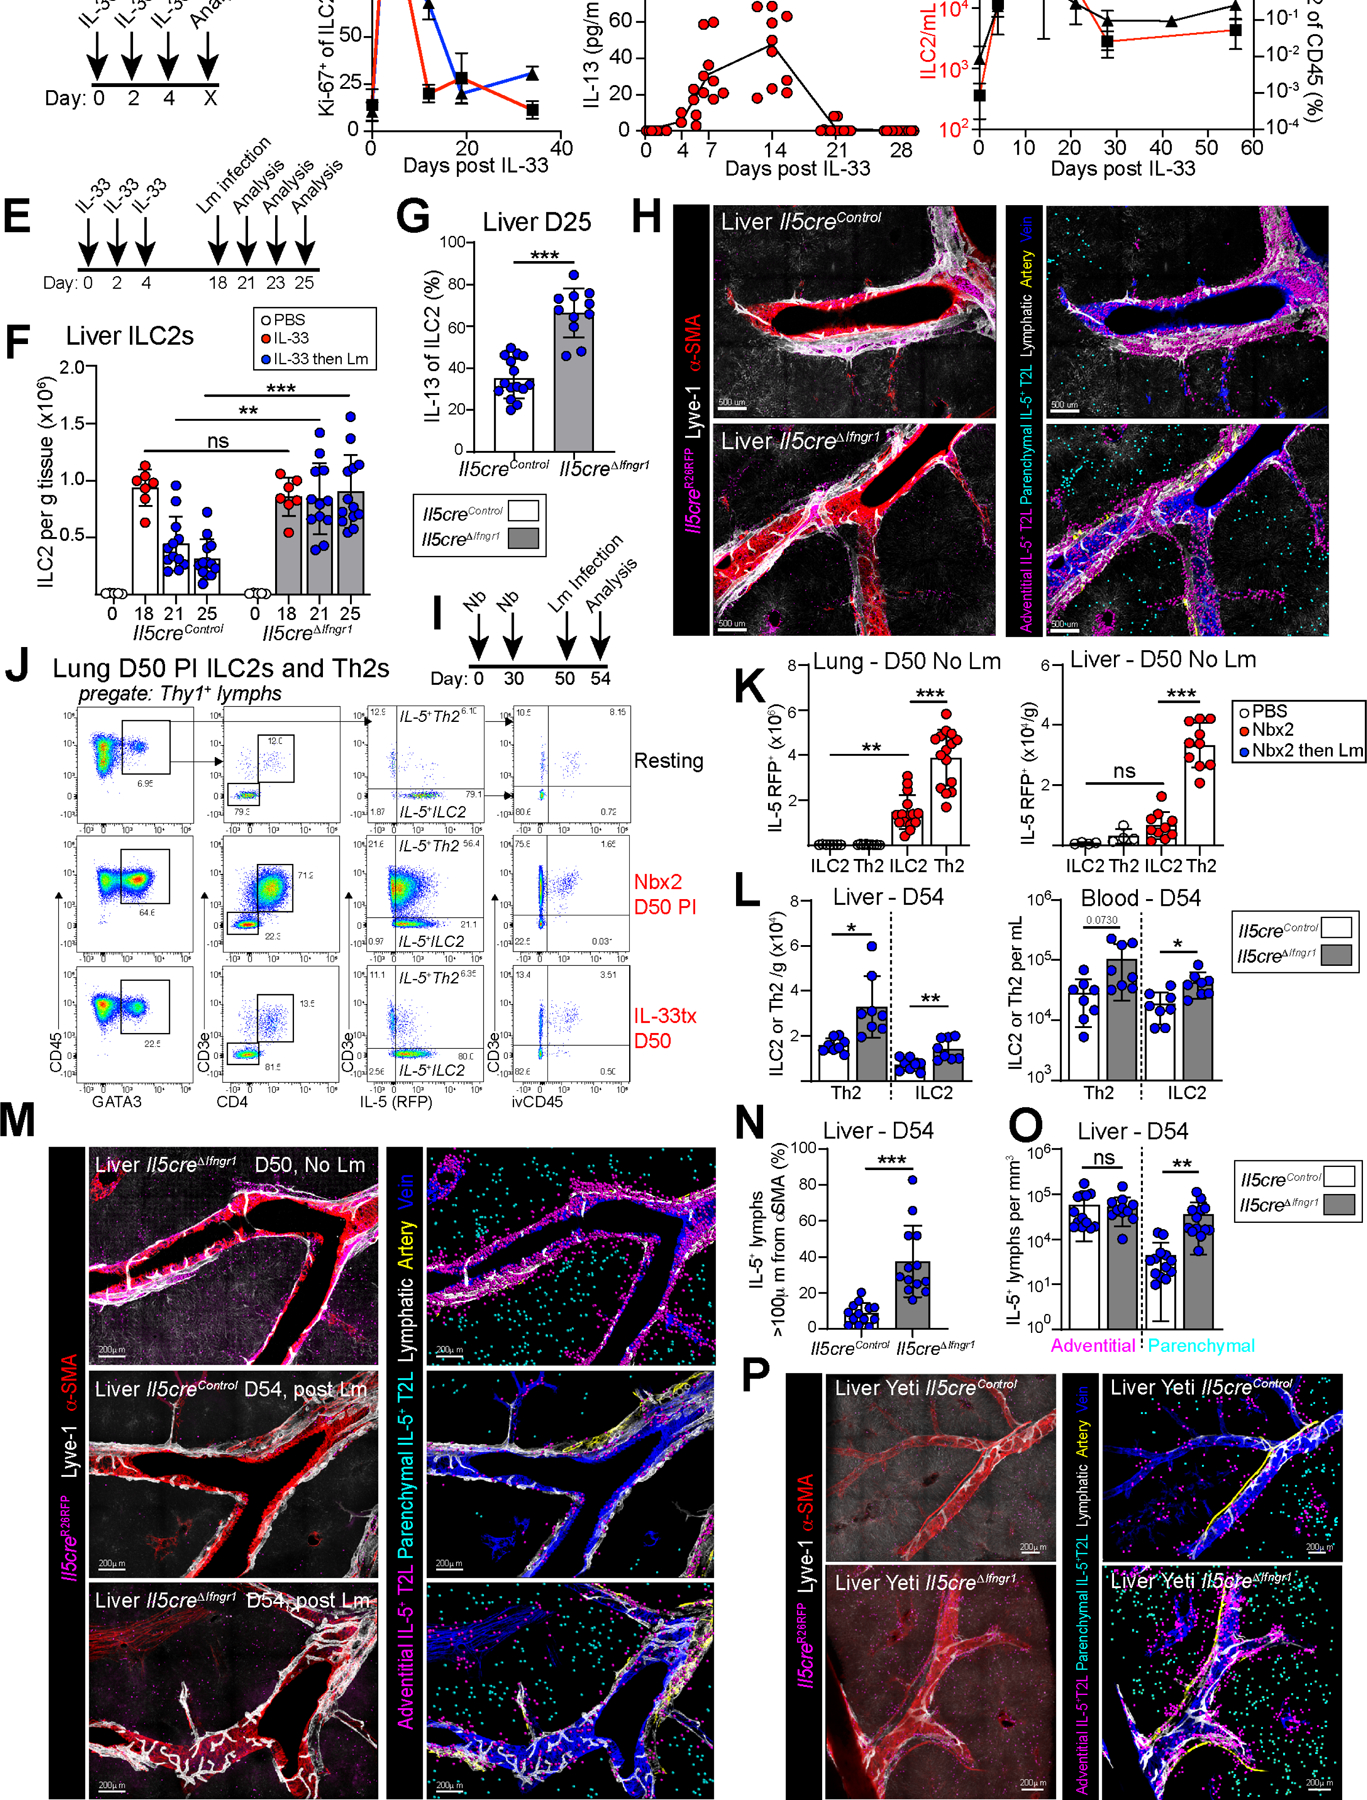
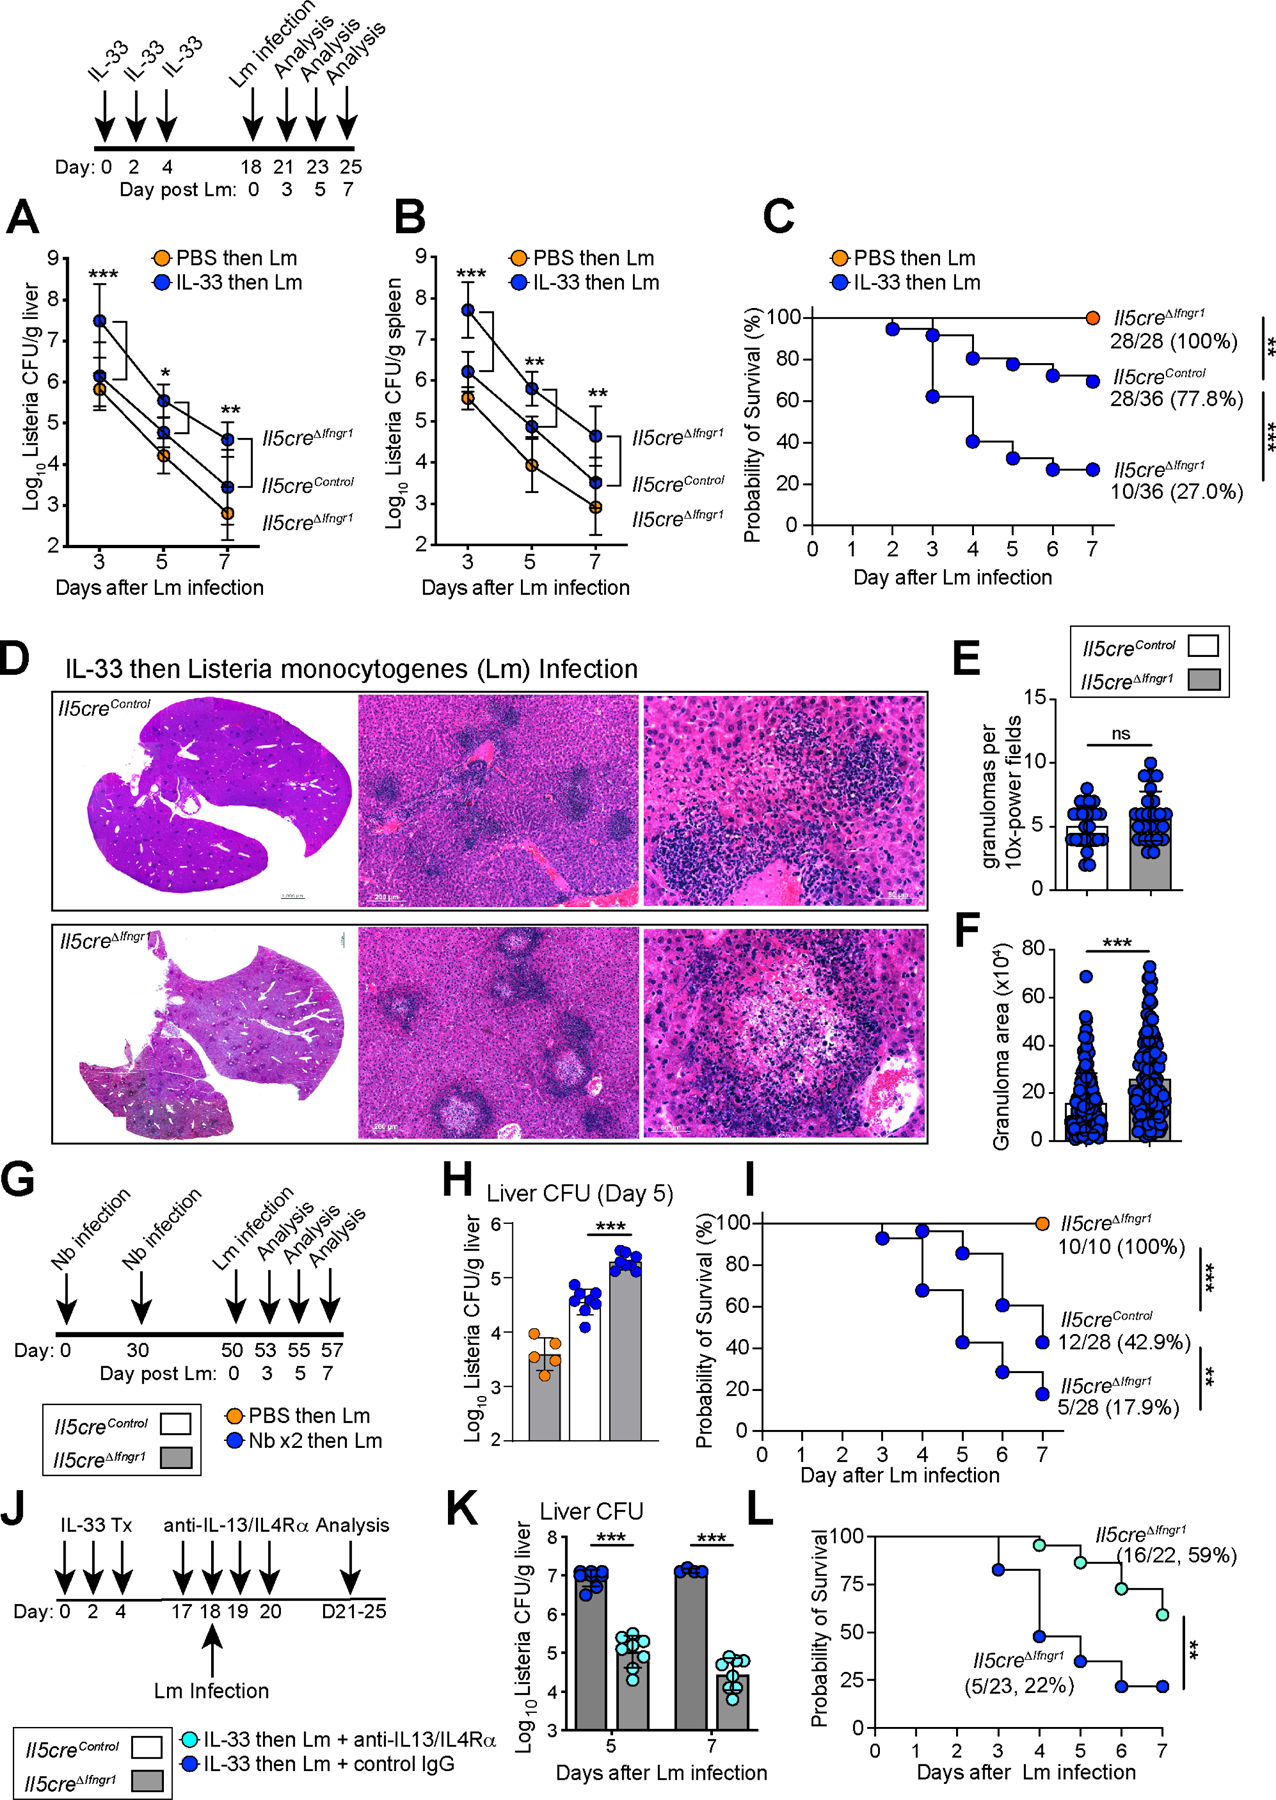
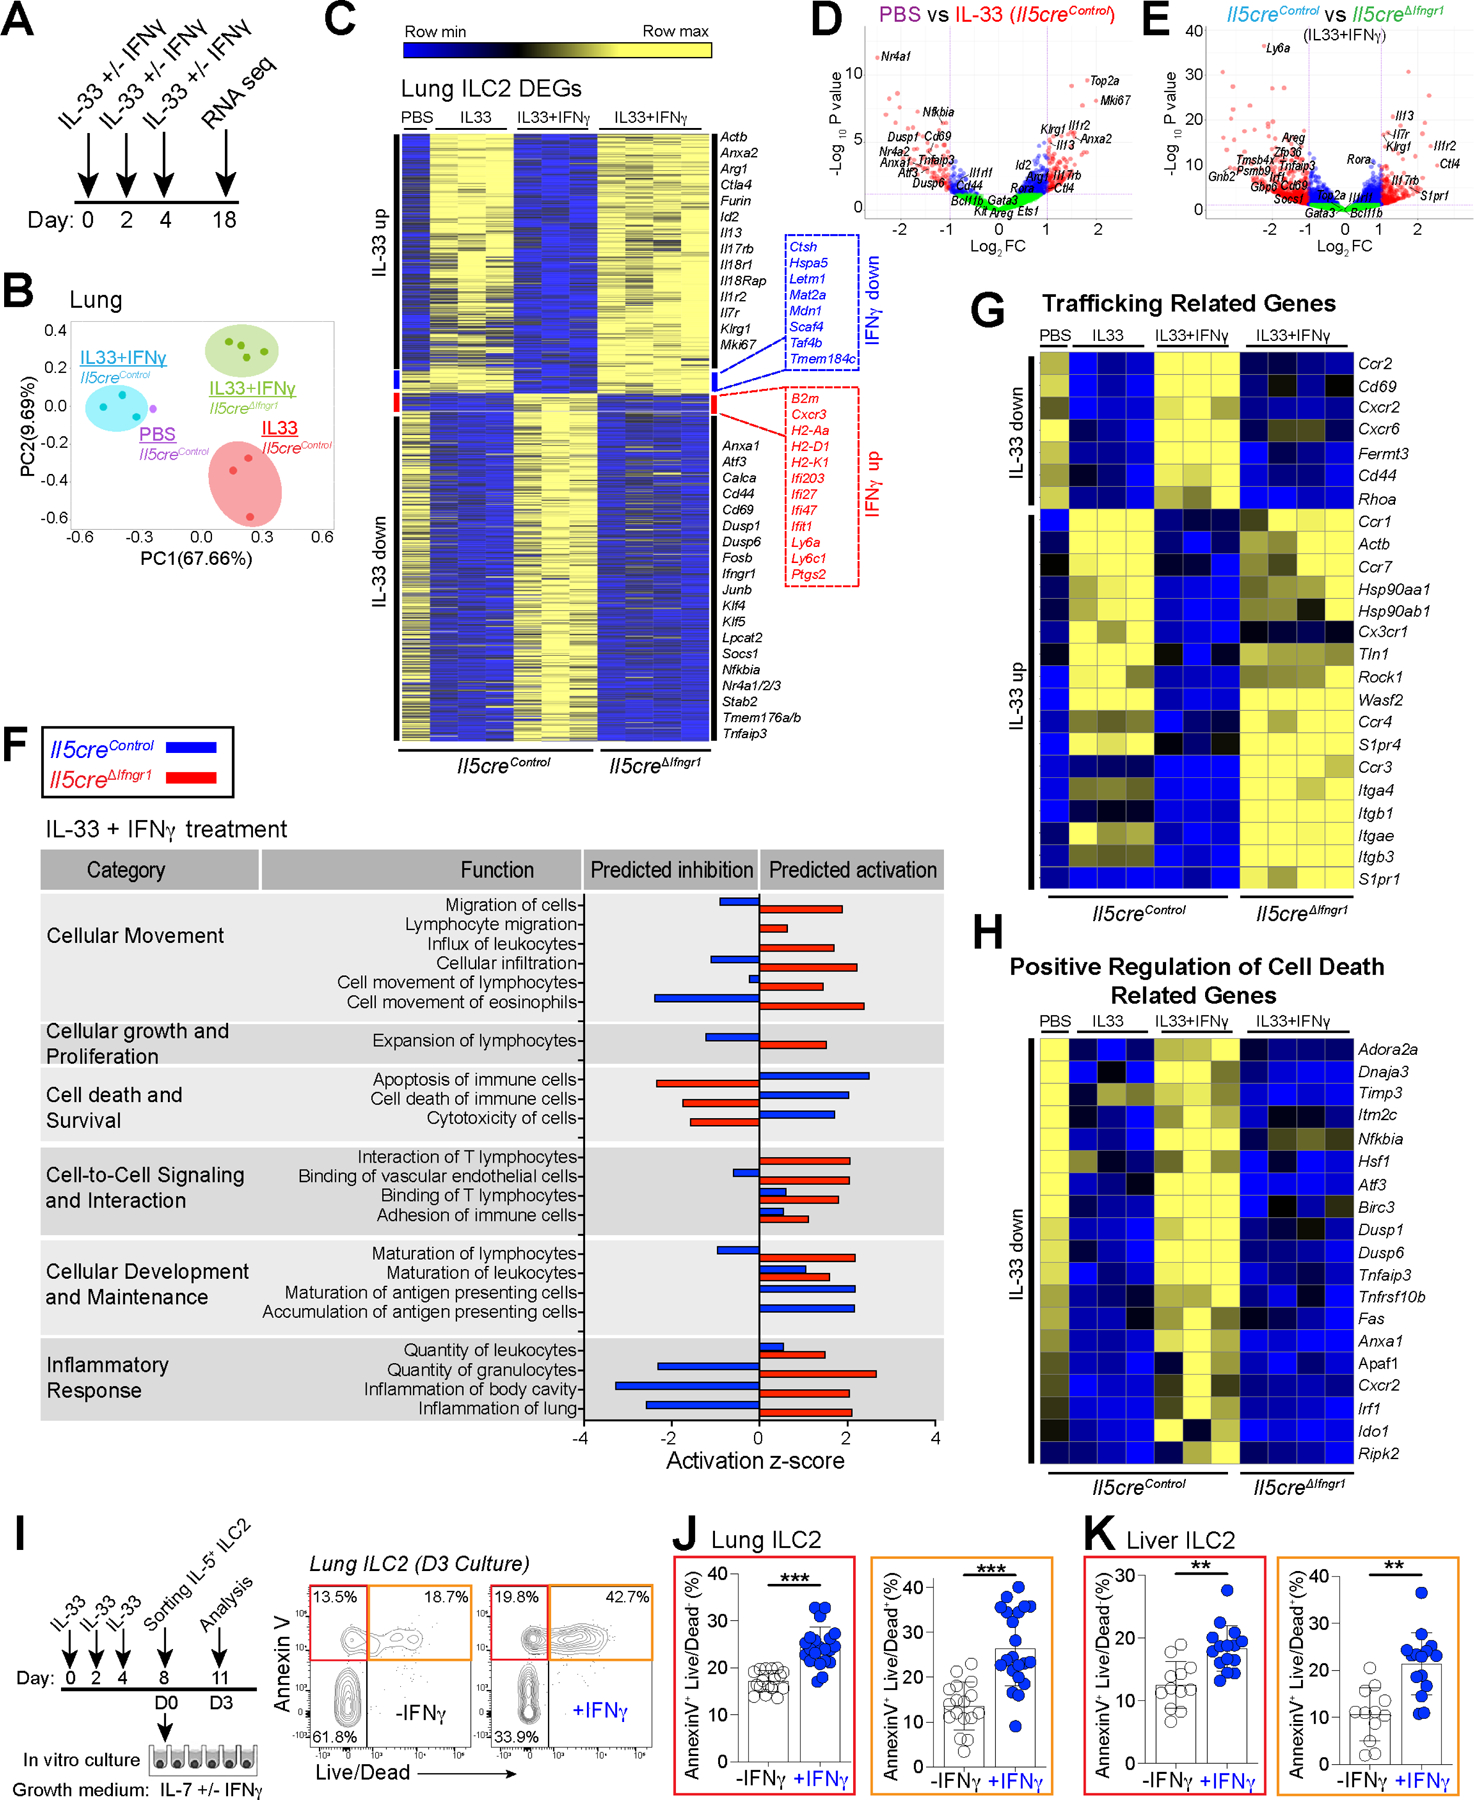
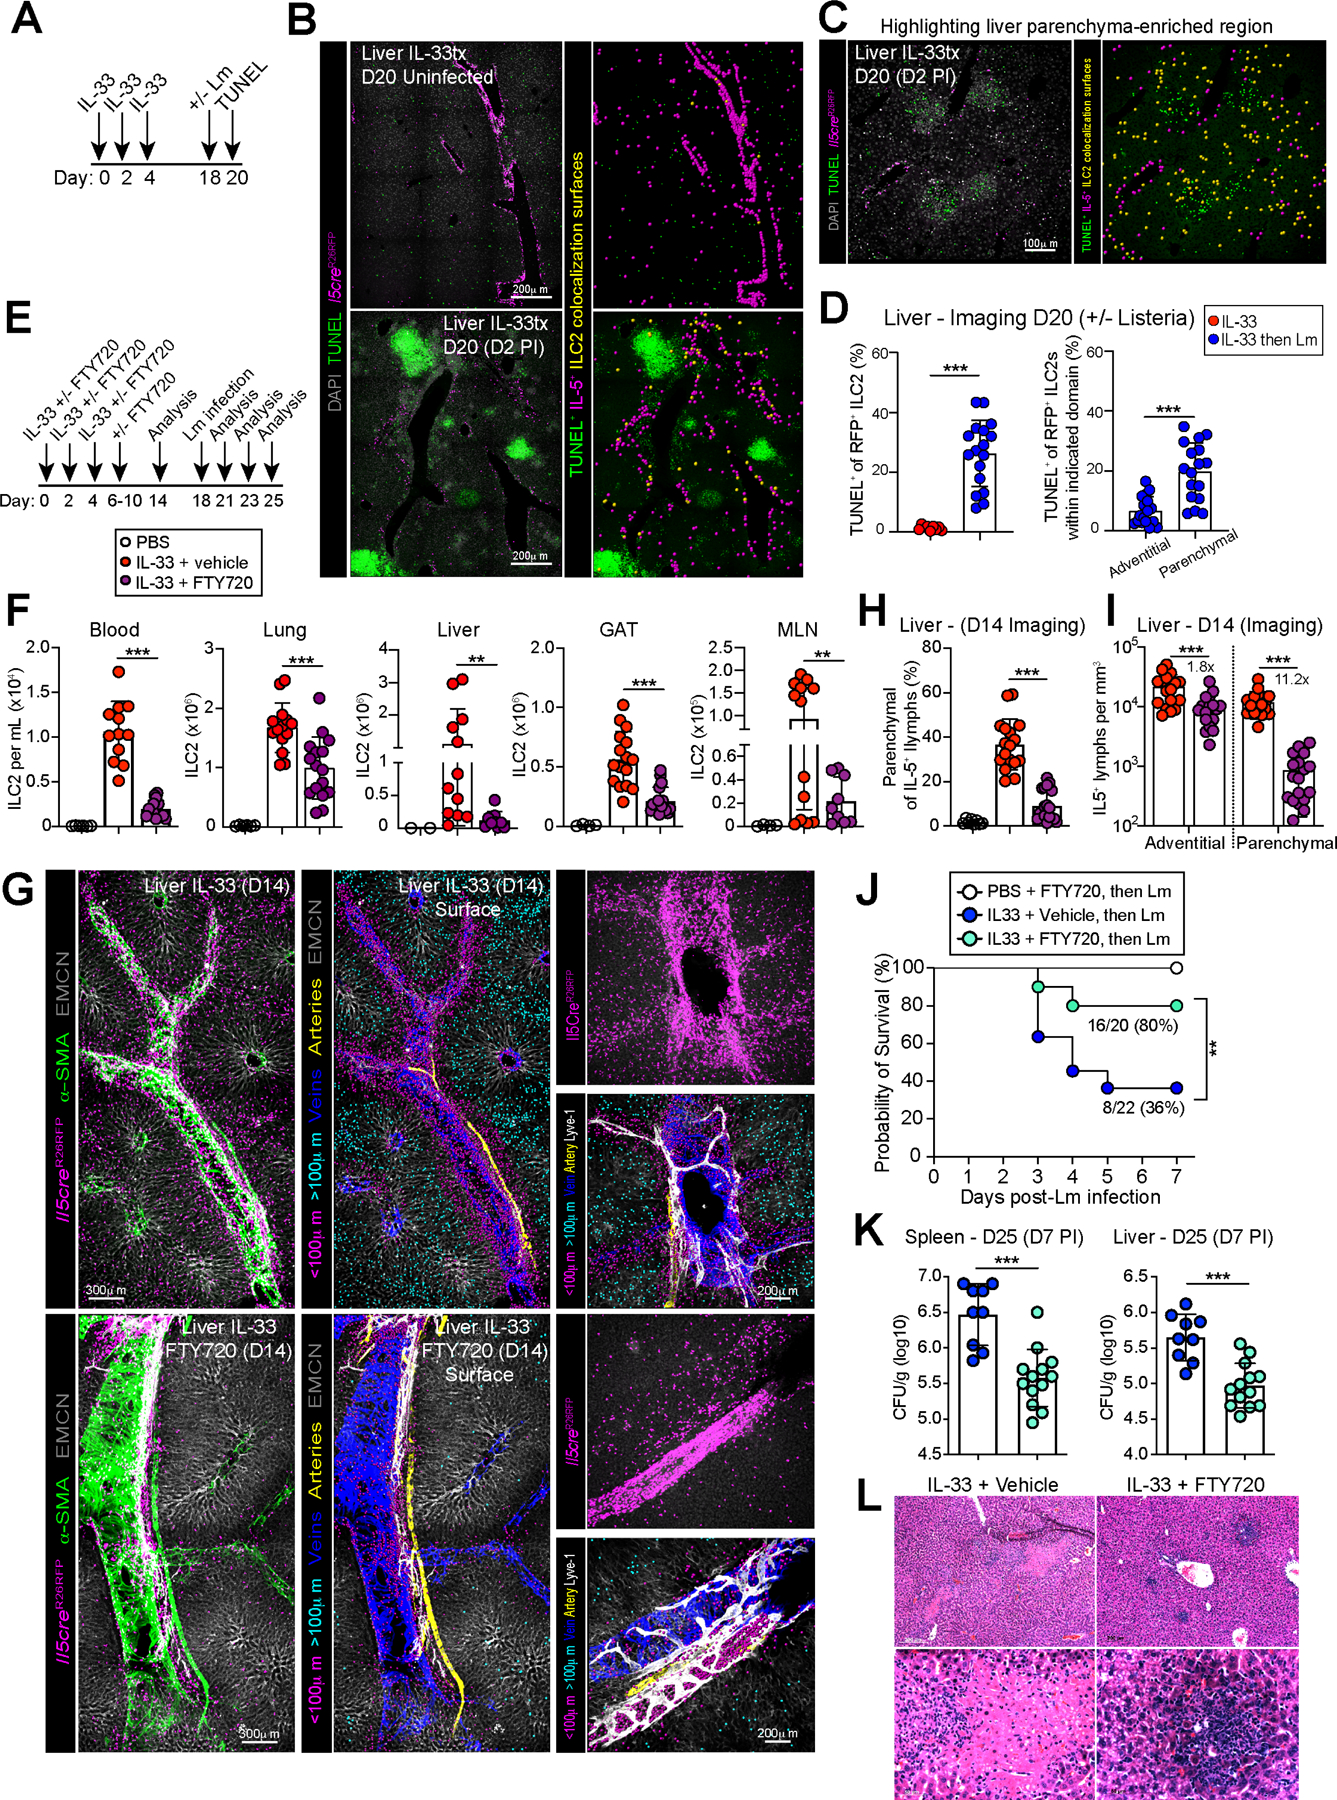
Allergic immunity is orchestrated by group 2 innate lymphoid cells (ILC2s) and type 2 helper T (Th2) cells prominently arrayed at epithelial- and microbial-rich barriers. However, ILC2s and Th2 cells are also present in fibroblast-rich niches within the adventitial layer of larger vessels and similar boundary structures in sterile deep tissues, and it remains unclear whether they undergo dynamic repositioning during immune perturbations. Here, we used thick-section quantitative imaging to show that allergic inflammation drives invasion of lung and liver non-adventitial parenchyma by ILC2s and Th2 cells. However, during concurrent type 1 and type 2 mixed inflammation, IFNγ from broadly distributed type 1 lymphocytes directly blocked both ILC2 parenchymal trafficking and subsequent cell survival. ILC2 and Th2 cell confinement to adventitia limited mortality by the type 1 pathogen Listeria monocytogenes. Our results suggest that the topography of tissue lymphocyte subsets is tightly regulated to promote appropriately timed and balanced immunity.

Keywords: 3D imaging; ILC2; Th2; allergic immunity; interferon gamma; lymphocyte niches; mixed inflammation; tissue immunology; type 2 immunity.


Conflict of interest statement

Declaration of interests The authors declare no competing interests.

Figures

Figure 1:
Figure 1:. IL-5+ type 2 lymphocytes expand in lung and liver parenchyma during type 2 inflammation.
(A) Schematics of lung topography highlighting adventitial (pink) and parenchymal (teal) domains. (B-D) Confocal imaging of lung thick-sections (left) or surface-rendered three-dimensional reconstruction (right) from IL-5+ T2L lineage tracker naïve mice, Nippostrongylus brasiliensis infected (Nb) at day 30 (D30) post-infection (PI), or IL-33 treated at D30 post treatment, as indicated. 3 independent experiments, total N=5–6 mice/group. (E-F, H-I) Quantitative analysis of lung and liver thick-section confocal images as percent parenchymal IL-5+ T2Ls of total IL-5+ T2Ls (E and H) or parenchymal IL-5+ T2L numbers per tissue volume (F and I). Pooled from 3 independent experiments, total N=5–6 mice/group. (G) Confocal imaging of liver thick-sections at resting, D30 PI with Nb and D30 post IL-33 treatment showing surface-rendered reconstruction, as described in B-D. (J-L) Confocal imaging of lung and liver sections at indicated days post IL-33 treatment showing surface-rendered 3D reconstruction, as described in B-D and quantitative imaging analysis (K-L) of parenchymal IL-5+ T2L accumulation as a percent of total IL-5+ T2L. Images and quantification from 2 independent experiments, total N=4–5 mice per time point. See also Figure S1.
Figure 2:
Figure 2:. IFNγ-producing type 1 lymphocytes restrict IL-5+ type 2 lymphocyte parenchymal expansion during mixed inflammatory challenges
(A) Schematic of the IfngYFP Yeti reporter mouse. (B and C) Confocal thick-section images from lung and liver of IfngYFP/+ mice with all Ifng-YFP+ cells (left, green) or with surfaces rendered (right) on adventitial cells (IFNγ+, green, <100μm from SMA) and parenchymal cells (IFNγ+, teal, >100μm from SMA). Images are representative of N=8 mice. (D and E) Quantitative imaging analysis of (D) lung and liver sections as percent parenchymal IFNγ+ T1Ls of total T1Ls or (E) total IFNγ+ T1Ls per volume from liver of IfngYFP/+ mice at rest (open white dots) and D7 post Listeria monocytogenes (Lm) infection (orange dots). Pooled from 2 independent experiments, total N=4 mice. (F) Confocal imaging and surfacing analysis of lung thick-sections of T1L-Yeti/T2L-lineage tracker mice infected with Nb and imaged at D30 PI. 2 independent experiments, total N=7 mice/group. (G and H) Quantitative imaging analysis of lung as (G) percent parenchymal IL-5+ T2Ls and (H) IL-5+ T2Ls per volume in thick lung sections from T1L-Yeti/T2L-lineage tracker mice (bars outlined in green), or littermate T2L-lineage tracker only mice (bars outlined in black) at D30 post Nb infection. Pooled from 2 independent experiments, total N=7 mice/group. (I and J) Confocal imaging of liver thick sections from IL-5 reporter mice (after the indicated challenges, showing native images and rendered surfaces of adventitial and parenchymal IL-5tdtomato+ T2Ls. 2 independent experiments, total N=6 mice/group. Bar graphs indicate mean (±SD), unpaired Student’s t test. See also Figure S2.
Figure 3:
Figure 3:. IFNγ directly restricts activated IL-5+ type 2 lymphocytes.
(A) Schematic of IL-5+ T2L IFNγ-blind conditional mouse strain (Il5creΔIfngr1) or littermate controls. (B and C) Flow histograms and mean fluorescence intensity (MFI) of IFNγR1 expression on resting lung ILC2s and other lung lymphocytes in control (white bars) and IL-5+ T2L IFNγ-blind (grey bars) mice. 2 independent experiments, total N=6 mice/ group. (D) Schematic showing IL33 +/− IFNγ administration schedule, relevant to E-J. (E and F) Flow cytometry of ILC2s or total ILCs expression of KLRG1, IL1RL1 (ST2), or IL-5RFP in lungs at D8. 3 independent experiments, N≥7 mouse/group. (G-J) Flow cytometry of ILC2 as (G) percent or (H) total number in lungs (I), gonadal adipose tissue (GAT), and (J) liver from the indicated mice treated with PBS (white dots), IL-33 in the absence (red dots) or presence (blue dots) of IFNγ. Pooled from 3 independent experiments, N≥7 mouse/group. (K) Schematic showing co-infection with Nippostrongylus brasiliensis followed by inoculation with Listeria monocytogenes, relevant to L-O. (L-O) Flow cytometry showing percent and numbers of ILC2 and Th2 cells at D15 PI. Pooled from 3 independent experiments, N≥6 mouse/group. (P and Q) Schematic of IL-33 treatment and flow analysis of ILC2s in lungs on D8 post PBS control (white dots) or IL-33 treatment (red dots) from the indicated strains, with mice on an IfngYFP/+ Yeti background (bars outlined in green). Pooled from 2 independent experiments, N≥8 mouse/group. (R-T) Schematic of Nb helminth infection with flow analysis of ILC2s and Th2 cells on D7 PI from the indicated mouse strains. Pooled from 2 independent experiments, N≥6 mouse/group. (U) Intestinal Nb larvae at D7 PI. Pooled from 2 independent experiments, N≥6 mouse/group. Bar graphs indicate mean (±SD), Two-Way ANOVA with Sidak post-test. See also Figure S3
Figure 4:
Figure 4:. IFNγ directly limits IL-5+ type 2 lymphocyte accumulation at parenchymal domains.
(A) Schematic of IL-33 treatment, relevant to B-D. (B) Flow cytometry showing percent of Ki-67+ ILC2. Pooled from 3 independent experiments, N≥ 8 mice per time point (C) Plasma IL-13 at the indicated time points. Pooled from 3 independent experiments, N≥ 6 mice per time point. (D) Flow cytometry showing blood ILC2s per mL (red) or percentages (black). Pooled from 3 independent experiments with N≥ 8 mice per time point. (E) Schematic of IL-33 treatment followed by infection with Lm on D18 post IL-33 treatment, relevant to F-H. (F and G) Flow cytometry quantitation of (F) liver ILC2s and (G) percent IL-13+ of ILC2s elicited upon in vitro restimulation on D25. Red dots indicate IL-33 treatment only and blue dots indicate mice with IL-33 treatment, then Lm infection. Pooled from 3 independent experiments, with N≥ 7 mice per group. (H) Confocal thick-section imaging, surface rendered and distance analysis for liver IL-5RFP+ T2Ls at D23 post initial IL-33 treatment, (D5 Lm PI). (I) Schematic of Nb s.c. infections, followed by Lm i.v. infection. Relevant to J-O. (J) Flow cytometry plots comparing IL-5+ ILC2 and IL-5+ Th2 cells after Nb infections or IL-33 treatment in IL-5+ T2L lineage tracker mice. 2 independent experiments, total N=6 mice/group. (K) Flow cytometry of IL-5+ ILC2 and IL-5+ Th2 cell numbers at D50 post Nbx2 (no Lm infected mice). Pooled from 3 independent experiments, N≥ 8 mice/group. (L) Flow cytometry quantitation of liver and blood ILC2s in T2L IFNγ-blind mice (grey bars) and controls, 4 days post Lm infection (D54). (M-O) Confocal images of liver thick sections (M) and (N and O) quantitation of IL-5+ lymphocyte localization. Pooled from 2 independent experiments, total N=5–6 mice/group. (P) Confocal imaging with distance analysis in livers from IfngYFP/+; Il5creΔIfngr1 mice and controls at D8 post IL-33 treatment. 2 independent experiments, total N≥4. Bar graphs indicate mean (±SD), Two-Way ANOVA with Sidak post-test for F and unpaired t test for G, K, L, N, O. See also Figure S4
Figure 5:
Figure 5:. IFNγ directly acts on IL-5+ type 2 lymphocytes to restrict morbidity and mortality of Listeria infection during mixed inflammation.
(A-B) Schematic of IL-33 treatment then infection with Lm (relevant to A-F) and colony forming units (CFUs) from (A) liver and (B) spleen. Pooled from 3 independent experiments, N≥8 mice. (C) Survival curves after Lm infection. Pooled from 3 independent experiments with N=28 mice for Il5creΔIfngr1; PBS tx, N=36 for Il5creΔIfngr1; IL-33 tx and, N=36 for Il5creControl; IL-33 tx. (D) H&E staining of 7μm paraffin liver sections at D7 post Lm. 3 independent experiments, N=6 mice/group. (E and F) Granuloma numbers and size in 10X magnification fields. Pooled from 3 independent experiments, total N=6 mice/group. (G-I) Schematic of Nb infections, followed by Lm infection. Analysis of (H) liver CFUs at D5 PI and (I) Survival curves. Orange dots indicate mice infected with Lm, blue dots indicate mice infected with 2 rounds of Nb, then Lm infection. Pooled from 3 independent experiments, total N≥10/group. (J-L) Schematic of the treatment regimen with neutralizing antibodies (teal dots) i.v injected into Il5creΔIfngr1 mice pre-treated with IL-33, then infected with Lm. (K) liver CFUs at D5 and D7 PI and (L) Survival curves (N=22 mice with neutralizing Abs, N=23 mice with isotypes Abs). Pooled from 2 independent experiments. Bar graphs indicate mean (±SD), two-way ANOVA followed by Dunnett test for A, B. Kaplan-Meier survival curves are compared using the log-rank (Mantel-Cox) analysis, for C, I, L. Students t test for E, F, H and K. See also Figure S5
Figure 6:
Figure 6:. ILC2 lung transcriptome induced by IL-33 and repressed by IFNγ includes programs for cellular trafficking and regulation of cell death.
(A) Schematic of mouse treatment regimen and flow sorting of IL-5RFP+ ILC2s. (B) Principal component analysis (PCA) plots. (C) Heat map of differentially expressed genes (DEGs) in lung ILC2s highlighting genes for IL-33 induced (top), IFNγ-repressed (blue), IFNγ-activated (red), and IL-33 repressed (bottom) (D and E) Volcano plots comparing (D) Il5control mice treated with PBS or IL-33 or (E) Il5creControl or Il5creΔIfngr1 mice both treated with IL-33 + IFNγ, with signature genes highlighted in red regions and borderline significance in blue. (F) Pathway analysis (IPA) of mice treated with IL33 + IFNγ comparing Il5creControl versus Il5creΔIfngr1 mice. (G-H) Heatmaps of differentially expressed trafficking-related and cell-death related genes highlighted after IPA analysis. (I-K) Schematic of in vivo ILC2 expansion and in vitro cell culture conditions to evaluate IFNγ-mediated cell death. Percentages of annexin V versus live/dead cell subsets. 3 independent experiments. Bar graphs indicate mean (±SD), unpaired Student’s t-test with welch’s correction. See also Figure S6.
Figure 7:
Figure 7:. S1P-mediated trafficking and IL-5+ lymphocyte cell death impact parenchymal accumulation and Listeria associated morbidity and mortality.
(A) Schematic of mouse treatment regimen for TUNEL cell death assay after Lm infection. (B) Paraffin-embedded sections of livers from Lm infected IL-5 lineage tracker mice (D2 PI) assessed by TUNEL staining and surfacing analysis for TUNEL and IL-5 colocalization (yellow spots) at adventitial and (C) parenchymal domains with (D) imaging quantification. 3 independent experiments, N=7 mice/group. (E) Schematic of mouse treatment with IL-33 ± FTY720 ± infection with or without Lm on D18. Relevant to F-L (F) Flow cytometry of ILC2s in multiple tissues on D14. Pooled data from 3 independent experiments, total N≥12 mouse/group. (G) Confocal thick-section imaging, surfaces rendered and distance analysis for adventitial and parenchymal IL-5+ T2Ls in livers at D14. 3 independent experiments, total N≥6 mouse/group. (H and I) Imaging quantification as percent parenchymal IL-5+ T2Ls of total IL-5+ T2Ls or parenchymal IL-5+ T2L numbers per tissue volume. 3 independent experiments, total N≥6 mouse/group. (J) Survival curves after Lm infection. Data pooled from 3 independent experiments, N=20 or n=22 mice for Il5creΔIfngr1 treated with or without FTY720, respectively. (K) Lm CFUs on day 25 (D7 PI) from spleen and liver of Il5creΔIFNγR1 mice pre-treated with IL-33 with (teal dots) or without FTY720 (blue dots). Data pooled from three independent experiments, total N≥ 8 mice/ group. (L) H&E staining of paraffin liver sections at D7 post Lm infection. 3 independent experiments, total N=6 mice/group. Bar graphs indicate mean (±SD). Unpaired t test with Welch’s correction for F, H, I, K. Kaplan-Meier survival curves are compared using the log-rank (Mantel-Cox) analysis. See also Figure S7.

Comment in

References

    1. Ajendra J, Chenery AL, Parkinson JE, Chan BHK, Pearson S, Colombo SAP, Boon L, Grencis RK, Sutherland TE, and Allen JE (2020). IL-17A both initiates, via IFNγ suppression, and limits the pulmonary type-2 immune response to nematode infection. Mucosal Immunol. 13, 958–968. - PMC - PubMed
    1. Allen JE, and Sutherland TE (2014). Host protective roles of type 2 immunity: Parasite killing and tissue repair, flip sides of the same coin. Semin. Immunol. 26, 329–340. - PMC - PubMed
    1. Anderson KG, Mayer-Barber K, Sung H, Beura L, James BR, Taylor JJ, Qunaj L, Griffith TS, Vezys V, Barber DL, et al. (2014). Intravascular staining for discrimination of vascular and tissue leukocytes. Nat. Protoc. 9, 209–222. - PMC - PubMed
    1. Beura LK, Mitchell JS, Thompson EA, Schenkel JM, Mohammed J, Wijeyesinghe S, Fonseca R, Burbach BJ, Hickman HD, Vezys V, et al. (2018). Intravital mucosal imaging of CD8+ resident memory T cells shows tissue-autonomous recall responses that amplify secondary memory article. Nat. Immunol. 19, 173–182. - PMC - PubMed
    1. Bi J, Cui L, Yu G, Yang X, Chen Y, and Wan X (2017). NK Cells Alleviate Lung Inflammation by Negatively Regulating Group 2 Innate Lymphoid Cells. J. Immunol. 198, 3336–3344. - PubMed

Publication types

MeSH terms