. 2022 Feb 8;55(2):324-340.e8.
doi: 10.1016/j.immuni.2022.01.006.

Tryptophan-derived microbial metabolites activate the aryl hydrocarbon receptor in tumor-associated macrophages to suppress anti-tumor immunity

Affiliations

Tryptophan-derived microbial metabolites activate the aryl hydrocarbon receptor in tumor-associated macrophages to suppress anti-tumor immunity

Kebria Hezaveh et al. Immunity. .

Abstract

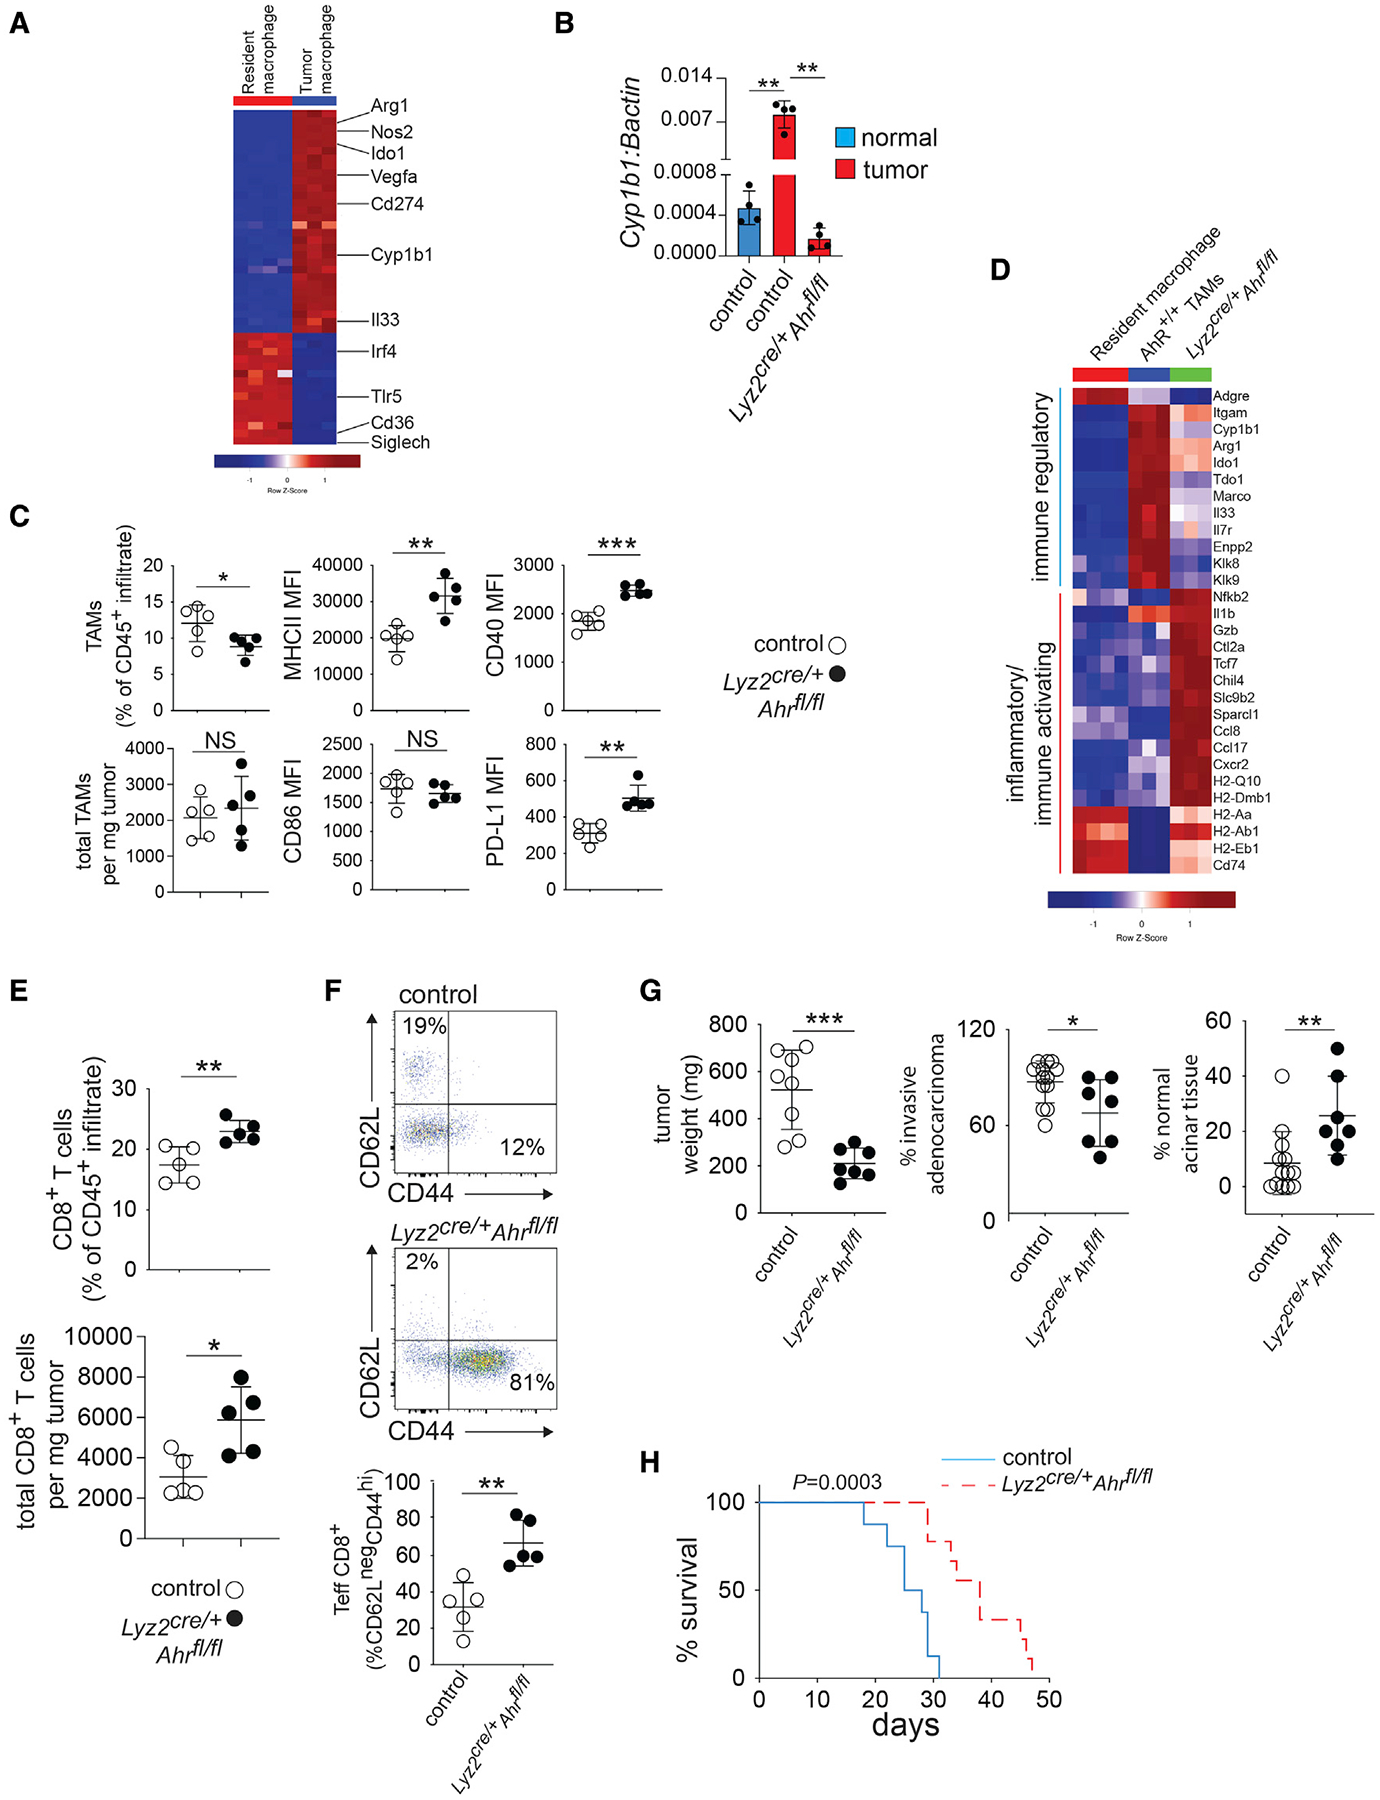
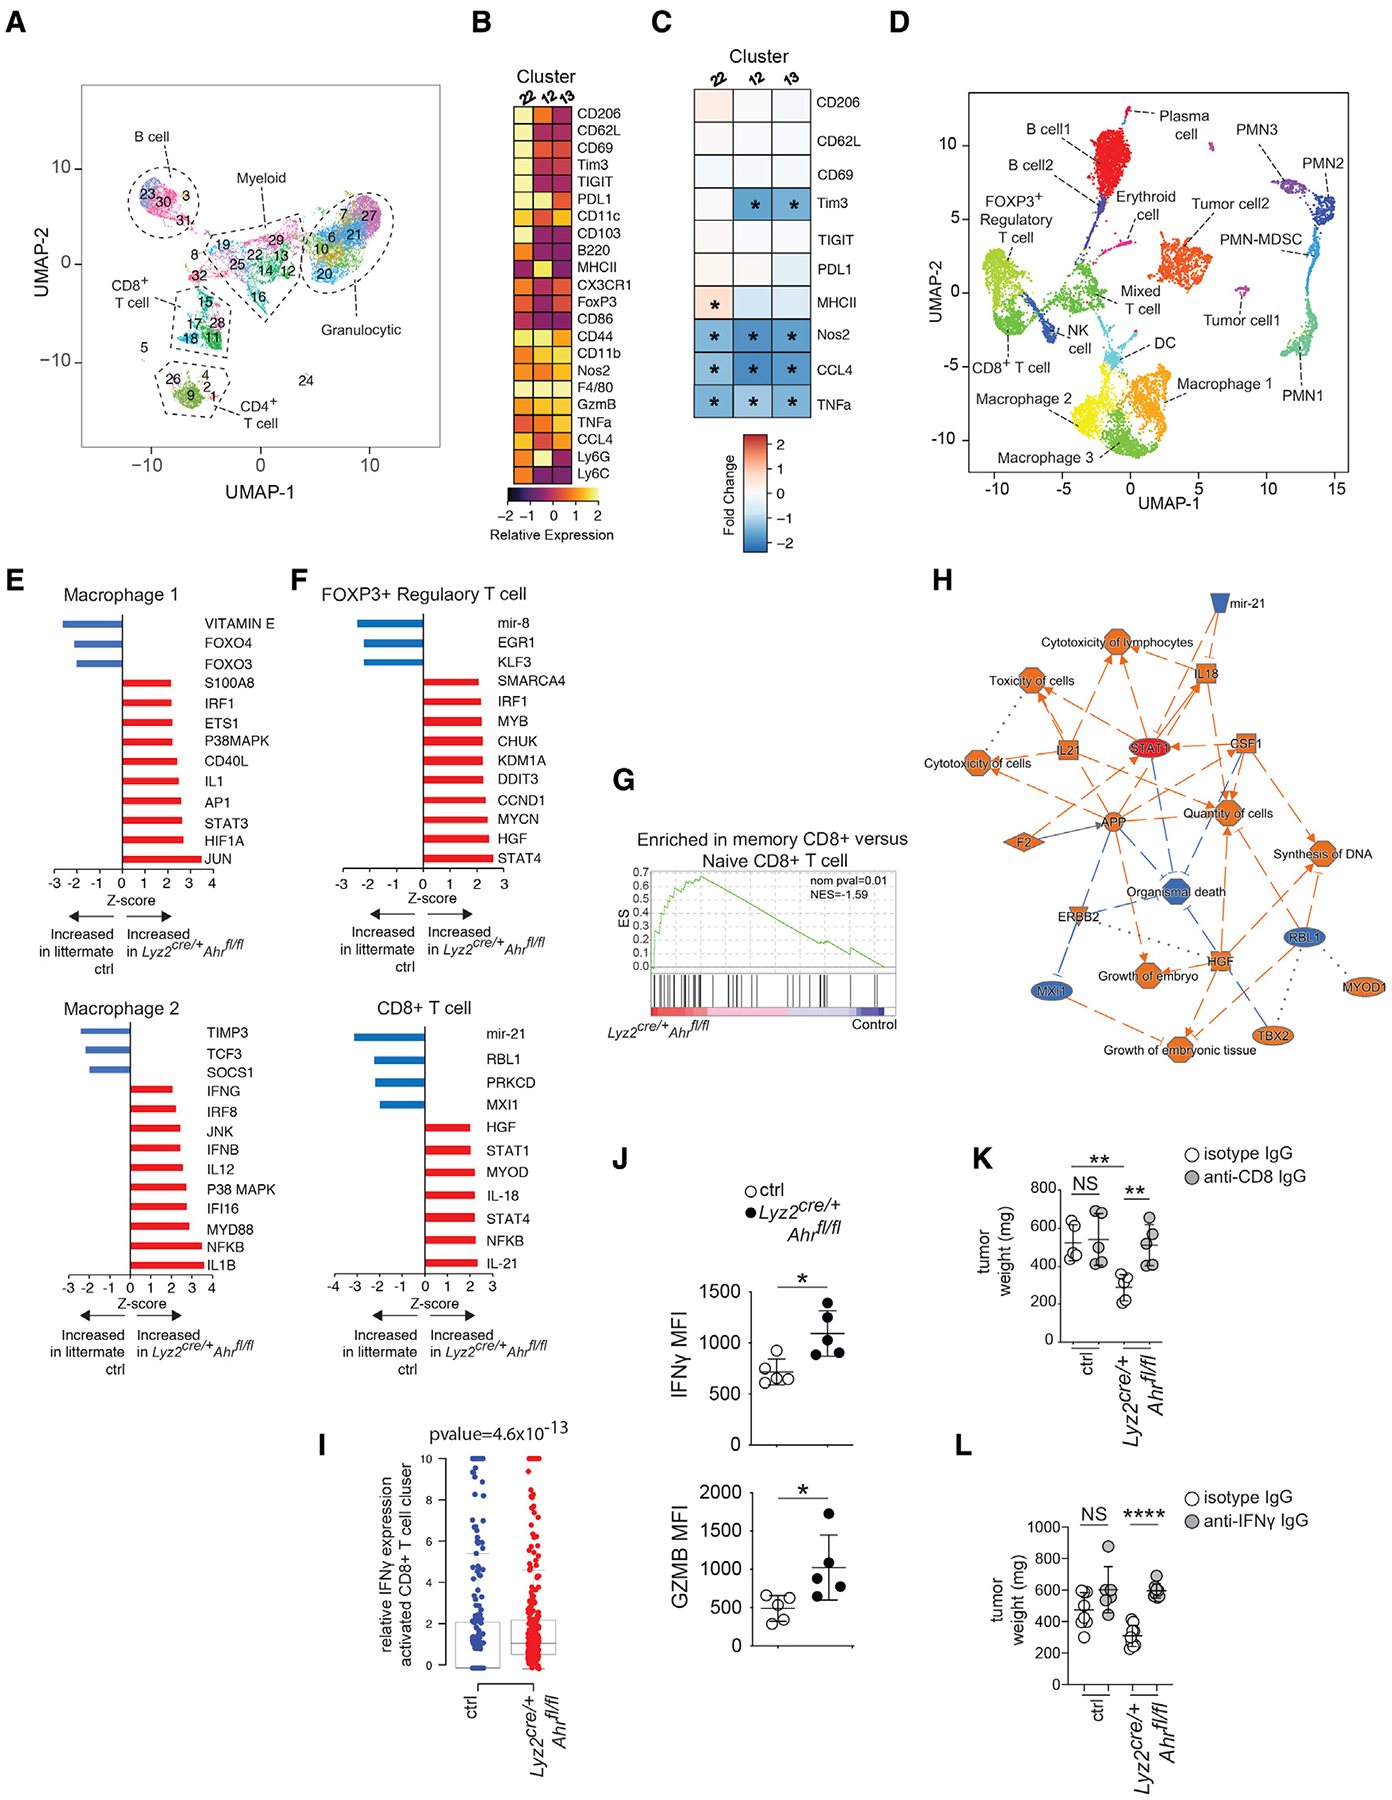
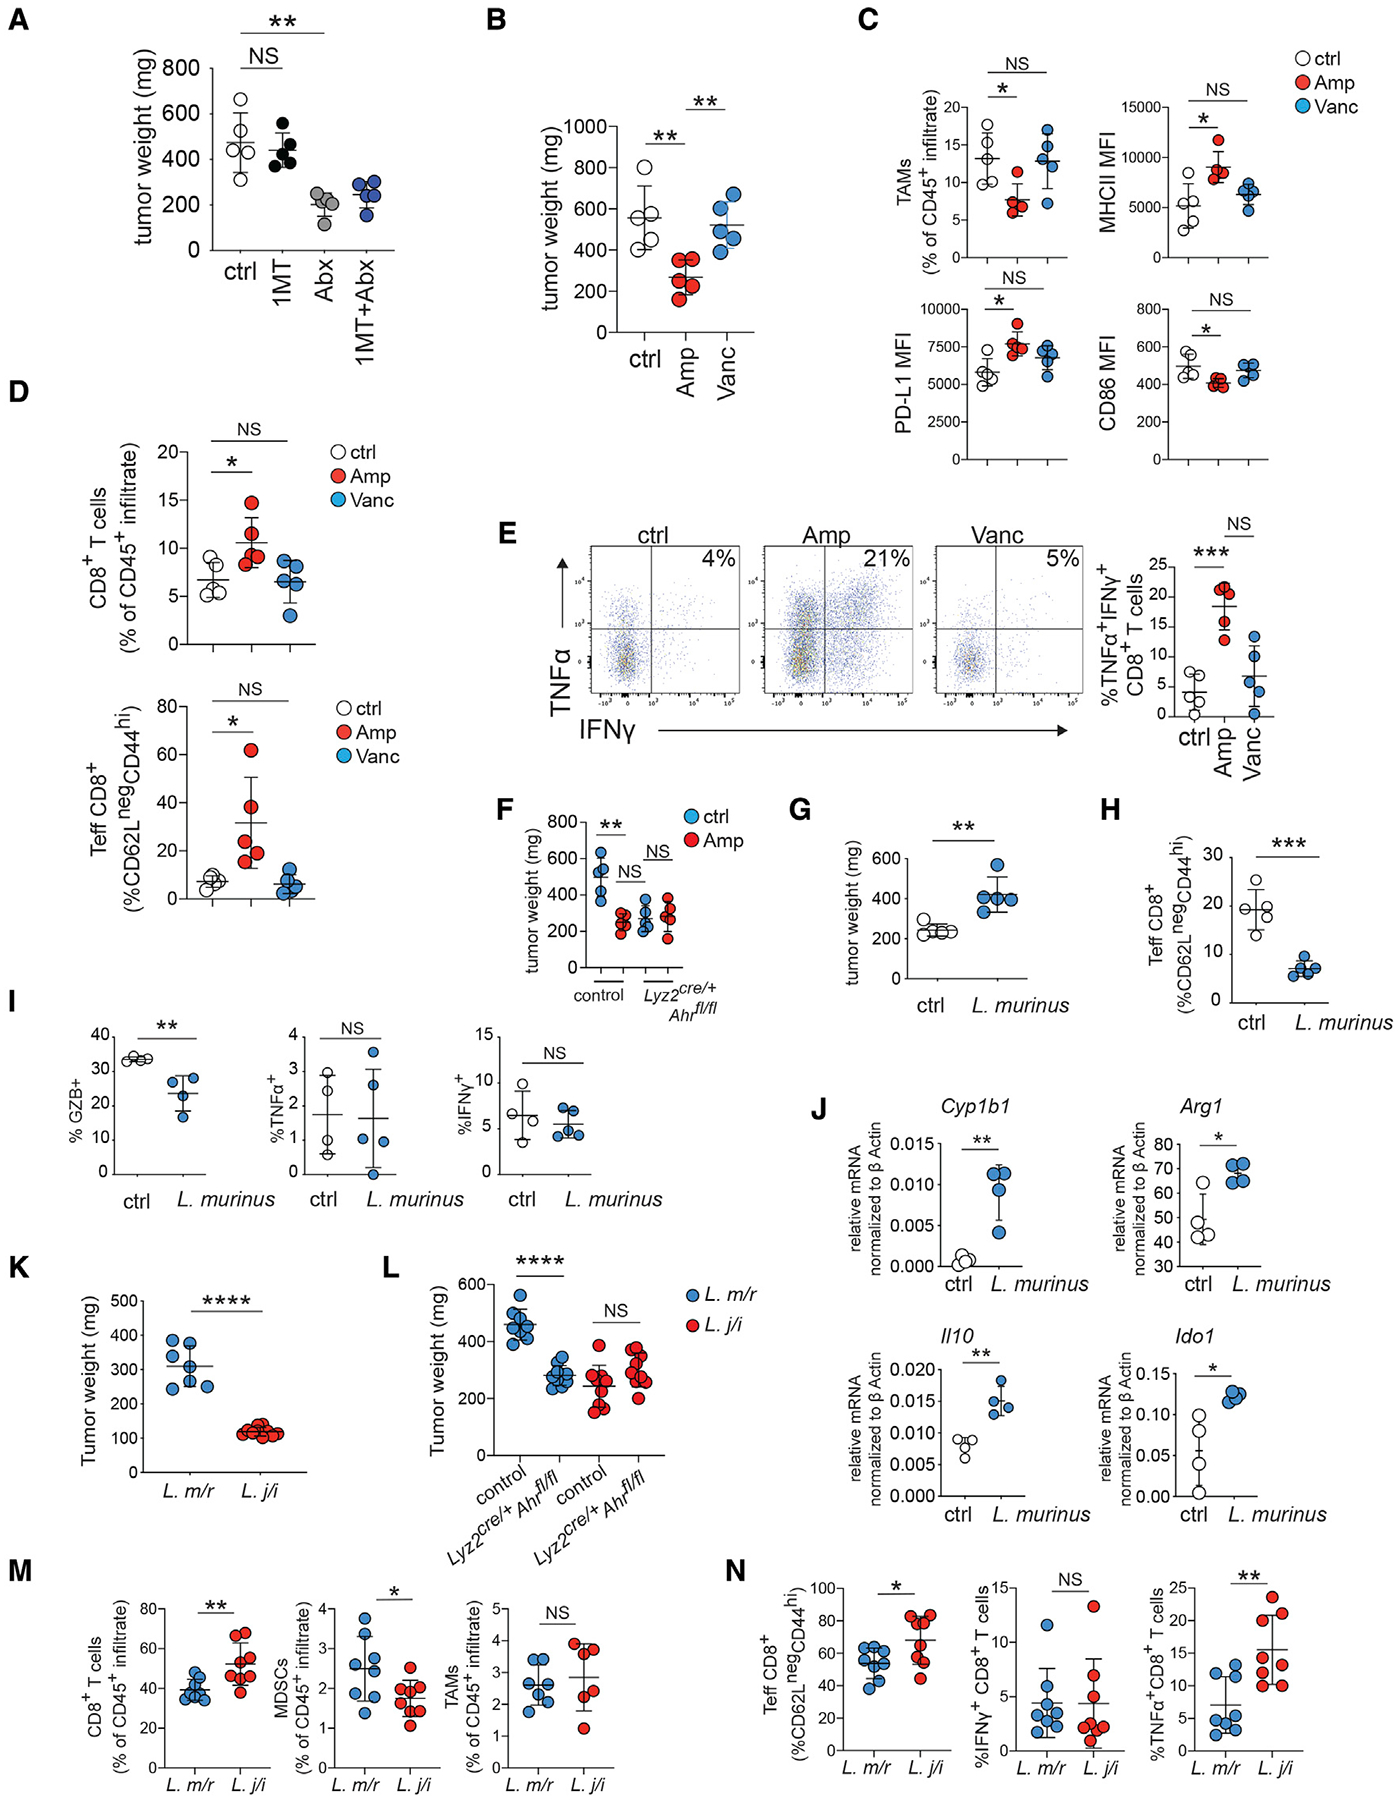
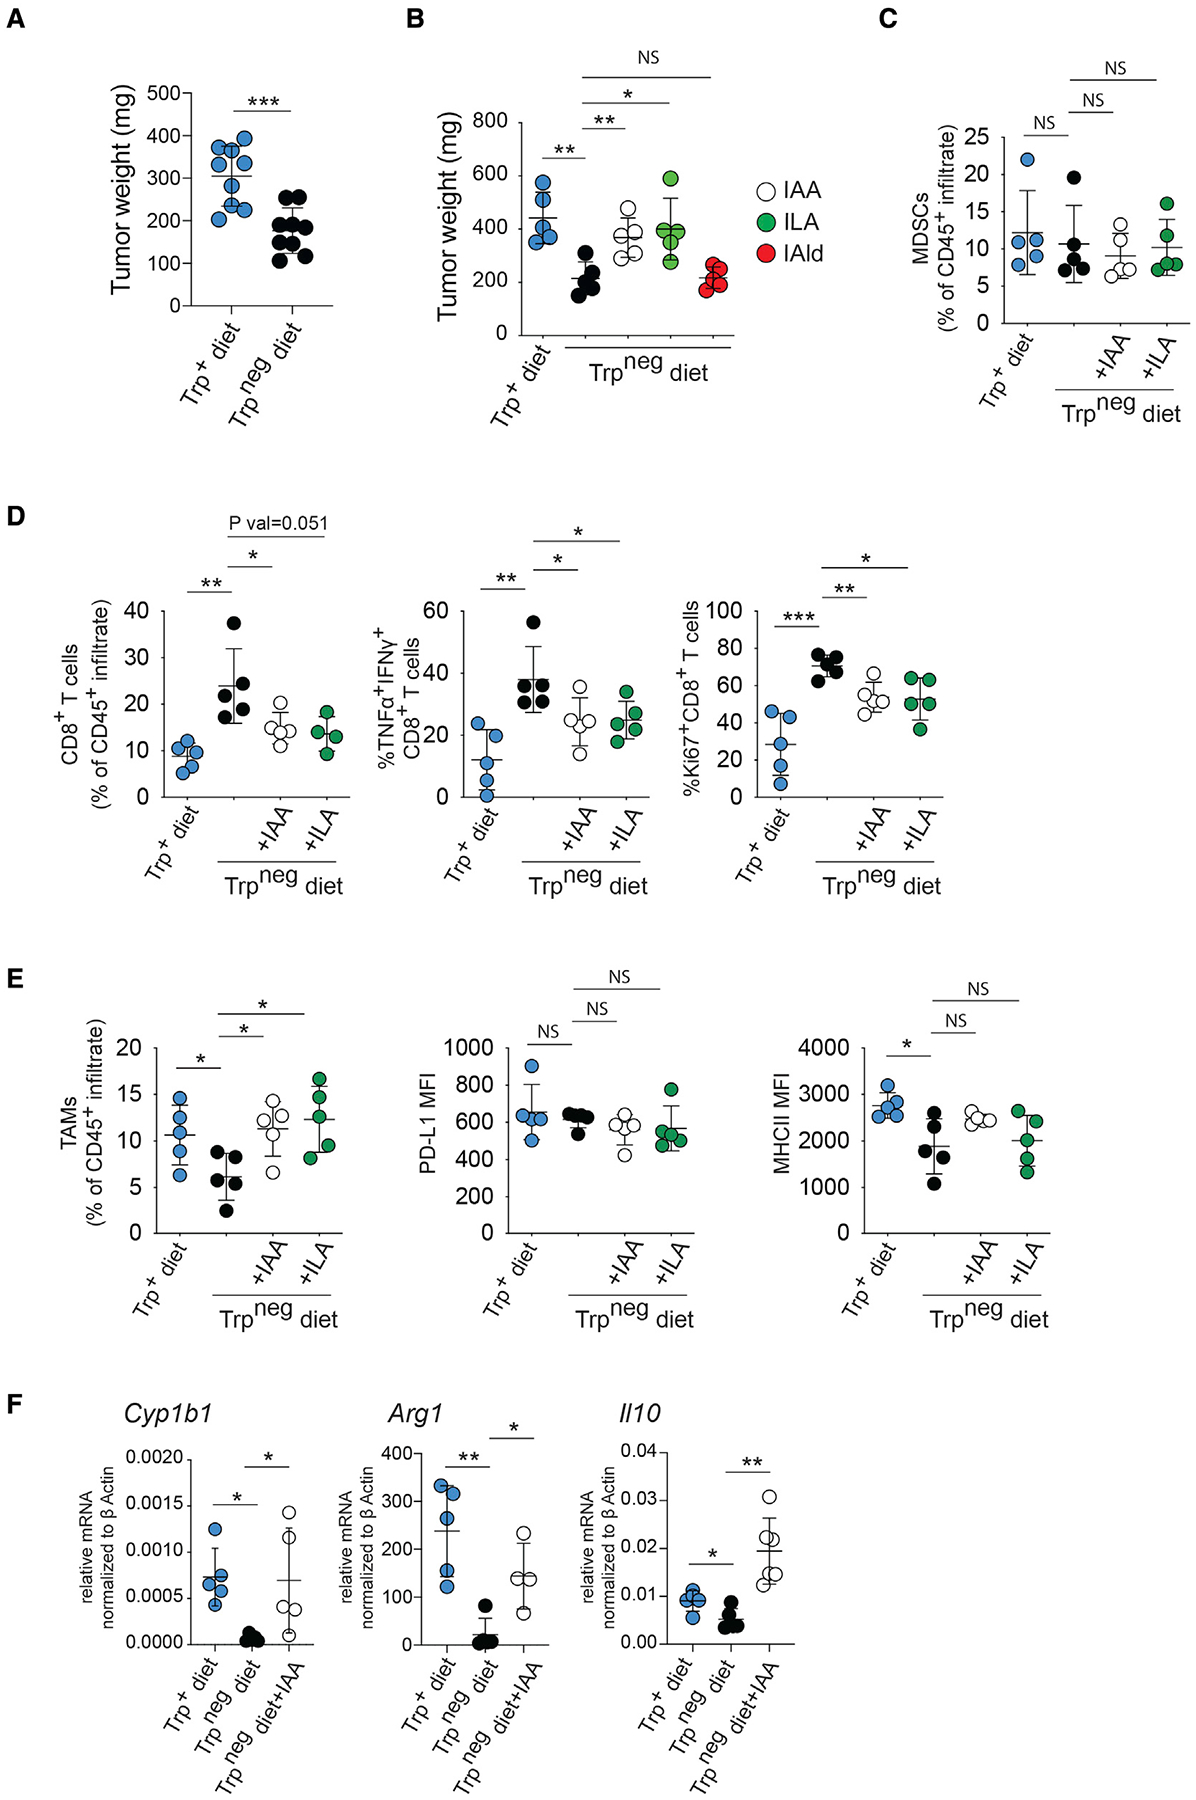
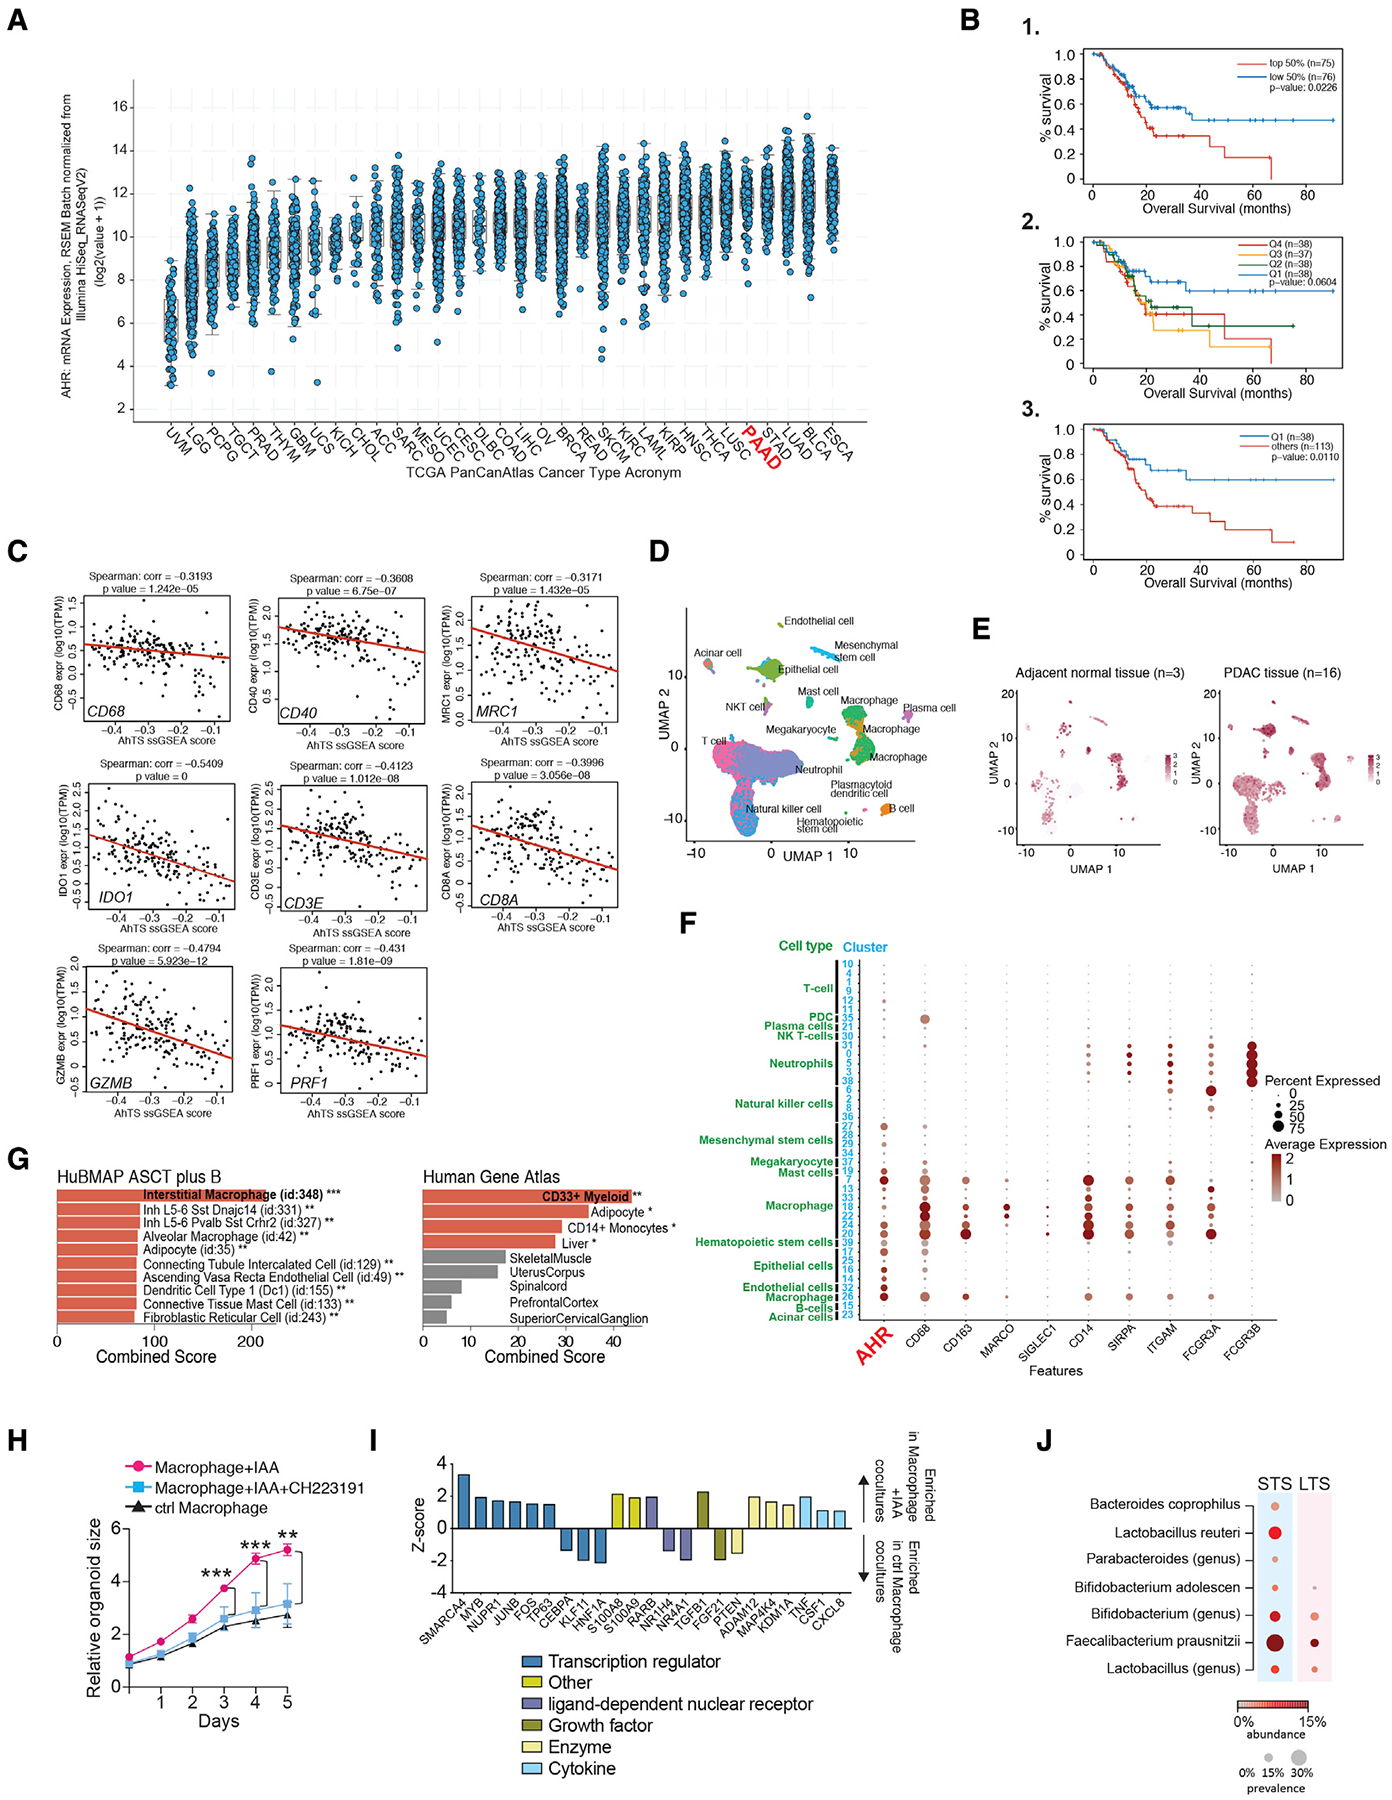
The aryl hydrocarbon receptor (AhR) is a sensor of products of tryptophan metabolism and a potent modulator of immunity. Here, we examined the impact of AhR in tumor-associated macrophage (TAM) function in pancreatic ductal adenocarcinoma (PDAC). TAMs exhibited high AhR activity and Ahr-deficient macrophages developed an inflammatory phenotype. Deletion of Ahr in myeloid cells or pharmacologic inhibition of AhR reduced PDAC growth, improved efficacy of immune checkpoint blockade, and increased intra-tumoral frequencies of IFNγ+CD8+ T cells. Macrophage tryptophan metabolism was not required for this effect. Rather, macrophage AhR activity was dependent on Lactobacillus metabolization of dietary tryptophan to indoles. Removal of dietary tryptophan reduced TAM AhR activity and promoted intra-tumoral accumulation of TNFα+IFNγ+CD8+ T cells; provision of dietary indoles blocked this effect. In patients with PDAC, high AHR expression associated with rapid disease progression and mortality, as well as with an immune-suppressive TAM phenotype, suggesting conservation of this regulatory axis in human disease.

Keywords: T cells; aryl hydrocarbon receptor; immune suppression; immunotherapy; indoles; macrophage; metabolism; microbiome; pancreatic cancer; tumor microenvironment.


Conflict of interest statement

Declaration of interests The authors have no conflicting interests to declare.

Figures

Figure 1.
Figure 1.. Deletion of AhR in macrophages drives inflammatory polarization of TAMs and CD8+ T cells in the PDAC TME
(A) CD45+CD11b+F4/80+ macrophages were enriched by flow cytometry sorting from normal pancreas (i.e., resident macrophages) or PDAC tumors 14 days after tumor implantation. Heatmap shows hierarchical clustering depicting differentially expressed RNA transcripts (>2.0 logFC, FDR p < 0.01). Each column represents an individual mouse. (B) Macrophages were sorted from normal pancreas or tumors from mice of the indicated genotype, and mRNA expression of Cyp1b1 relative to βactin was determined by qRT-PCR. (C) Expression of surface markers in TAMs from tumor-bearing mice of the indicated genotype were determined by flow cytometry. MFI, mean fluorescence intensity. (D) Heatmaps showing differential expression (FDR, <0.01; logFC, >1) of selected inflammatory or immune-regulatory markers in FACS-sorted TAMs and healthy tissue macrophages as described in (A and B). (E) Intra-tumoral CD3+CD8+ T cell numbers as a percent of the CD45+ immune infiltrate were determined by flow cytometry in d14 tumors in Lyz2cre/+Ahrfl/fl versus control tumor-bearing mice. (F) Percent of CD44- and CD62L-positive intra-tumoral CD8+ T cells from samples described in (E) was determined by flow cytometry. (G) Day-14 tumor weight and pathology in mice of the indicated genotype. (H) Survival curves for tumor-bearing mice of the indicated genotype. n = 8 mice per group. (see also Figure S1). * p <.05, ** p <.01, *** p <.001.
Figure 2.
Figure 2.. Pharmacologic inhibition of AhR promotes inflammation in the TME and improves responses to immune therapy
(A) CD45+CD11b+F4/80+ TAMs were analyzed by flow cytometry in d14 tumors from B6 mice +/− treatment with the AhR inhibitor CH223191 as described in STAR Methods. MFI, mean fluorescence intensity. (B) Tumor infiltrating CD3+CD8+ T cells were analyzed from mice described in (A) by flow cytometry. GZMB-granzyme B. (C) Tumor weight of d14 tumors from mice described in (A). (D) D14 tumor weight from mice of the indicated genotype +/− CH223191 treatment as described in (A). (E) Representative Western blot showing loss of AhR expression in mT4 cell clone transfected with control versus AhR guide RNA. (F) Cyp1a1 quantification by qRT-PCR of control and mT4 cultures treated with the AhR agonists ITE and FICZ. (G) B6 mice were orthotopically implanted with the indicated mT4 clones +/− CH223191 beginning 4 days after implantation. Weights are shown for d14 tumors. (H) Survival curves of mice treated with AhR antagonist, anti-PD-L1 blockade, or a combination of the two versus controls. n = 10 mice per group. (I) Survival curves of iKPC mice treated with AhR antagonist versus controls 12 weeks post-tamoxifen treatment. n = 14 mice per group. * p <.05, ** p <.01, ***, NS-not significant.
Figure 3.
Figure 3.. Macrophage AhR activity shapes the immune transcriptional landscape in PDAC
(A) UMAP and phenograph analysis of the CD45+ infiltrate in d14 PDAC tumors showing the major immune subpopulations identified by CyTOF analysis. Data from 4 (control) or 5 (Lyz2cre/+Ahrfl/fl) biological replicates were concatenated in the plots. (B) Heatmap depicting relative expression of the indicated markers in d14 tumors of Lyz2cre/+Ahrfl/fl-tumor-bearing mice versus controls for the 3 F4/80+ macrophage clusters (Cluster 12, 13, and 22). (C) Heatmap showing relative expression of indicated markers in each TAM cluster in Lyz2cre/+Ahrfl/f versus control determined by CyTOF. Red squares indicate increased expression compared with control baseline, whereas blue squares indicate decreased expression relative to control baseline. (D) UMAP showing scRNA-seq data of pooled whole day-14 tumor samples for both Lyz2cre/+Ahrfl/fl and control tumors. n = 3 mice per group. PMN- poly morphonuclear leukocyte. (E) iGSEA analysis of the macrophage clusters 1 and 2 for enrichment of genes associated with the indicated pathways. (F) iGSEA analysis of the clusters FOXP3+ regulatory T cell and CD8+ T cell for enrichment of genes associated with the indicated pathways. (G) GSEA plot of CD8+ T cell cluster for enrichment of genes associated with memory CD8+ T cell differentiation was done with MSigDB (C7) ES = enrichment score. (H) Summary network analysis of scRNA-seq data for the activated CD8+ T cell cluster showing the interactions between upstream regulators, downstream genes, and physiological functions of activated CD8+ T cells. Red symbols/lines indicate activation, whereas blue ones indicate inhibition. (I) Relative IFNγ single-cell gene expression in the activated CD8+ T cells cluster. (J) Mean fluorescence intensity of IFNγ (left) and granzyme B (right) in Lyz2cre/+Ahrfl/fl and control CD8+ T cells from day-14 tumors as determined by flow cytometry. (K and L) Effect of CD8+ T cell depletion (K) or IFNγ blockade (L) on PDAC tumor weight in Lyz2cre/+Ahrfl/fl and control tumor-bearing mice. Tumors were collected at day 14. (see also Figure S2). * p <.05, ** p <.01, **** p <.0001, NS- not significant.
Figure 4.
Figure 4.. Indole-producing microbiota drive immune suppression in the TME
(A) B6 pancreatic tumor-bearing mice were treated with D1MT or broad-spectrum antibiotics. Tumor weight was determined 14 days after implantation. (B) Tumor-bearing B6 mice were placed on drinking water containing the indicated antibiotic as described in STAR Methods. Tumor weight was determined 14 days after implantation. (C) CD45+CD11b+F4/80+ TAMs from the tumors in (B) were analyzed for the indicated markers by flow cytometry. (D) CD3+CD8+ T cells from the tumors in (B) were analyzed for the indicated markers by flow cytometry. (E) Percentage of tumor infiltrating CD3+CD8+ T cells, expressing IFNγ and TNFα from the tumors in (B) was determined by flow cytometry. Plots to the left are representative pseudocolor dot plots from each group gated on CD3+CD8+ T cells. (F) Tumor-bearing B6 mice of the indicated genotype were placed on drinking water containing ampicillin (Amp) as described in (B) and tumor weight was determined 14 days after implantation. (G) Day-14 tumor weight in germ-free mice with a L. murinus microbiome compared with controls. (H and I) Total effector CD8+ T cells (CD62LloCD44hi) as a percentage of the CD45+ infiltrate (H) and the percentage of CD3+CD8+ T cells expressing granzyme B (GZB), TNFα, and IFNγ (I) was determined by flow cytometry in day-14 tumors in inoculated versus control germ-free tumor-bearing mice. (J) CD45+CD11b+F4/80+ TAMs were sorted from day-14 tumors from germ-free B6 mice +/−, an L. murinus microbiome. The mRNA indicated were measured by q-rtPCR and normalized against Bactin as described in STAR Methods. (K and L) Day-14 tumor weight from B6 mice (J) or Lyz2cre/+Ahrfl/fl mice or littermate controls (L) with a microbiome containing L. murinus+L. reuteri (L. m/r) or L. johnsonii+L. intestinalis (L. j/i). (M) Percent of intra-tumoral CD8+ T cells, CD11b+GR1+MHCIIlo MDSCs, and CD11b+F4/80+ TAMs in the CD45+ infiltrate of tumors from (J) was determined by flow cytometry. (N) Percentage of Teff, IFNγ+, and TFNα+ CD8+ T cells from tumors described in (J) was determined by flow cytometry. (see also Figure S3). * p <.05, ** p <.01, *** p <.001, **** p <.0001, NS- not significant.
Figure 5.
Figure 5.. Dietary Trp and indoles promote immune suppression and PDAC growth
(A) Day-14 PDAC tumor weight in mice on control or Trp-free diet. (B) Day-14 tumor size in B6 mice on chow +/− Trp with some groups receiving daily gavage with the indicated indole. (C–E) Day-14 tumors were collected from B6 mice on Trp+/− diet with or without daily IAA or ILA gavage, and flow cytometry analysis of the intra-tumoral in filtrates was performed for the markers indicated. MDCSs were defined as CD11b+GR1+MHCIIlo, and TAMs were defined as CD11b+F4/80+; the T cells were CD3+CD8+ cells. MFI, mean fluorescence intensity. (F) CD45+CD11b+F4/80+ TAMs were sorted from day-14 tumors from mice treated with IAA as in (C). The mRNA indicated were then measured by qrt-PCR and normalized against βactin as described in STAR Methods. (see also Figure S4). * p <.05, ** p <.01, *** p <.001, NS- not significant.
Figure 6.
Figure 6.. AHR expression and activity correlates with patient outcomes in human PDAC
(A) Pan-cancer TCGA analysis showing relative AHR expression across 32 cancer types. (B) Overall survival of the PAAD (PDAC) TCGA patient dataset grouped based on relative AHR expression. Patients were grouped based on 1-median AHR expression. 2-quartiles of AHR expression. Q1 < Q2 < Q3 < Q4. 3- Q1 survival compared with all other quartiles combined. (C) ssGSEA analysis was performed by examining correlation between the AhR transcriptional signature and the indicated genes in the PAAD-TCGA dataset. Red line is the quartile regression as described in STAR Methods. (D) UMAP showing scRNA-seq data of 46,244 cells from human PDAC tumor samples and 8,542 cells from adjacent unaffected tissue. (E) UMAPs of scRNA-seq from indicated samples showing relative AHR expression. (F) Normalized expression and per cluster percentage expression of the genes indicated for each cell cluster for the scRNA-sequencing analysis described in (D). (G) GSEA of AHR+25 most similar genes for the indicated gene sets. Bars show relative p value, orange bars = p value <0.05, gray bars were not significant. (H) 5-day growth curve of human PDAC PDO cultured with PBMC-derived macrophages treated as indicated prior to initiation of the co-culture. Each data point represents the mean value for triplicate samples +/− the standard deviation. (I) Z score for iGSEA analysis of differential gene set enrichment of PDAC PDO/macrophage co-culture at day 5. Colored bars correspond to selected classifiers. (J) The relative prevalence and abundance of indole-producing bacterial taxa in the tumor microbiome for short-term surviving (STS) versus long-term surviving (LTS) PDAC patients. Results are sorted by odds ratio of bacterial presence in STS versus LTS in descending order. (see also Figure S5). ** p <.01, *** p <.001.

Comment in

References

    1. Afik R, Zigmond E, Vugman M, Klepfish M, Shimshoni E, Pasmanik-Chor M, Shenoy A, Bassat E, Halpern Z, Geiger T, et al. (2016). Tumor macrophages are pivotal constructors of tumor collagenous matrix. J. Exp. Med 213, 2315–2331. 10.1084/jem.20151193. - DOI - PMC - PubMed
    1. Ambarus CA, Krausz S, van Eijk M, Hamann J, Radstake TR, Reedquist KA, Tak PP, and Baeten DL (2012). Systematic validation of specific phenotypic markers for in vitro polarized human macrophages. J. Immunol. Methods 375, 196–206. 10.1016/j.jim.2011.10.013. - DOI - PubMed
    1. Aragozzini F, Ferrari A, Pacini N, and Gualandris R (1979). Indole-3-lactic acid as a tryptophan metabolite produced by Bifidobacterium spp. Appl. Environ. Microbiol 38, 544–546. 10.1128/AEM.38.3.544-546.1979. - DOI - PMC - PubMed
    1. Boj SF, Hwang C-I, Baker LA, Chio IIC, Engle DD, Corbo V, Jager M, Ponz-Sarvise M, Tiriac H, Spector MS, et al. (2015). Organoid models of human and mouse ductal pancreatic cancer. Cell 160, 324–338. 10.1016/j.cell.2014.12.021. - DOI - PMC - PubMed
    1. Braümuller H, Wieder T, Brenner E, Aßmann S, Hahn M, Alkhaled M, Schilbach K, Essmann F, Kneilling M, Griessinger C, et al. (2013). T-helper-1-cell cytokines drive cancer into senescence. Nature 494, 361–365. 10.1038/nature11824. - DOI - PubMed

Publication types

MeSH terms