. 2022 Apr 20;110(8):1416-1431.e13.
doi: 10.1016/j.neuron.2022.01.019. Epub 2022 Feb 8.

Hippocampal-amygdala memory circuits govern experience-dependent observational fear

Affiliations

Hippocampal-amygdala memory circuits govern experience-dependent observational fear

Joseph I Terranova et al. Neuron. .

Abstract

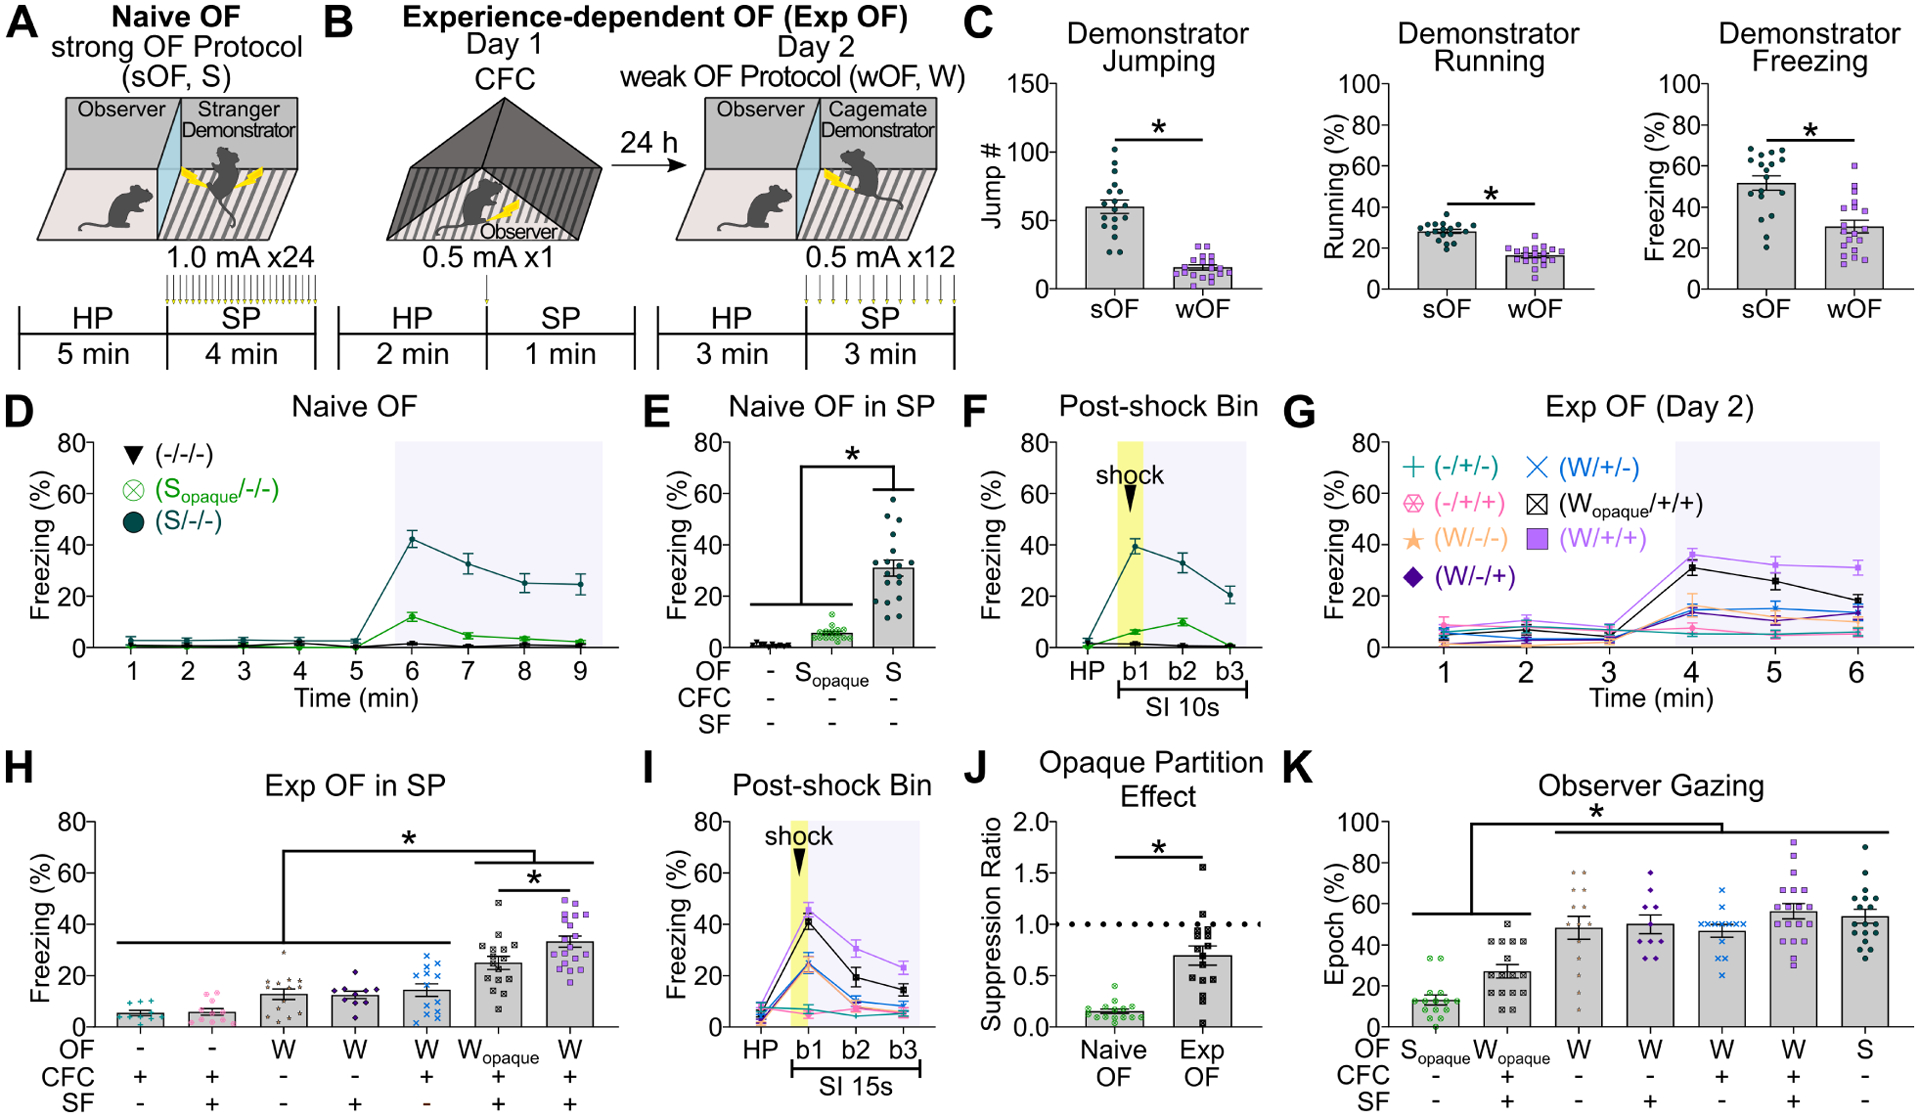
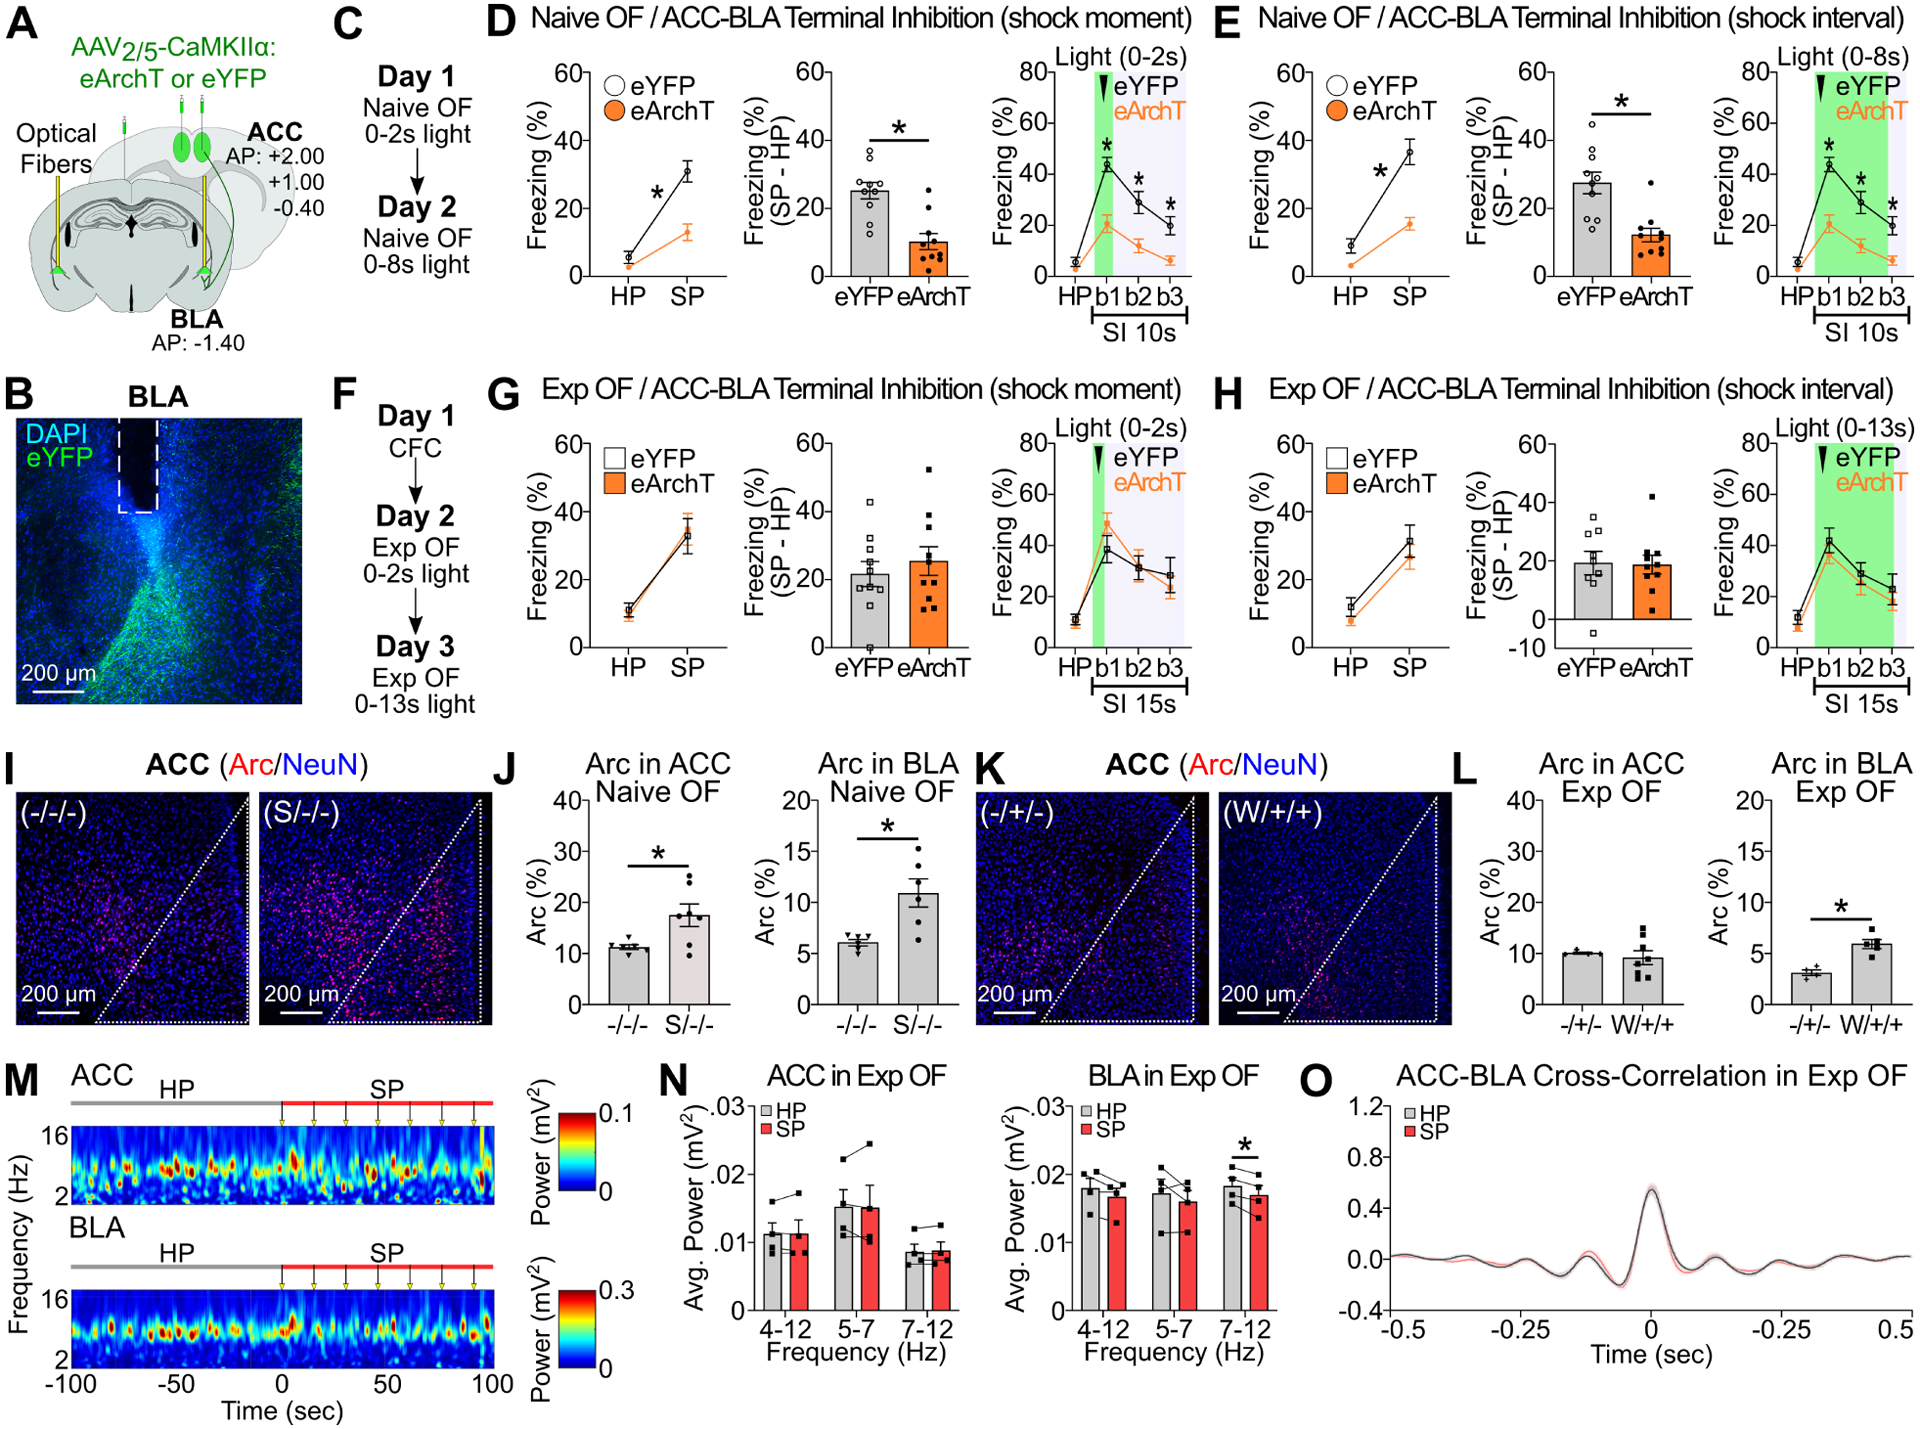
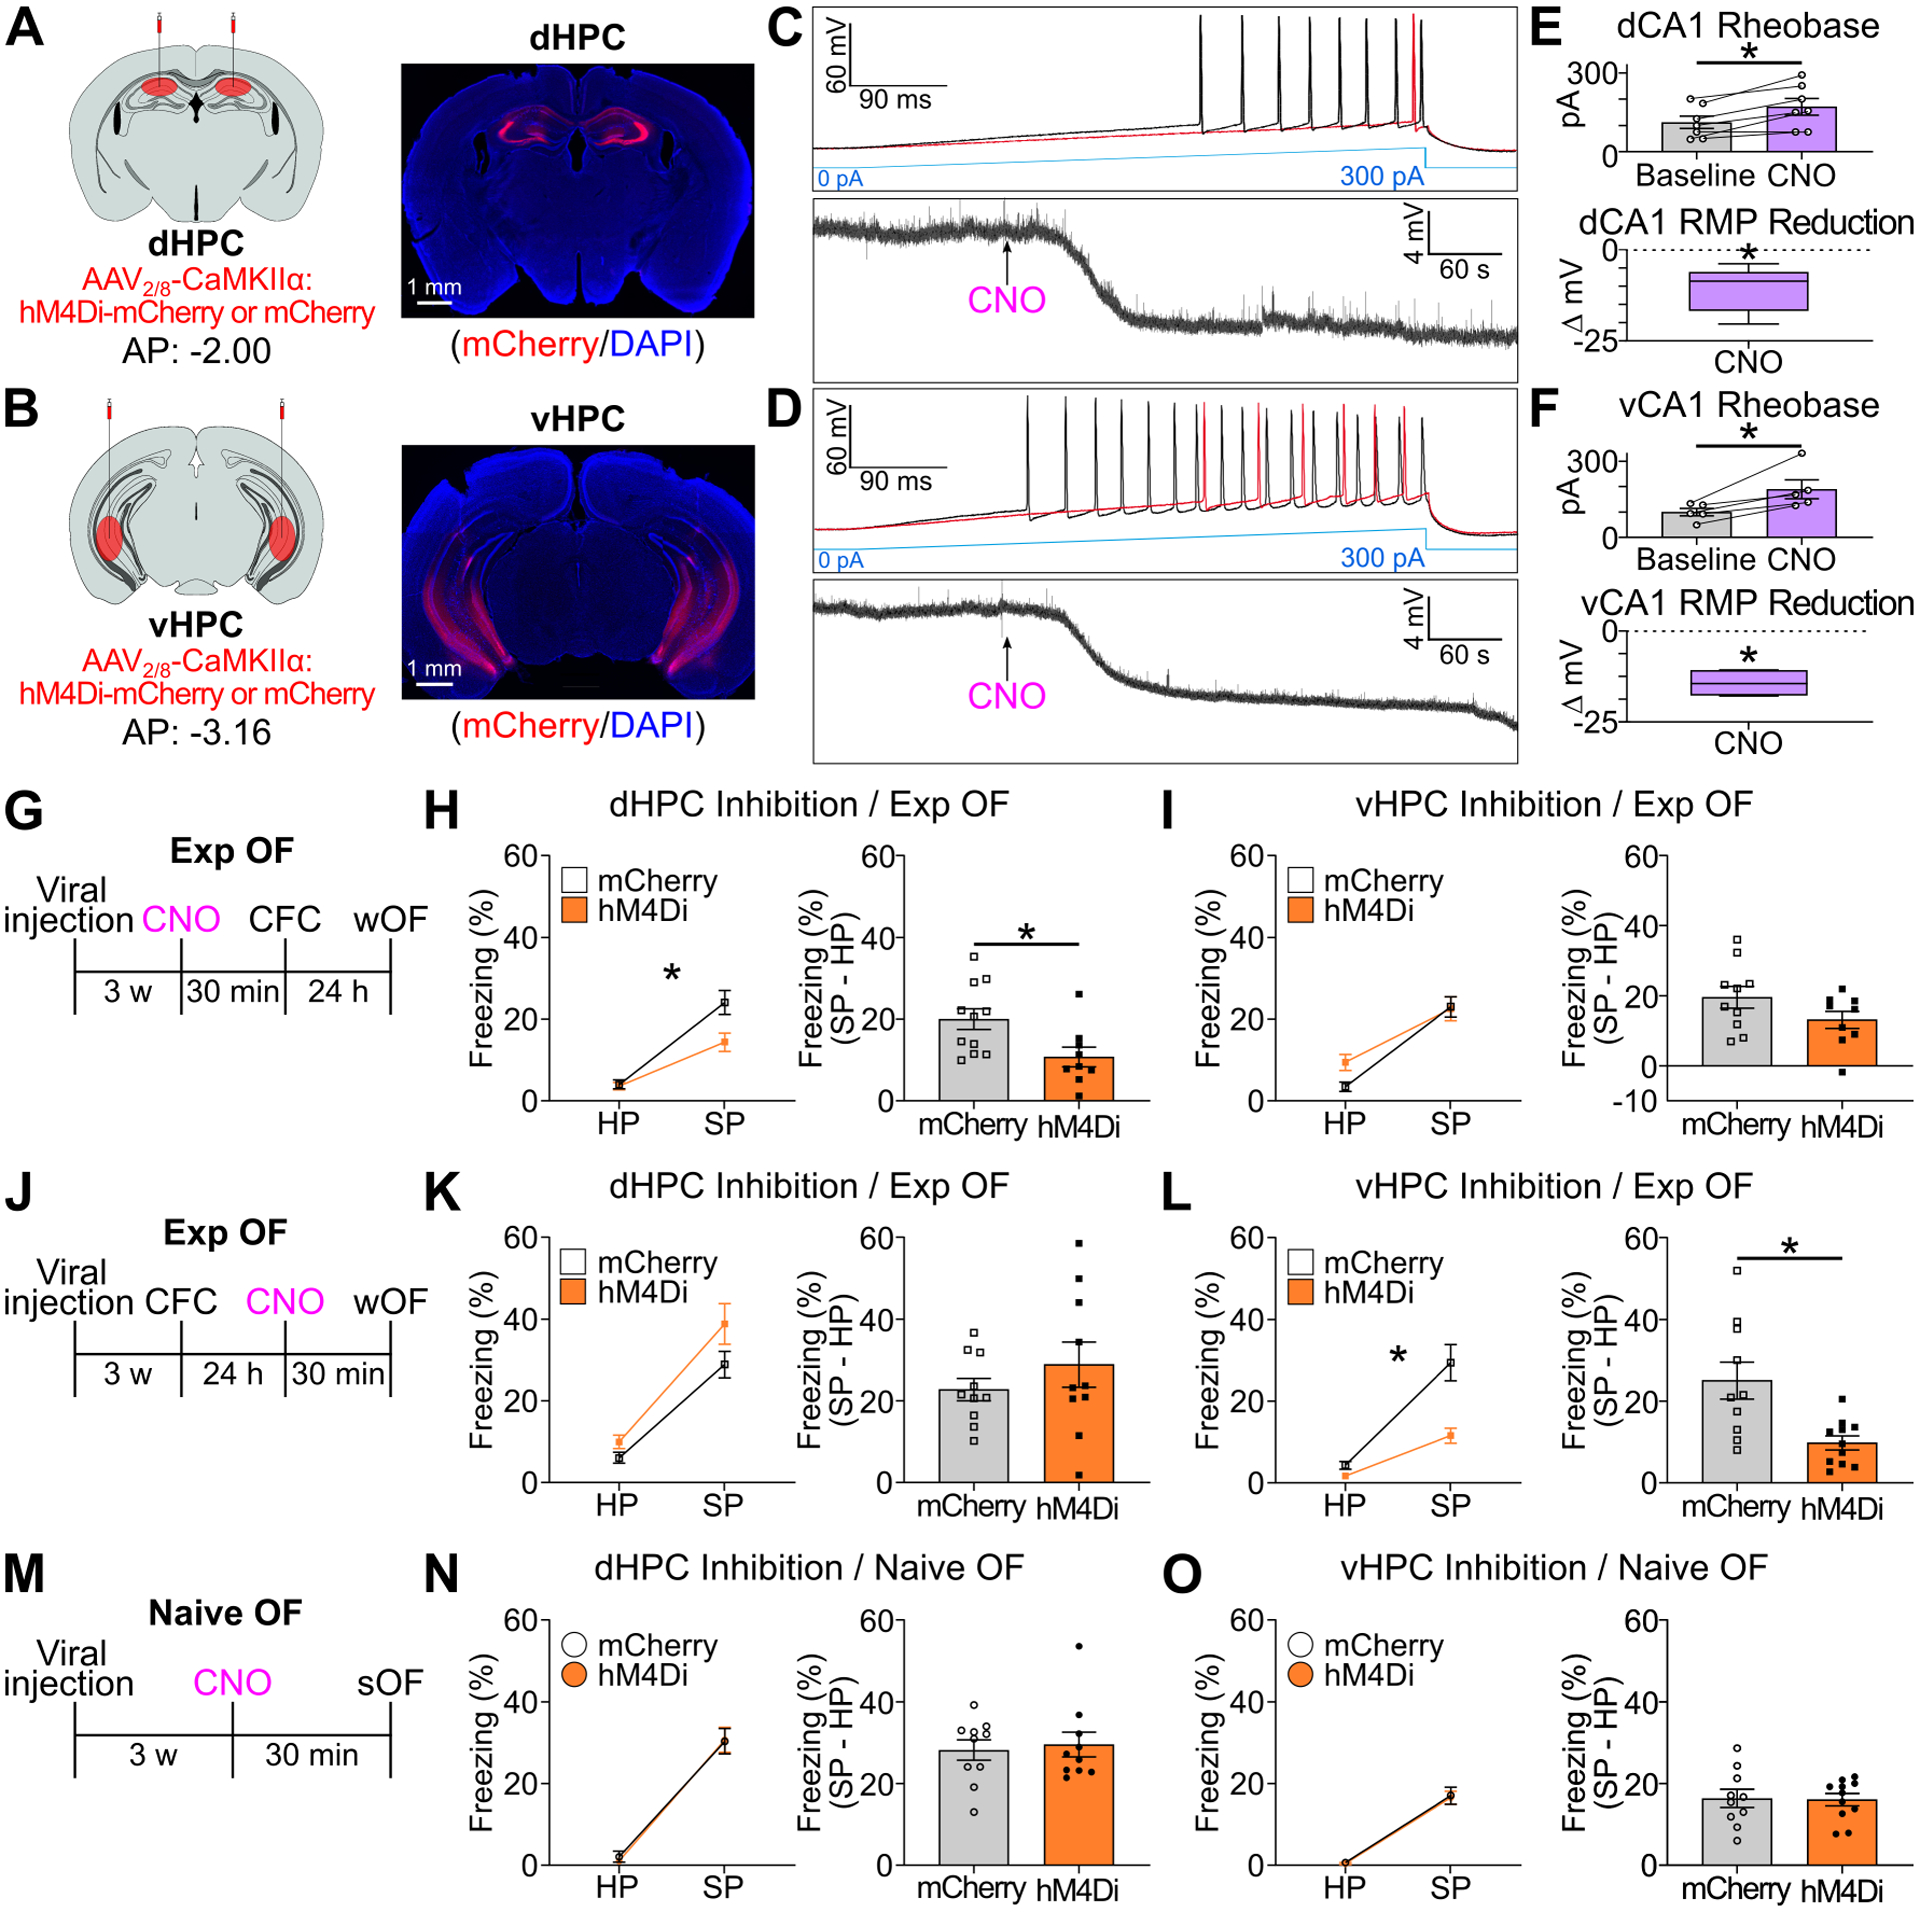
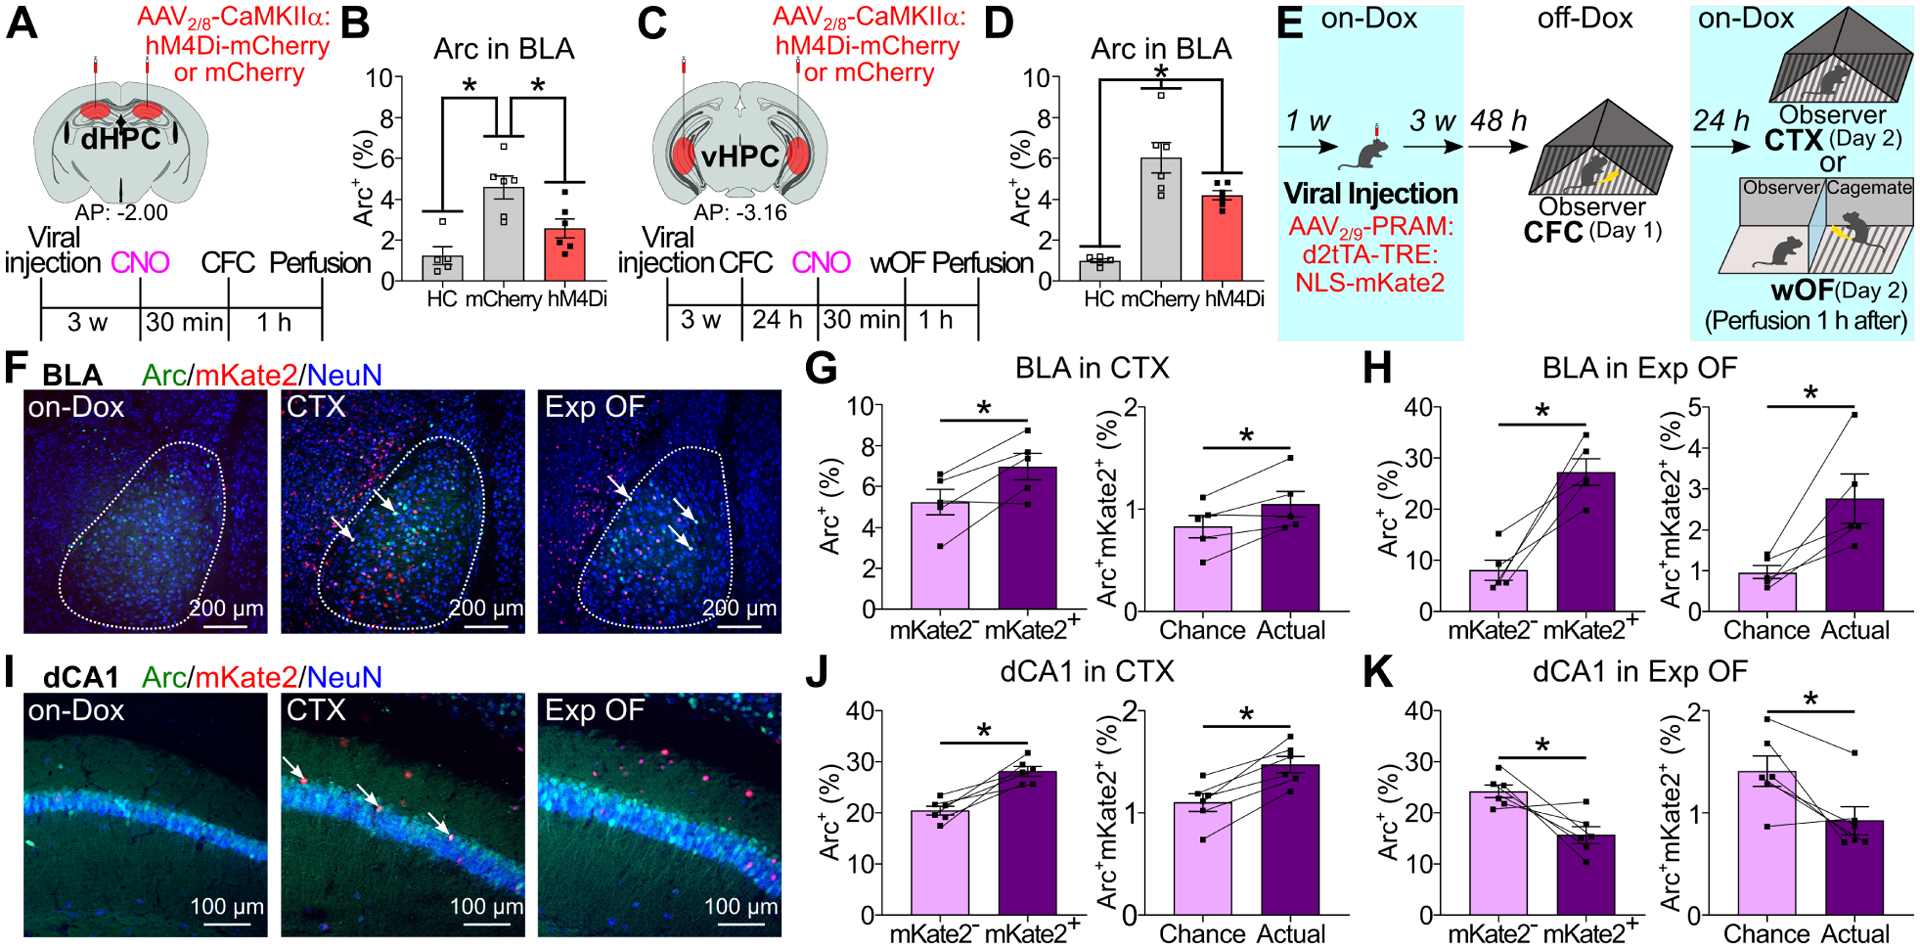
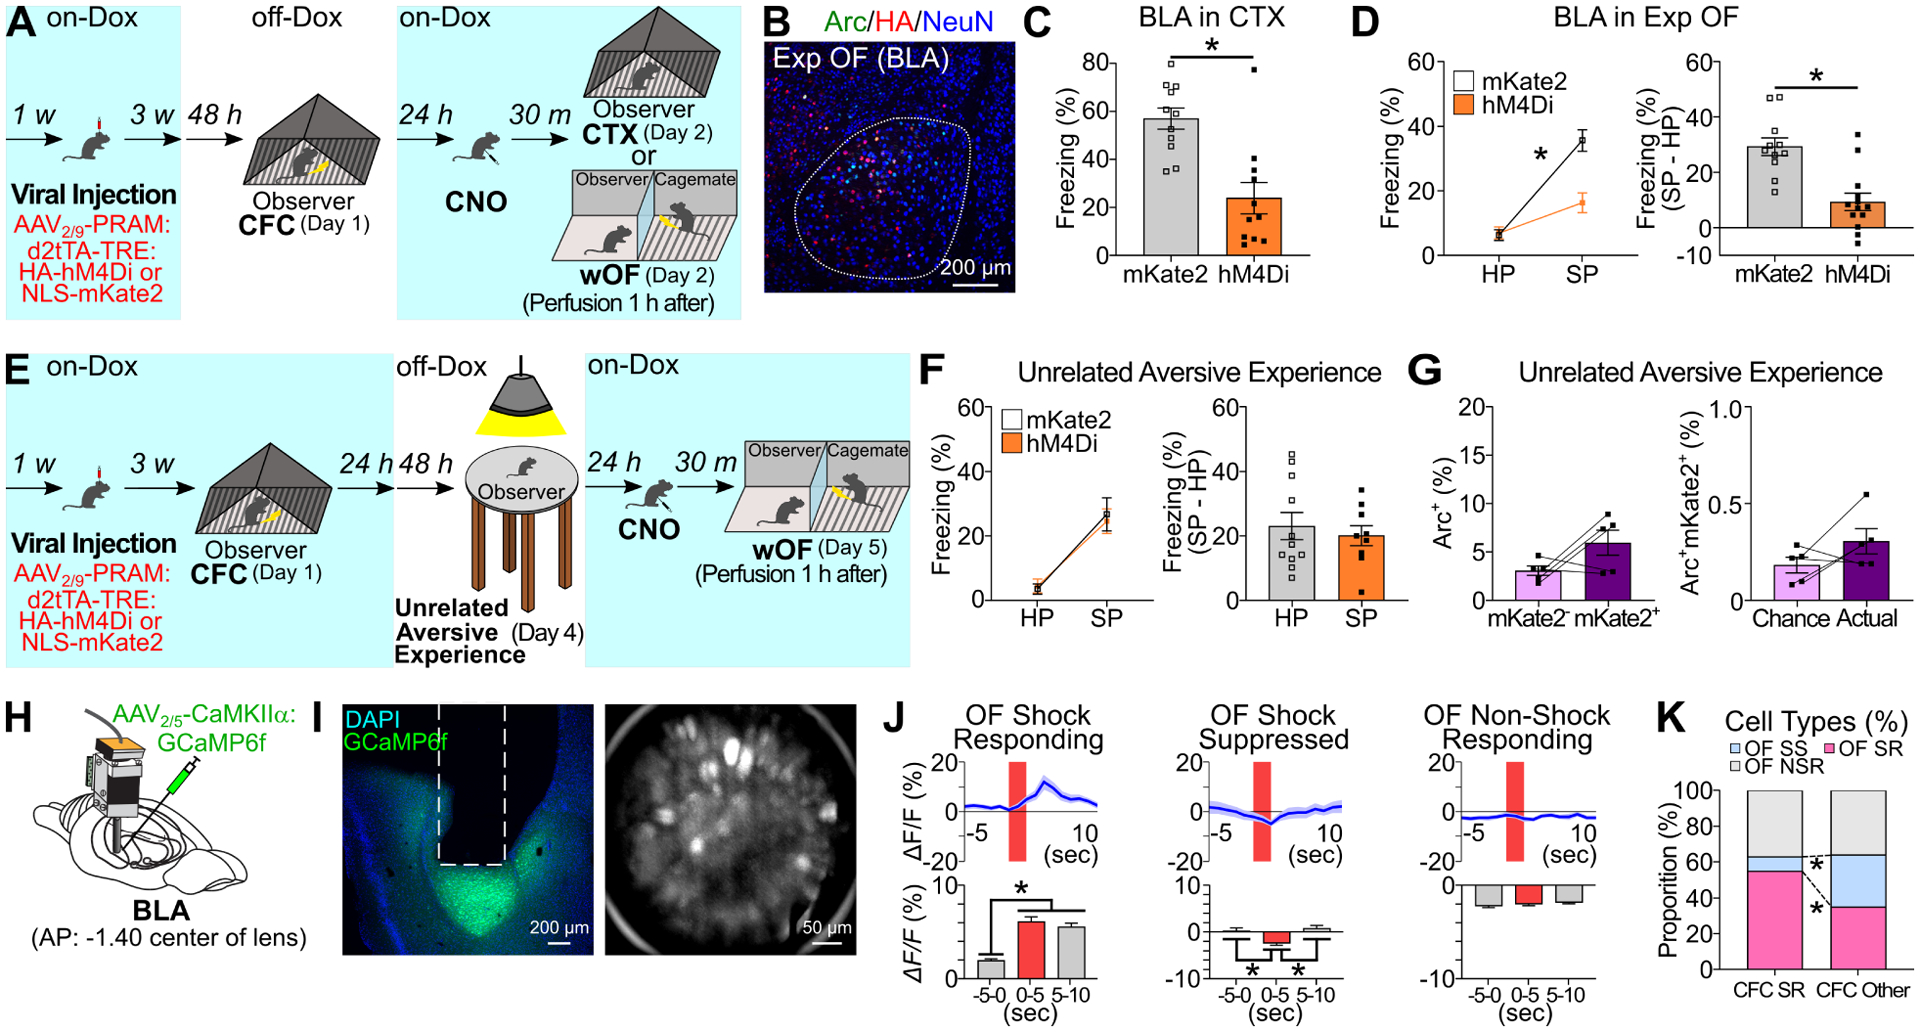
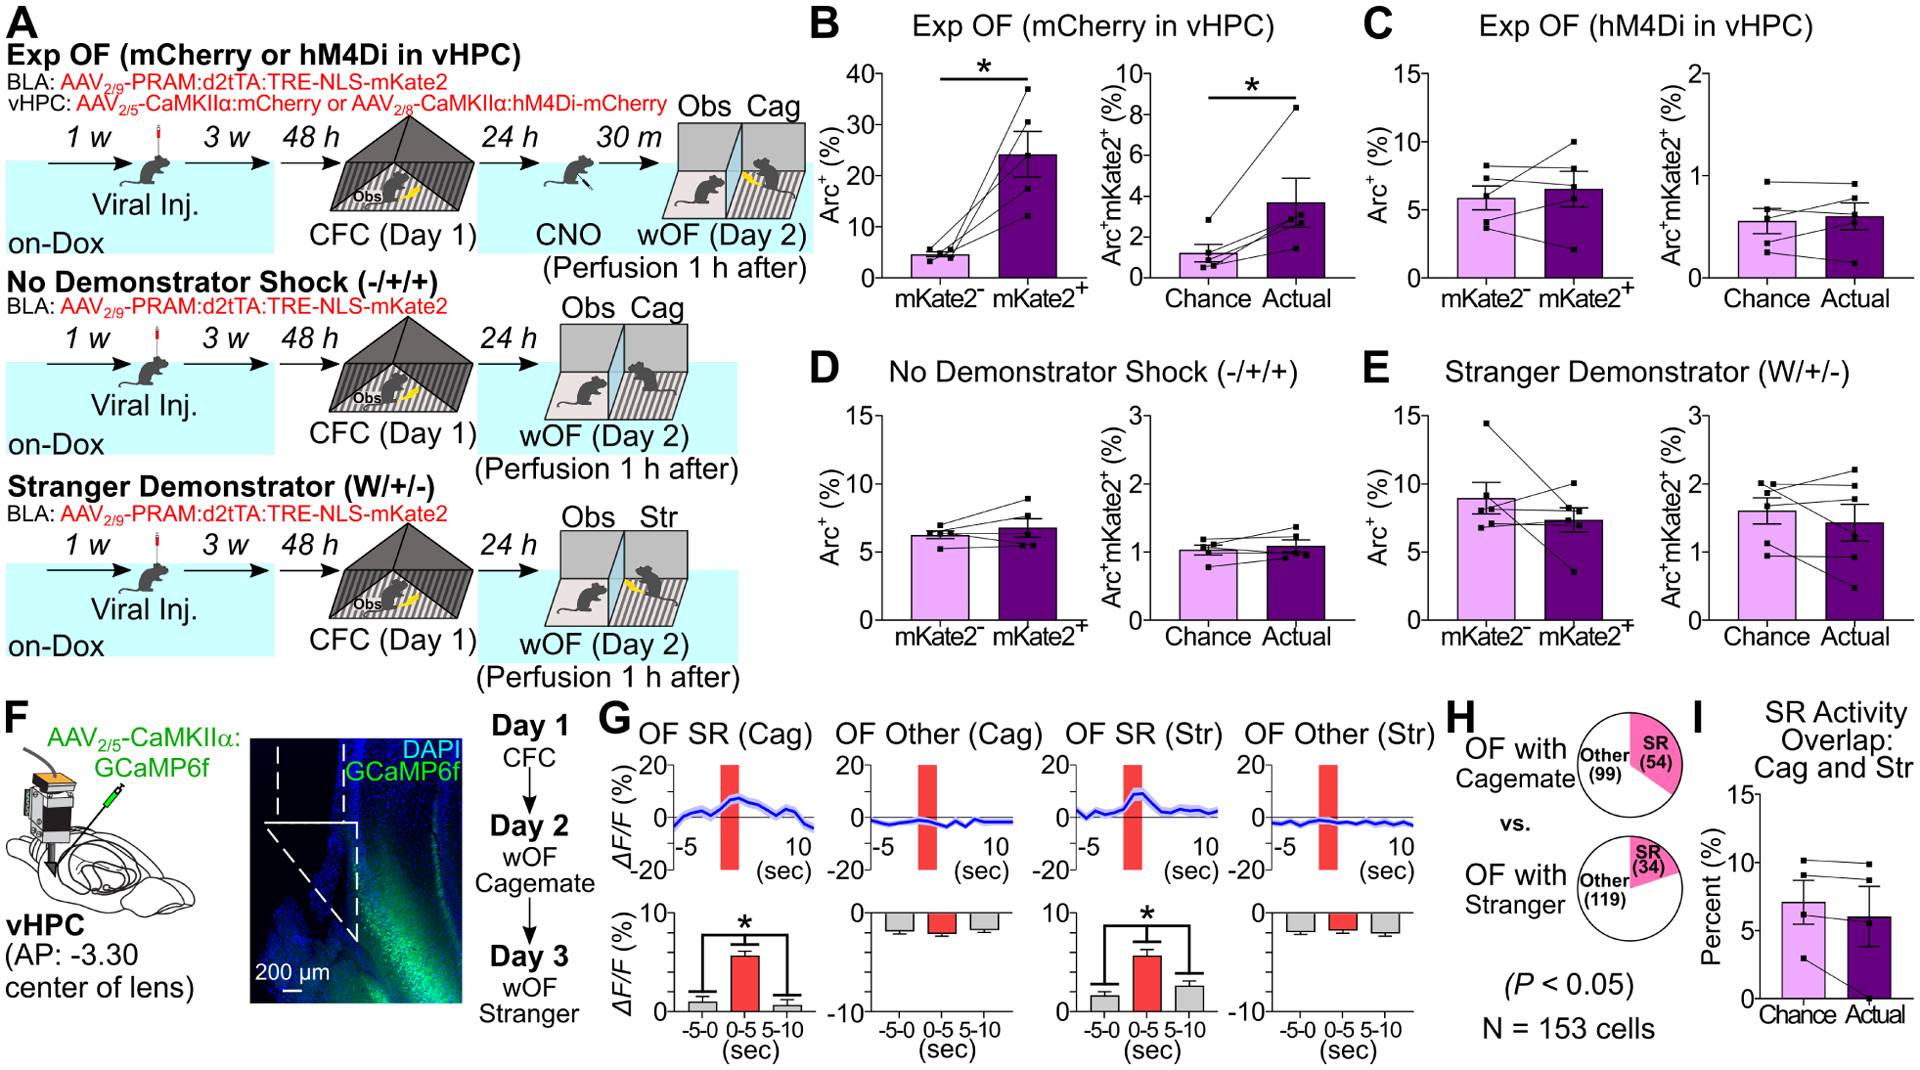
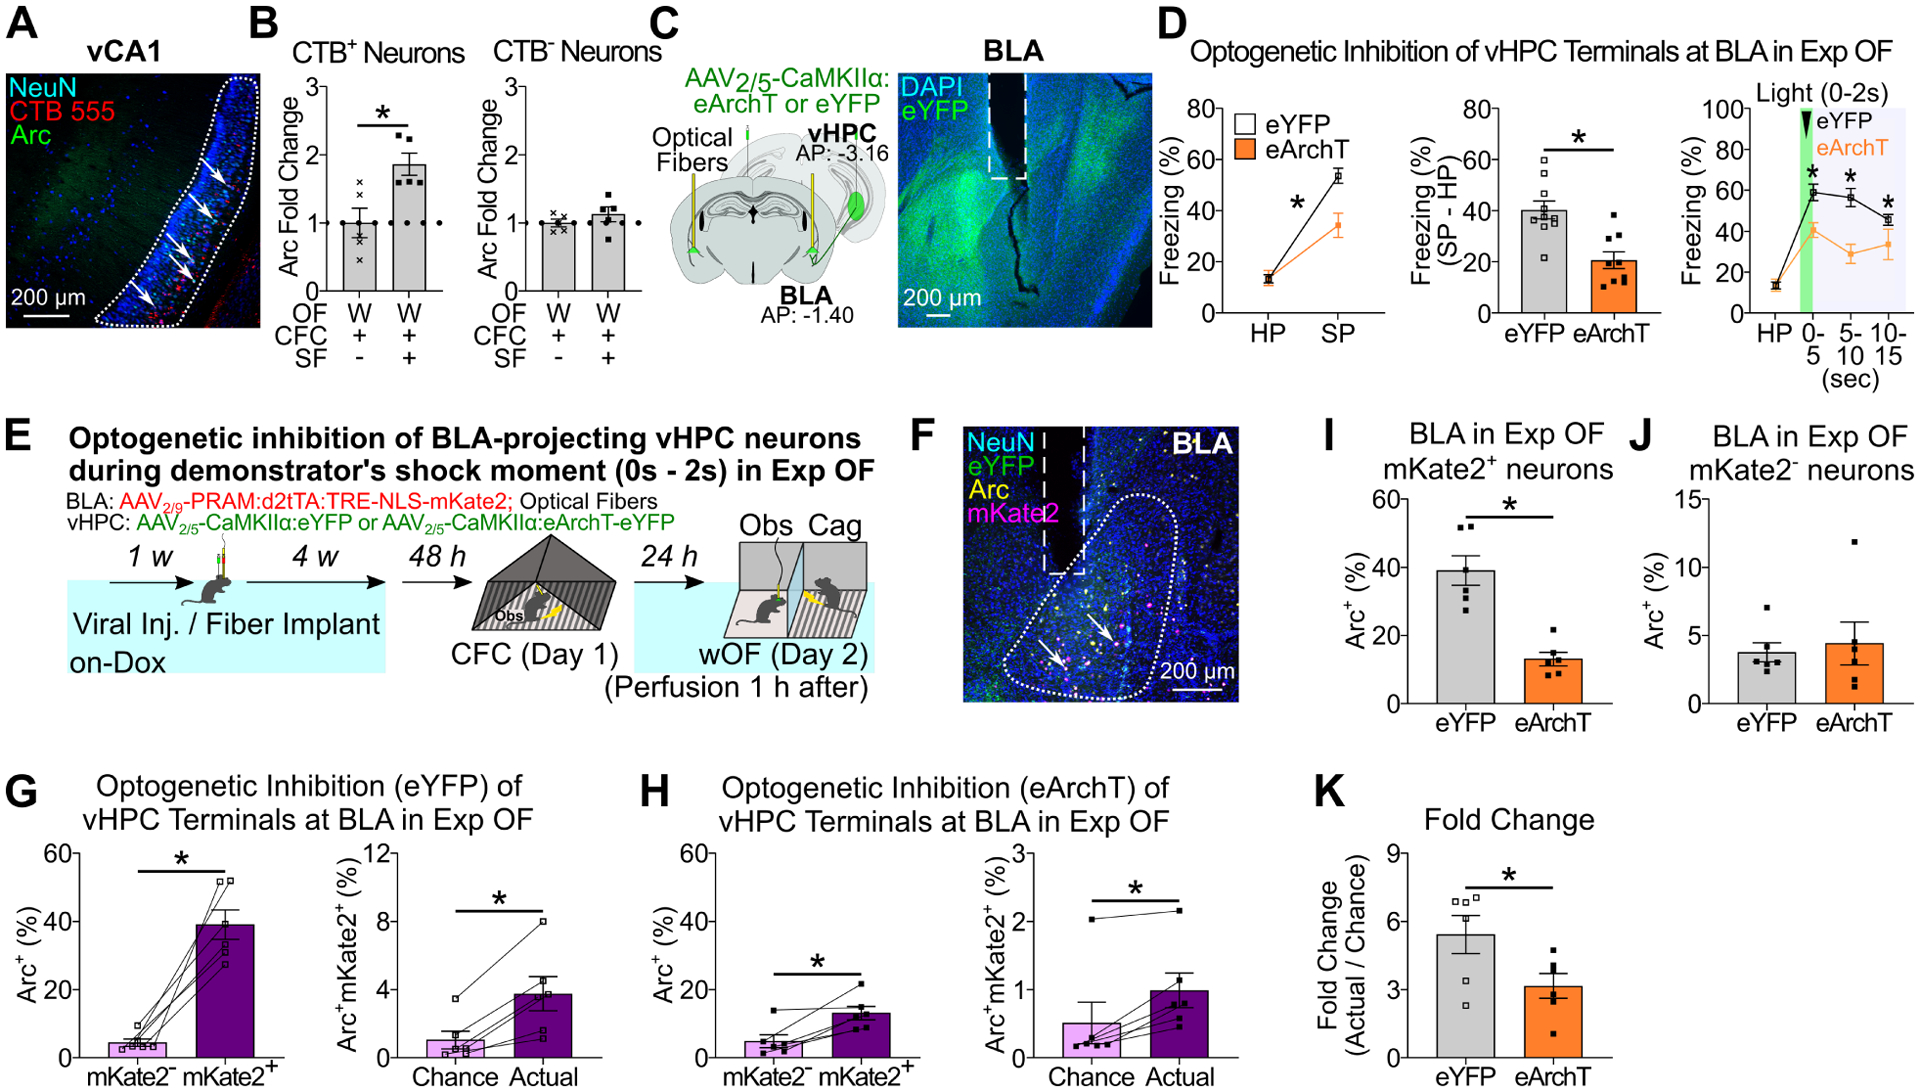
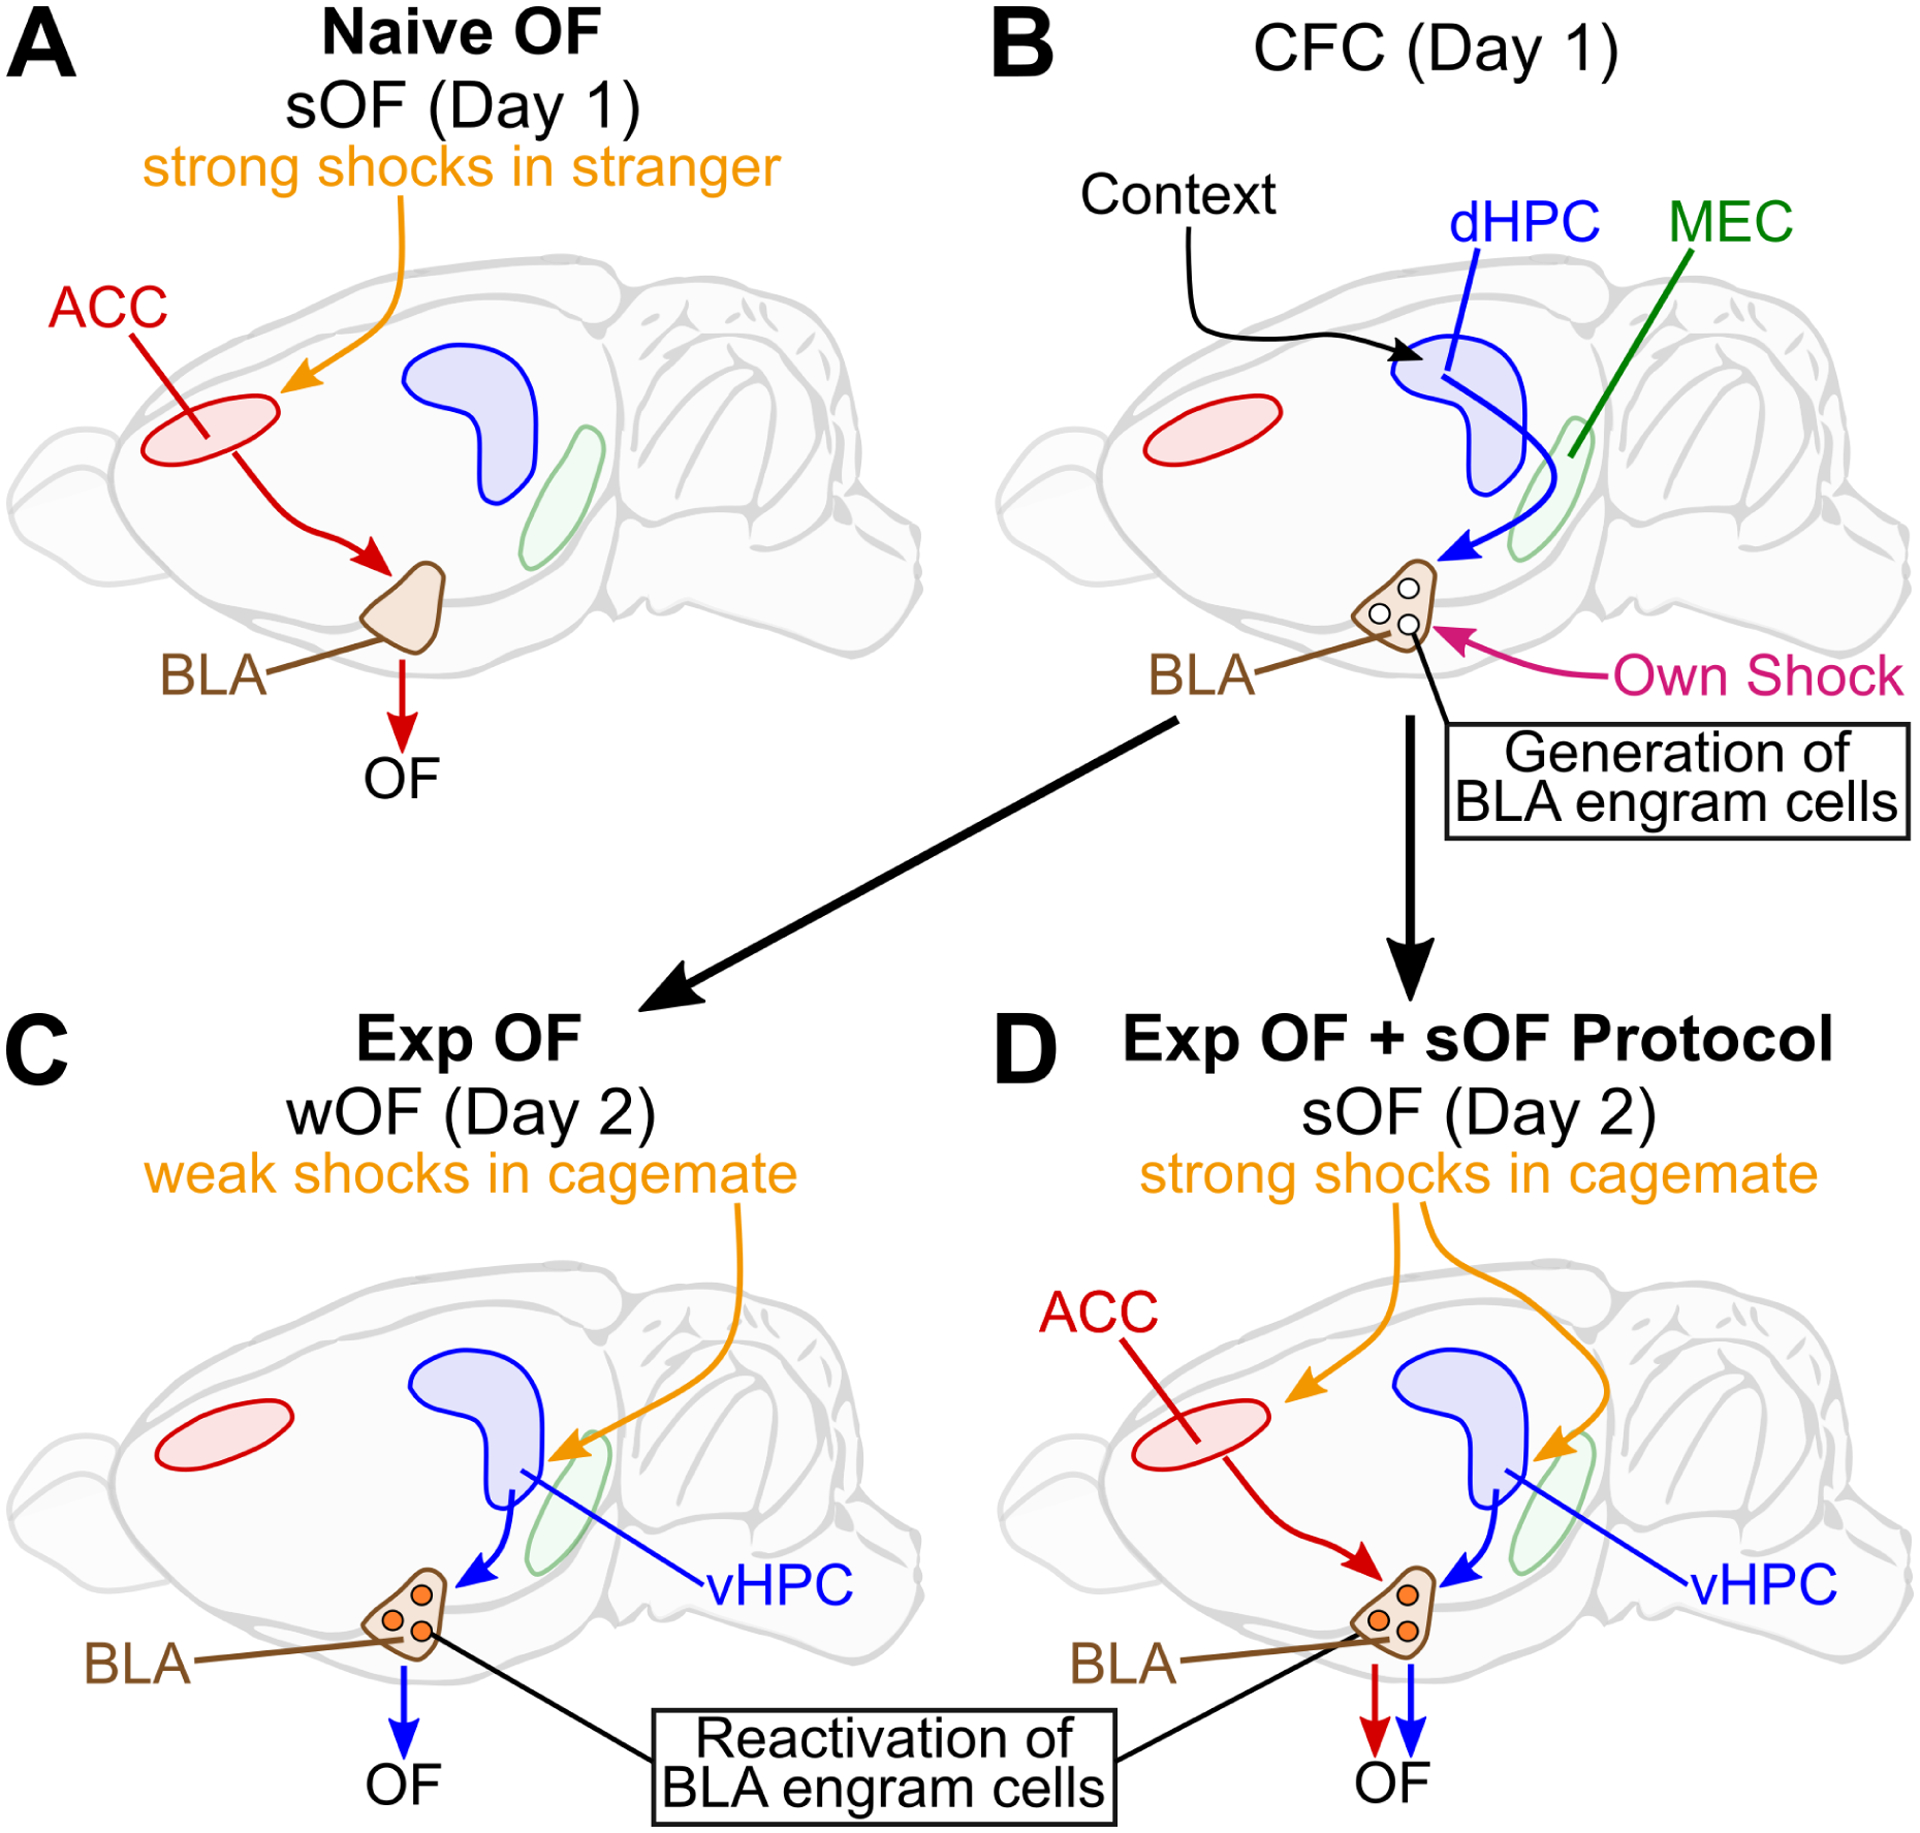
The empathic ability to vicariously experience the other's fearful situation, a process called observational fear (OF), is critical to survive in nature and function in society. OF can be facilitated by both prior similar fear experience in the observer and social familiarity with the demonstrator. However, the neural circuit mechanisms of experience-dependent OF (Exp OF) remain unknown. Here, we demonstrate that hippocampal-basolateral amygdala (HPC-BLA) circuits in mice without involving the anterior cingulate cortex, considered a center of OF, mediate Exp OF. Dorsal HPC neurons generate fear memory engram cells in BLA encoding prior similar fear experiences, which are essential for Exp OF. On the other hand, ventral HPC neurons respond to the familiar demonstrator's aversive situation during Exp OF, which reactivates the fear memory engram cells in BLA to elicit Exp OF. Our study provides new insights into the memory engram-dependent perception-action coupling that underlies empathic behaviors like Exp OF.

Keywords: amygdala; anterior cingulate cortex; contextual fear conditioning; emotional empathy; hippocampus; memory engram cells; observational fear; perception-action coupling; social memory.


Conflict of interest statement

Declaration of interests The authors declare no competing interests.

Figures

Figure 1:
Figure 1:. Naive OF and Exp OF behavioral models
(A) Naive Observational Fear (OF) with strong OF protocol (sOF/S). Arrows; electrical shock delivery. HP; habituation period, SP; shock period. (B) Experience-Dependent OF (Exp OF) with Day 1 CFC to observer and Day 2 weak OF protocol to demonstrator (wOF/W). CFC; contextual fear conditioning. (C) Demonstrator behavior in SP of Naive OF (sOF) and Exp OF (wOF). (D) Observer freezing levels in HP (1–5 min) and SP (6–9 min; gray box) of Naive OF or control conditions in 1 min time bins. (E) Observer freezing levels in SP of Naive OF. SF; social familiarity. (F) Observer freezing levels in post-shock bins in Naive OF. Yellow box; shock delivery to demonstrator (0 sec – 2 sec). Gray box; shock period. SI; shock interval. (G) Observer freezing levels in HP (1–3 min) and SP (4–6 min; gray box) of Exp OF or control conditions in 1 min time bins. (H) Observer freezing levels in SP of Exp OF. (I) Observer freezing levels in post-shock bins in Exp OF. Yellow box; shock delivery to demonstrator (0 sec – 2 sec). Gray box; shock period. (J) Suppression ratio of observer freezing by opaque partition. (K) Percentages of observer gazing epochs to demonstrator in SP of Exp OF, Naive OF, and the control conditions. Graphs show means ± SEM. * P < 0.05 by Mann-Whitney U-test (C, J), two-sided unpaired t-test (C), and one-way ANOVA with Tukey-Kramer test (E, H, K). In this and in all subsequent figures, bars without asterisks did not reach significance (P > 0.05). ANOVAs, F values, t values, and all additional statistical information for this and subsequent figures can be found in the Supplemental Table 1. See also Figure S1–2.
Figure 2:
Figure 2:. ACC and BLA in Exp OF and Naive OF
(A) Strategy for optogenetic terminal inhibition of ACC neurons at BLA. (B) Coronal section of BLA with fiber implantation (white lines) in BLA. (C, F) Schedule for Naive OF (C) and Exp OF (F). (D-E, G-H) Observer freezing response with optogenetic inhibition of ACC terminals at BLA in Naive OF (D-E) and Exp OF (G-H) during shock moment (D, G) or shock moment+ post shock period (E, H). (Left) Observer freezing levels during HP and SP of eYFP and eArchT groups. (Middle) Subtraction freezing levels (SP–HP) of eYFP and eArchT groups. (Right) Observer freezing levels in post-shock bins. (I, K) Coronal sections of Arc/NeuN immunohistochemistry in ACC in Naive OF (I) or Exp OF (K). White lines; ACC region. (J, L) Percentages of Arc+ neurons in ACC or BLA in Naive OF (J) or Exp OF (L). (M) Representative spectrograms of local field potentials (LFPs) in ACC and BLA during HP and SP in Exp OF. Arrows; 2-sec 0.5 mA shock delivered to the demonstrator. (N) Averaged theta 4–12 Hz, 5–7 Hz and 7–12 Hz power for ACC (left) and BLA (right) during the HP and SP in Exp OF. (O) Averaged cross-correlation of ACC-BLA neural activity during the HP and SP in Exp OF. N = 4 mice. Graphs show means ± SEM. * P < 0.05 by interaction with two-way mixed ANOVA (D-E, G-H), two-sided unpaired t-test (D-E, G-H, L), Mann-Whitney U-test (D-E, J, L), and two-sided paired t-test (N-O). See also Supplemental Table 1 and Figure S3–4.
Figure 3.
Figure 3.. Dorsoventral hippocampus in Exp OF and Naive OF.
(A-B) (Left) Strategy. (Right) Coronal sections of hM4Di-mCherry expression in dHPC (A) or vHPC (B). (C-D) Ramping current injection (top) and changes in resting membrane potential (RMP, bottom) in hM4Di+ dCA1 neurons (C) or vCA1 neurons (D) after CNO application. (E-F) (Top) Required current injection to evoke action potential before and during CNO application for dHPC-hM4Di (E) and vHPC-hM4Di (F). (Bottom) Change in RMP from baseline in hM4Di+ neurons after CNO application in dCA1 (E) or vCA1 (F). (G) Schedule for chemogenetic inhibition of dHPC (H) or vHPC (I) during CFC in Exp OF. (H-I) (Left) Observer freezing levels during HP and SP of mCherry and hM4Di groups. (Right) Subtraction freezing levels (SP–HP). (J) Schedule for chemogenetic inhibition of dHPC (K) or vHPC (L) during wOF in Exp OF. (K-L) (Left) Observer freezing levels during HP and SP. (Right) Subtraction freezing levels. (M) Schedule for chemogenetic inhibition of dHPC (N) or vHPC (O) during sOF in Naive OF. (N-O) (Left) Observer freezing levels during HP and SP. (Right) Subtraction freezing levels. Graphs show means ± SEM, except E-F RMP graphs, which are presented as box plots. * P < 0.05 by two-sided paired t-test (E-F), one-sample t-test (E-F), interaction with two-way mixed ANOVA (H-I, K-L, N-O), two-sided unpaired t-test (H-I, N-O), and Mann-Whitney U-test (K-L). See also Supplemental Table 1 and Figure S5–6.
Figure 4.
Figure 4.. BLA and dHPC CA1 memory engram ensembles in Exp OF.
(A, C) Experimental schedules. (B, D) Percentages of Arc+ neurons in BLA after CFC (B) or Exp OF (D). (E) Reactivation of CFC-activated neurons during exposure to conditioned context (CTX) or Exp OF. (F, I) Coronal sections of BLA (F) and dCA1 (I) in on-Dox, CTX, and Exp OF. Arrows; Arc+mKate2+ neurons. (G-H, J-K) (Left) Percentages of Arc+ neurons in mKate2 and mKate2+ neurons in BLA/CTX, BLA/Exp OF, dCA1/CTX, and dCA1/Exp OF groups. (Right) Actual percentages and chance levels of Arc+mKate2+ neurons in BLA/CTX, BLA/Exp OF, dCA1/CTX, and dCA1/Exp OF groups. Graphs show means ± SEM. * P < 0.05 by one-way ANOVA with Tukey-Kramer test (B, D), and two-sided paired t-test (G-H, J-K). See also Supplemental Table 1 and Figure S7–8.
Figure 5.
Figure 5.. BLA fear memory engram cells in Exp OF.
(A) Inhibition of CFC-activated BLA neurons during CTX (C) or Exp OF (D). (B) Coronal section of BLA in Exp OF. (C) Freezing levels during CTX in mKate2 and hM4Di groups. (D) (Left) Observer freezing levels during HP and SP of mKate2 and hM4Di groups. (Right) Subtraction freezing levels. (E) Experimental schedule for inhibition (F) and reactivation (G) of BLA neurons activated by an unrelated aversive experience (bright light exposure on elevated platform) during Exp OF. (F) (Left) Observer freezing levels during HP and SP of mKate2 and hM4Di groups. (Right) Subtraction freezing levels. (G) (Left) Percentages of Arc+ neurons in mKate2 and mKate2+ neurons in BLA during Exp OF. (Right) Actual percentages and chance levels of Arc+mKate2+ neurons in BLA during Exp OF. (H) BLA GRIN lens implantation. (I) (Left) Coronal section of BLA in GRIN lens (white lines) implantation. (Right) Stacked image acquired through microendoscope. (J) (Top) Averaged calcium activity (ΔF/F %) in OF Shock-Responding (SR), Shock-Suppressed (SS), and Non-Shock Responding (NSR) cell during Exp OF. Shock delivery period (red; 2 sec). (Bottom) Averaged calcium activity in −5–0 sec, 0–5 sec, and 5–10 sec period during Exp OF. (K) Proportion of OF SR, SS, and NSR cells between CFC SR and Other cells. N = 160 cells. Graphs show means ± SEM. * P < 0.05 by two-sided unpaired t-test (C, D, F), interaction with two-way mixed ANOVA (D, F), two-sided paired t-test (G), one-way repeated measures ANOVA with Tukey-Kramer test (J), and chi-square test (K). See also Supplemental Table 1 and Figure S9.
Figure 6.
Figure 6.. Dynamics and necessity of vHPC neuron activity in Exp OF.
(A) Experimental schedules. (B-E) (Left) Percentages of Arc+ neurons in mKate2 and mKate2+ BLA neurons in Exp OF/mCherry in vHPC, Exp OF/hM4Di in vHPC, No Demonstrator Shock, and Stranger Demonstrator groups. (Right) Actual percentages and chance levels of Arc+mKate2+ BLA neurons in Exp OF/mCherry in vHPC, Exp OF/hM4Di in vHPC, No Demonstrator Shock, and Stranger Demonstrator groups. (F) (Left) vHPC GRIN lens implantation. (Center) Coronal section of vHPC in GRIN lens (white lines) implantation. (Right) Schedule (imaging on Day 2 and Day 3). (G) (Top) Averaged calcium activity (ΔF/F %) of Cagemate and Stranger OF SR and OF Other cells during Exp OF. (Bottom) Averaged calcium activity in −5–0 sec, 0–5 sec, and 5–10 sec period during Exp OF. (H) Proportion of vHPC OF-SR and OF-Other cells between cagemate and stranger demonstrator. (I) Actual percentages and chance levels of Cagemate SR/Stranger SR cells during OF. Graphs show means ± SEM. * P < 0.05 by two-sided paired t-test (B-E, I), one-way repeated measures ANOVA with Tukey-Kramer test (G), and chi-square test (H). See also Supplemental Table 1 and Figure S10–11.
Figure 7.
Figure 7.. vHPC-BLA pathway in Exp OF.
(A) Coronal section of vHPC CA1. Arrows indicate CTB+Arc+ neurons. (B) Fold change analysis in the percentages of Arc+ neurons in CTB+ neurons (left) and CTB neurons (right) with stranger demonstrator (W/+/−) or cagemate demonstrator (W/+/+). Data are normalized by average of the stranger demonstrator (W/+/−) group. (C) (Left) Strategy. (Right) Coronal section of BLA. White lines indicate fiber implantation. (D) Observer freezing response with optogenetic vHPC terminal inhibition at BLA during the demonstrator’s shock moment in Exp OF. (Left) Observer freezing levels during HP and SP of eYFP and eArchT groups. (Middle) Subtraction freezing levels. (Right) Observer freezing levels in post-shock bins in Exp OF. (E) Experimental schedule. (F) Coronal section of BLA with fiber implantation (white lines). Arrows; Arc+mKate2+ neurons. (G-H) (Left) Percentages of Arc+ neurons in mKate2 and mKate2+ neurons in BLA of in eYFP (G) and eArchT (H) groups. (Right) Actual percentages and chance percentages of Arc+mKate2+ neurons in eYFP (G) and eArchT (H) groups. (I-J) Percentages of Arc+ neurons in mKate2+ (I) or mKate2 (J) neurons of eYFP and eArchT groups. (K) Fold change analysis (actual / chance) comparing eYFP and eArchT groups. Graphs show means ± SEM. * P < 0.05 by two-sided unpaired t-test (B, D, I-K), and interaction with two-way mixed ANOVA (D), Mann-Whitney U-test (D), two-sided paired t-test (G-H). See also Supplemental Table 1 and Figure S12–13.
Figure 8.
Figure 8.. Proposed models for Naive OF and Exp OF.
(A) Strong shocks delivered to a stranger demonstrator activates the ACC to BLA pathway to facilitate Naive OF. (B-C) During prior CFC (contextual fear conditioning) experience on Day 1, dHPC via subiculum and/or medial entorhinal cortex (MEC) generates fear memory engram cells in BLA. On Day 2, when weak shocks are delivered to a cagemate demonstrator, BLA-projecting vHPC neurons reactivate BLA fear memory engram cells to facilitate Exp OF. (B, D) The combination of Exp OF (prior CFC experience on Day 1, exposure to OF with a cagemate demonstrator on Day 2) with the strong OF protocol (sOF) delivered to the demonstrator enhances OF response in observers. Both ACC and vHPC are necessary for Exp OF + sOF, which indicates that the ACC-BLA and HPC-BLA pathways parallelly facilitate OF. See also Supplemental Table S2 and Figure S14.

References

    1. Adolphs R (2013). The Biology of Fear. Current Biology 23, R79–R93. - PMC - PubMed
    1. Allsop SA, Wichmann R, Mills F, Burgos-Robles A, Chang C-J, Felix-Ortiz AC, Vienne A, Beyeler A, Izadmehr EM, Glober G, et al. (2018). Corticoamygdala Transfer of Socially Derived Information Gates Observational Learning. Cell 173, 1329–1342.e1318. - PMC - PubMed
    1. Andersen SM, and Chen S (2002). The relational self: An interpersonal social-cognitive theory. Psychological Review 109, 619–645. - PubMed
    1. Aron A, Norman CC, and Aron EN (1998). The self-expansion model and motivation. Representative Research in Social Psychology 22, 1–13.
    1. Aron EN, and Aron A (1996). Love and expansion of the self: The state of the model. Personal Relationships 3, 45–58.

Publication types