. 2022 Apr 20;110(8):1340-1357.e7.
doi: 10.1016/j.neuron.2022.01.018. Epub 2022 Feb 8.

Suppression of premature transcription termination leads to reduced mRNA isoform diversity and neurodegeneration

Affiliations

Suppression of premature transcription termination leads to reduced mRNA isoform diversity and neurodegeneration

Geneva R LaForce et al. Neuron. .

Abstract

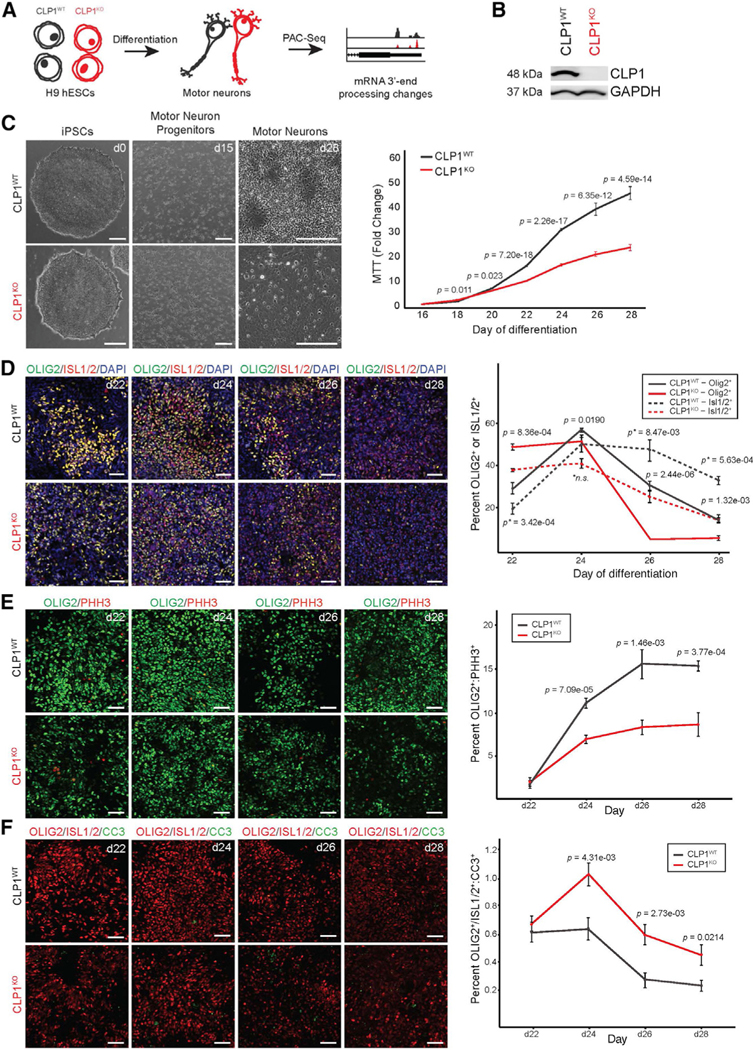
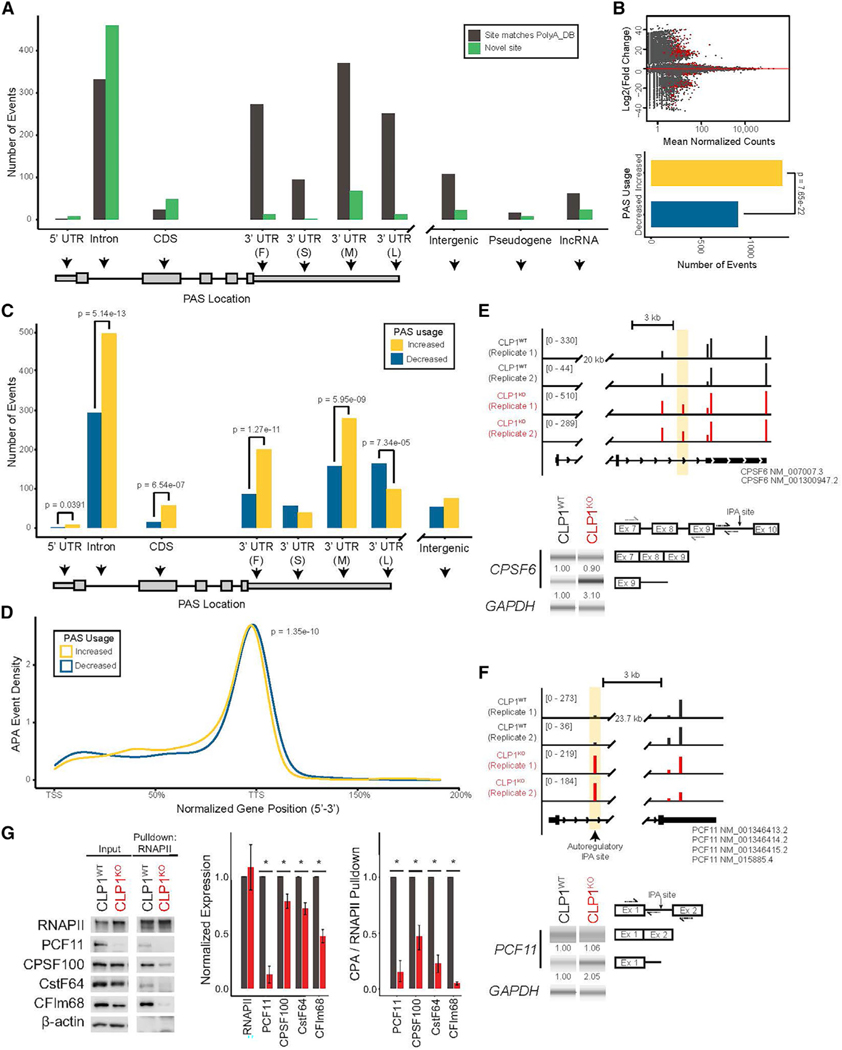
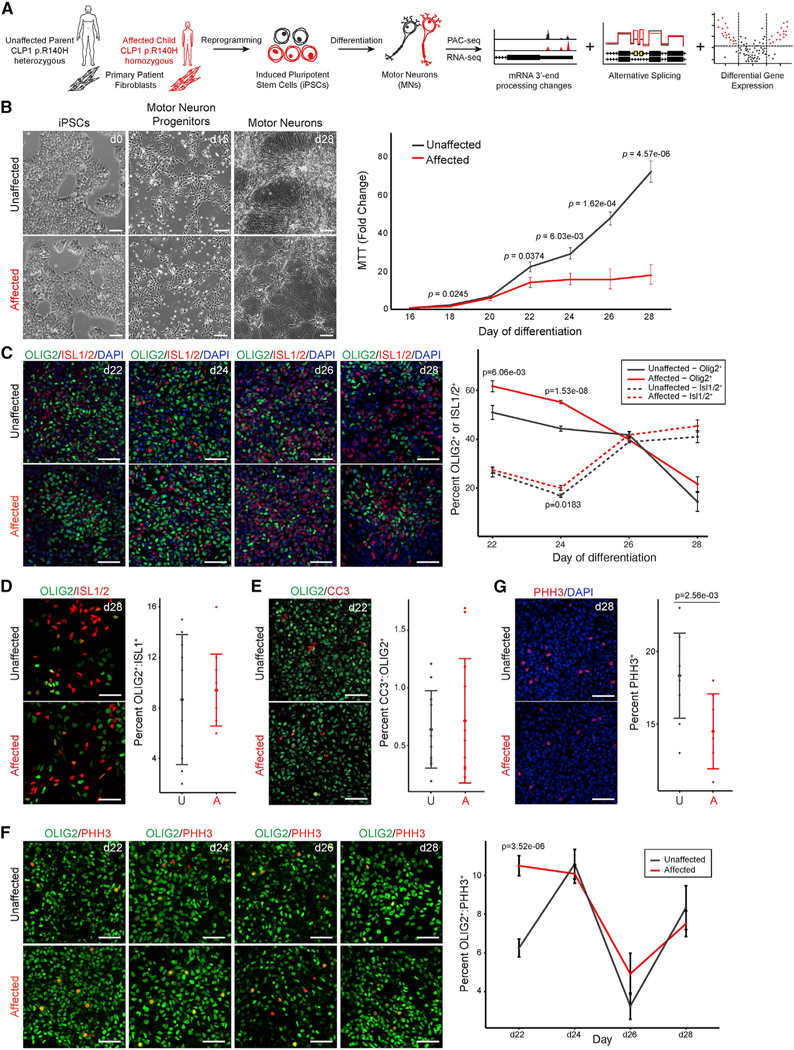
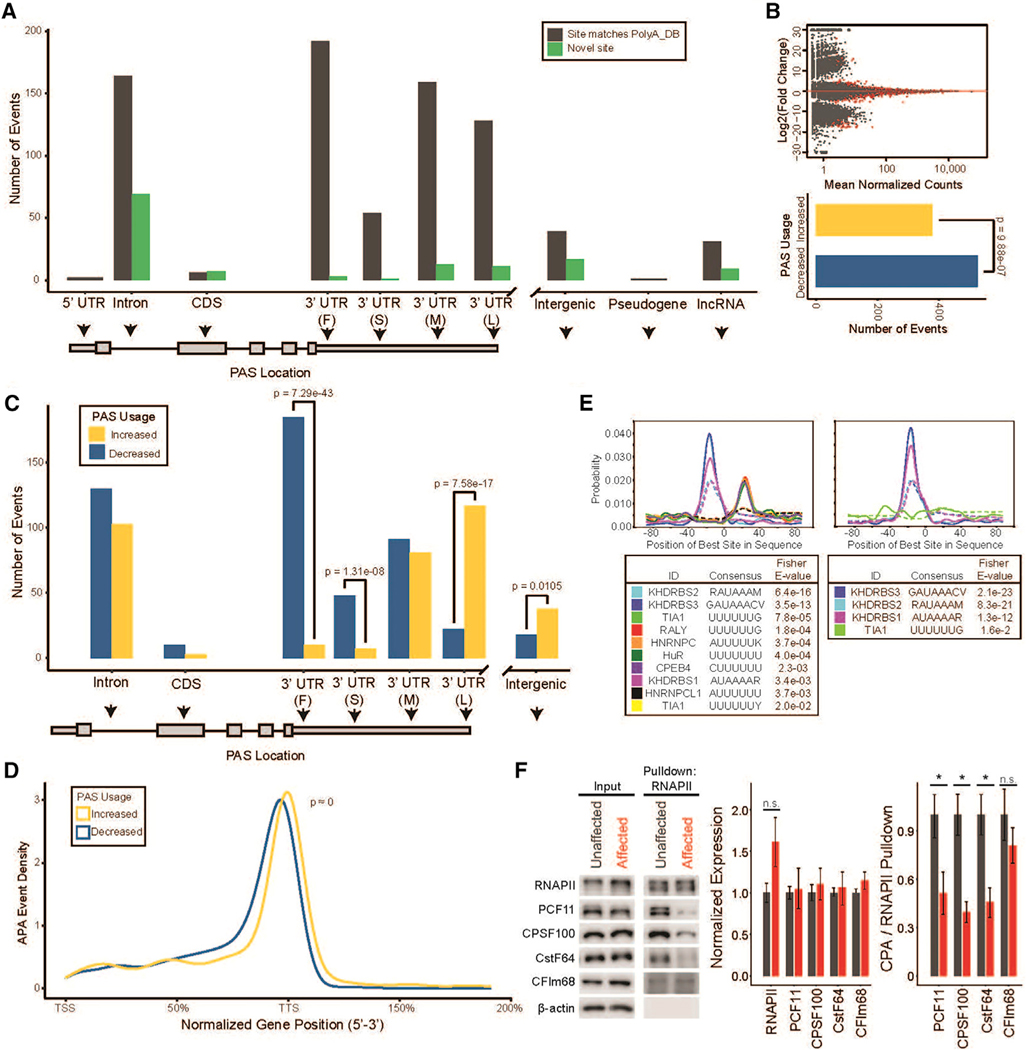
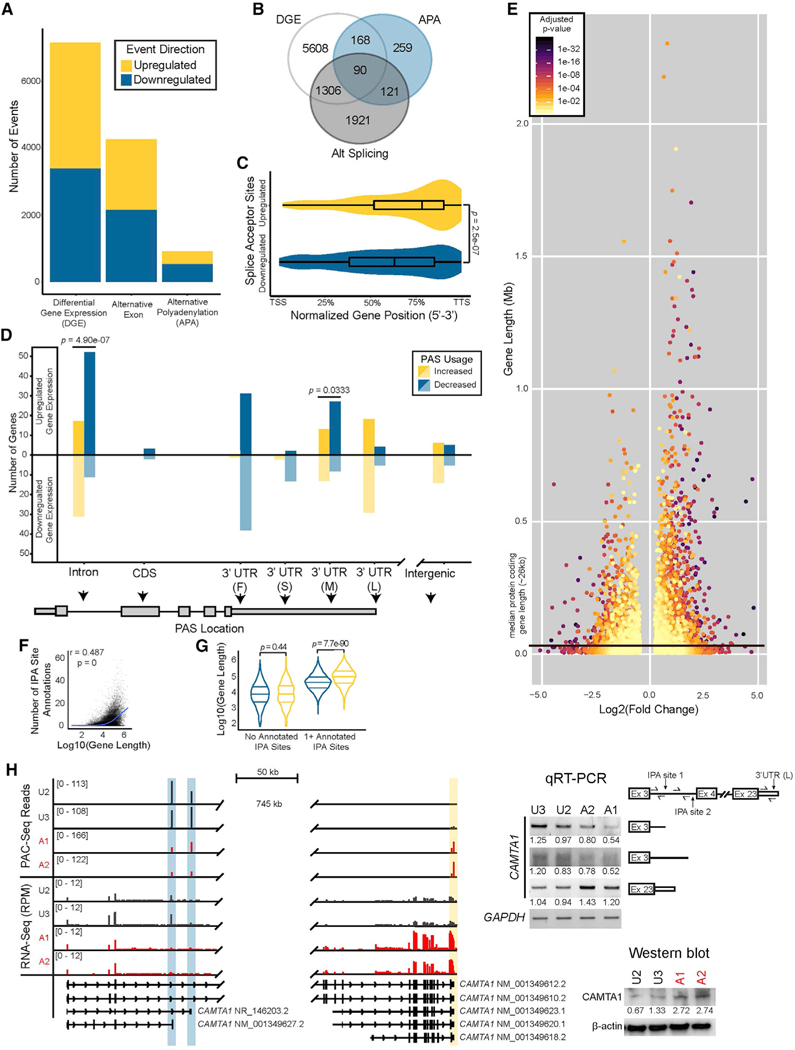
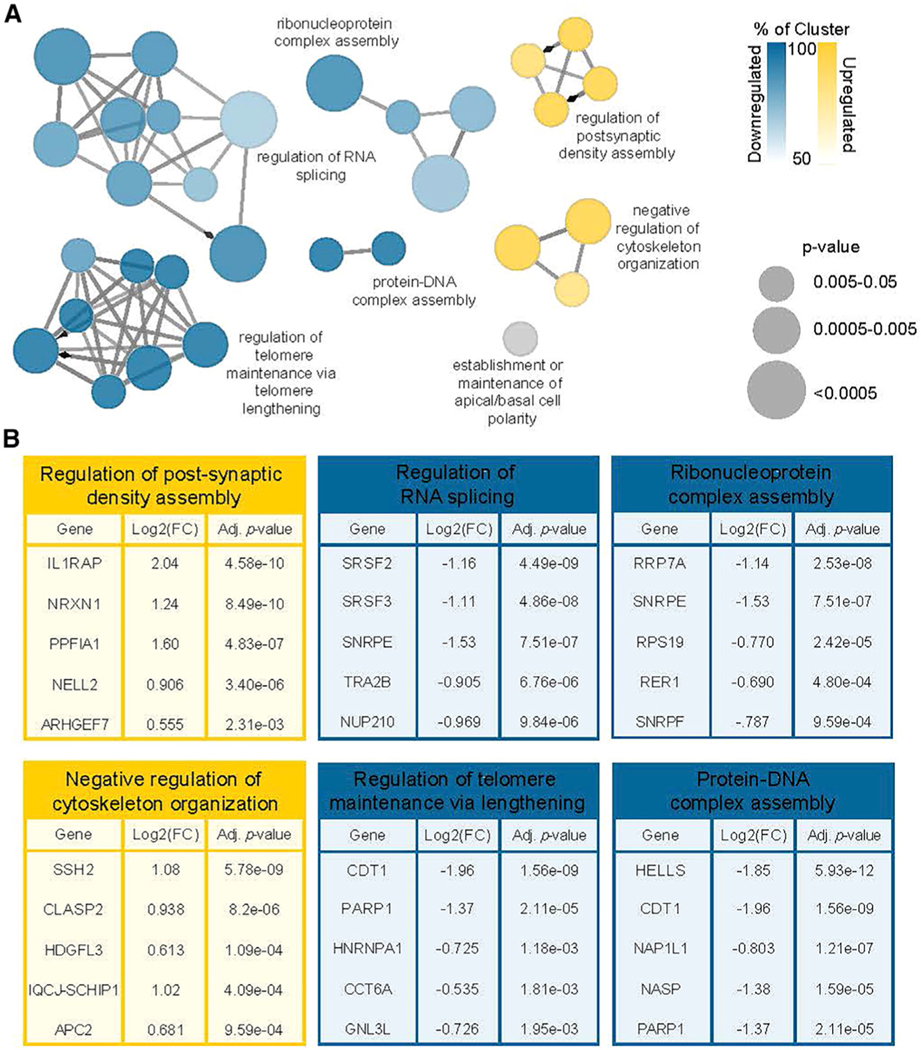
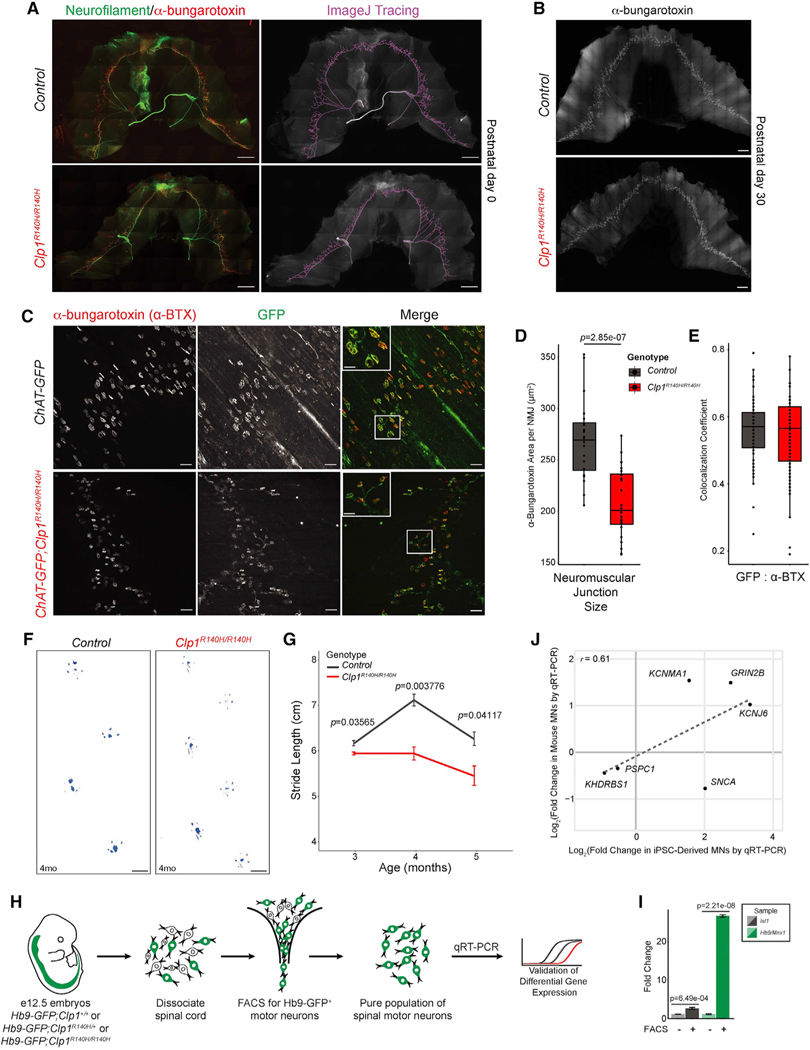
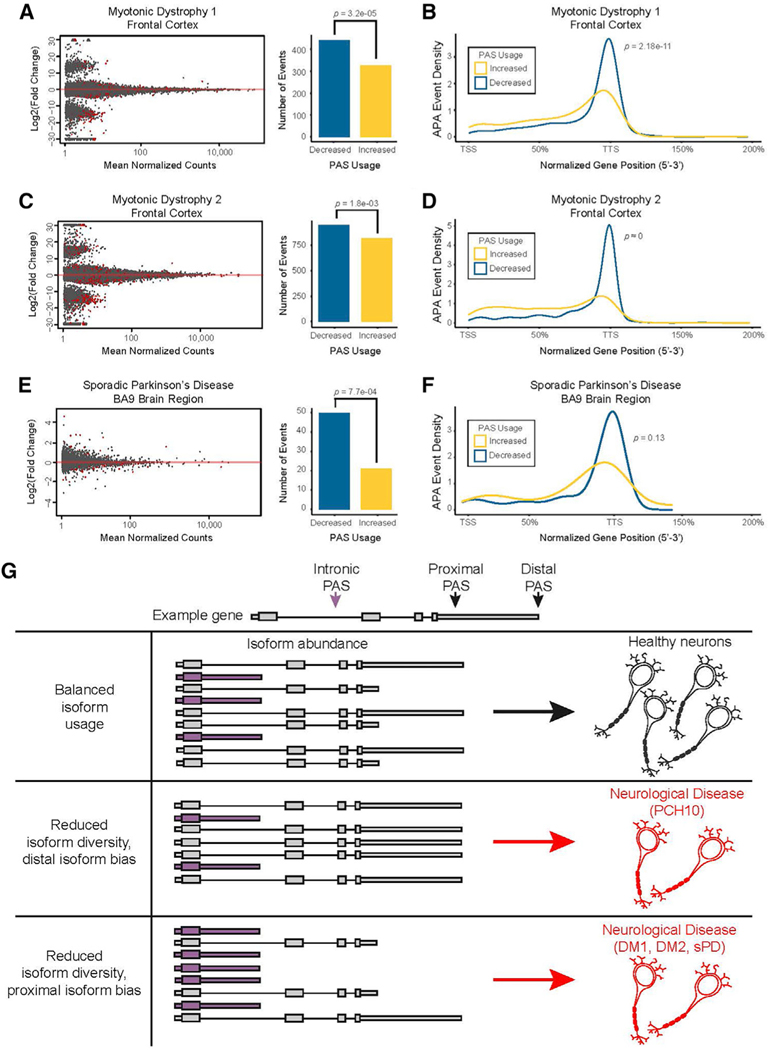
Tight regulation of mRNA isoform expression is essential for neuronal development, maintenance, and function; however, the repertoire of proteins that govern isoform composition and abundance remains incomplete. Here, we show that the RNA kinase CLP1 regulates mRNA isoform expression through suppression of proximal cleavage and polyadenylation. We found that human stem-cell-derived motor neurons without CLP1 or with the disease-associated CLP1 p.R140H variant had distinct patterns of RNA-polymerase-II-associated cleavage and polyadenylation complex proteins that correlated with polyadenylation site usage. These changes resulted in imbalanced mRNA isoform expression of long genes important for neuronal function that were recapitulated in vivo. Strikingly, we observed the same pattern of reduced mRNA isoform diversity in 3' end sequencing data from brain tissues of patients with neurodegenerative disease. Together, our results identify a previously uncharacterized role for CLP1 in mRNA 3' end formation and reveal an mRNA misprocessing signature in neurodegeneration that may suggest a common mechanism of disease.

Keywords: CLP1; alternative polyadenylation; co-transcriptional mRNA processing; motor neuron disease; pontocerebellar hypoplasia.


Conflict of interest statement

Declaration of interests The authors declare no competing interests.

Figures

Figure 1.
Figure 1.. CLP1 is not required in hESCs but impairs directed differentiation to motor neurons
(A) Study schematic. H9 hESCs lacking CLP1 (CLP1KO) and isogenic controls (CLP1WT) were differentiated into motor neurons and profiled for changes in mRNA 3′ end processing by PAC-seq. (B) Western blot for CLP1 in CLP1KO and isogenic CLP1WT H9 hESCs. GAPDH, loading control; n = 3 replicates. (C) Representative brightfield images of CLP1KO and CLP1WT hESCs during motor neuron differentiation (left). Scale bars, 250 μm. MTT assay of CLP1KO and CLP1WT hESC-derived motor neurons during differentiation is depicted (right); n = 8 technical replicates. Three clonal hESC lines were used as biological replicates; two-sided Student’s t test. (D) Immunostaining for OLIG2 and ISL1/2 in CLP1KO and CLP1WT cultures at day 22 of motor neuron differentiation. p, OLIG2+ statistics; p*, ISL1/2+ statistics; n.s., non-significant (p > 0.05); two-sided Student’s t test; n = 6, 20× fields-of-view per clone. Representative images are shown from three clonal lines per genotype. Scale bars, 50 μm. (E) Analysis of OLIG2+ motor neuron progenitor cell proliferation by PHH3 immunostaining in CLP1WT and CLP1KO cultures during differentiation (days 22–28); two-sided Student’s t test; n = 6, 20× fields-of-view per clone. Representative images are shown from three clonal lines per genotype. Scale bars, 50 μm. (F) Analysis of motor neuron (OLIG2+ or ISL1/2+) apoptosis by CC3 immunostaining in CLP1WT and CLP1KO cultures during differentiation; two-sided Student’s t test; n = 6, 20× fields-of-view per clone. Representative images are shown from three clonal lines per genotype. Scale bars, 50 μm. See also Figure S1.
Figure 2.
Figure 2.. CLP1 regulates mRNA isoform diversity by repressing intronic and proximal polyadenylation site usage
(A) Novel and previously annotated PASs in CLP1KO versus CLP1WT hESC-derived motor neurons binned by intragenic position. 3′ UTR subdivisions are “F,” “S,” “M,” and “L” for first, single, middle, and last, respectively. Intergenic corresponds to ≥ 10 kb beyond the annotated end of genes. (B) M-A plot (top) of polyadenylation sites (PASs) in CLP1KO versus CLP1WT hESC-derived motor neurons, red points = p value < 0.05. Quantification of sites with increased and decreased usage is shown (bottom); two-sided binomial test. (C) APA events binned by intragenic position in CLP1KO versus CLP1WT hESC-derived motor neurons. 3′ UTR subdivisions are “F,” “S,” “M,” and “L” for first, single, middle, and last, respectively. p values are derived from a two-sided binomial test. (D) Positional distribution of PASs used in CLP1KO stem-cell-derived motor neurons compared to CLP1WT controls. TSS, transcription start site; TTSs, transcription termination sites; K-S test. (E) Genome browser tracks (top) of CLP1KO and CLP1WT hESC-derived motor neuron 3′ end sequencing reads mapped to CPSF6 at a differentially used intronic polyadenylation (IPA) site (yellow, increased usage). Representative gel images are shown (bottom) with qRT-PCR validation values below; n = 3. (F) Genome browser tracks (top) of CLP1KO and CLP1WT hESC-derived motor neuron 3′ end sequencing reads mapped to the PCF11 gene (yellow, increased usage). Representative gel images (bottom) are shown with qRT-PCR validation values below; n = 3. (G) Co-immunoprecipitation of RNA polymerase II (RNAPII) in CLP1KO and CLP1WT hESC-derived motor neurons. Western blot of input and affinity purified proteins for cleavage and polyadenylation subcomplexes; (PCF11 [CFIIm], CPSF100 [CPSF], CstF64 [CstF], and CFIm68 [CFIm]). β-actin, loading control; *p < 0.05; n.s., non-significant (p > 0.05); two-sided Student’s t test, n = 3. See also Figure S2 and Data S1.
Figure 3.
Figure 3.. iPSC-derived motor neurons from patients with PCH10 precociously differentiate, resulting in reduced neuronal density at maturity
(A) Study schematic. Homozygous and heterozygous CLP1 p.R140H fibroblasts from patients with PCH10 and unaffected individuals, respectively, were re-programmed into iPSCs and differentiated into motor neurons, followed by transcriptomic analysis. (B) Representative images of iPSCs derived from affected and unaffected patients shown during motor neuron differentiation (left). Scale bars, 100 μm. MTT assay of motor neurons derived from affected and unaffected patients during differentiation is depicted (right). Two clonal lines per individual (biological replicates); n = 8 technical replicates; two-sided Student’s t test. (C) Immunostaining for OLIG2 and ISL1/2 in affected and unaffected motor neuron cultures during differentiation. d, day of differentiation; p, OLIG2+ statistics, p*, ISL1/2+ statistics; two-sided Student’s t test; n = 6, 20× fields-of-view per clone. Representative images are shown from two clonal lines per individual. Scale bars, 50 μm. (D) Co-immunostaining for OLIG2 and ISL1/2 in affected (A) and unaffected (U) motor neuron cultures at day 28; two-sided Student’s t test; n = 6, 20× field-of-view per clone. Representative images are shown from two clonal lines per individual. Scale bars, 50 μm. (E) Co-immunostaining for OLIG2 and CC3 at day 22 of differentiation in affected (A) and unaffected (U) cultures; two-sided Student’s t test; n = 6, 20× field-of-view per clone. Representative images are shown; two clonal lines per individual. Scale bars, 50 μm. (F) OLIG2 and PHH3 co-immunostaining in affected (A) and unaffected (U) motor neuron cultures during differentiation; two-sided Student’s t test. n = 6, 20× field-of-view per clone. Representative images are shown from two clonal lines per individual. Scale bars, 50 μm. (G) PHH3 immunostaining with DAPI in affected and unaffected cultures at day 28 of differentiation; two-sided Student’s t test. n = 6, 20× field-of-view per clone. Representative images are shown from two clonal lines per individual. Scale bars, 50 mm. See also Figure S3.
Figure 4.
Figure 4.. Motor neurons derived from PCH10 patient iPSCs display suppression of proximal polyadenylation and reduced mRNA isoform diversity
(A) Novel and previously annotated PASs in PCH10 patient versus control iPSC-derived motor neurons binned by intragenic position. 3′ UTR subdivisions are “F,” “S,” “M,” and “L” for first, single, middle, and last, respectively. Intergenic corresponds to ≥ 10 kb beyond the annotated end of genes. (B) M-A plot (top) of PASs detected in affected motor neurons compared to unaffected controls; red points indicate an adjusted p value < 0.05. Quantification of sites with increased and decreased usage is shown (bottom); two-sided binomial test. (C) APA events binned by intragenic position in affected and unaffected motor neurons. 3′ UTR subdivisions are “F,” “S,” “M,” and “L” for first, single, middle, and last, respectively. p values are derived from a two-sided binomial test. (D) Positional distribution of PASs in affected and unaffected motor neurons. TTS, transcription termination site; TSS, transcription start site. K-S test. (E) Positional motif enrichment of PASs with increased usage (left) and decreased usage (right) in affected versus unaffected iPSC-derived motor neurons. Plots are centered on the cleavage site. (F) Co-immunoprecipitation of RNAPII in affected and unaffected iPSC-derived motor neurons for association of the cleavage and polyadenylation (CPA) subcomplexes PCF11 (CFIIm), CPSF100 (CPSF), CstF64 (CstF), and CFIm68 (CFIm). β-actin, loading control; *p < 0.05; n.s., non-significant (p > 0.05); two-sided Student’s t test; n = 3. See also Figure S4 and Data S1.
Figure 5.
Figure 5.. PCH10-patient iPSC-derived motor neurons show broad transcriptomic dysregulation
(A) Transcriptomic events detected by bioinformatic analysis of RNA sequencing of unaffected and affected motor neurons (bar graph). n = 2 unaffected and n = 2 affected clonal replicates. Alternative exon events are cassette exons showing differential inclusion (“Up”) or exclusion (“Down”). (B) Venn diagram of overlapping genes with mRNA processing events or differential expression. DGE, differential gene expression; APA, alternative poly-adenylation. p = 9.4e–154, likelihood ratio test. (C) Normalized gene position of differentially used splice acceptor sites in affected versus unaffected motor neurons; Wilcoxon rank sum test; TSS, transcription start site; TTS, transcription termination site. Whiskers extend the full range of the data. (D) APA events with gene expression changes by intragenic position. Correlation, two-sided binomial test. 3′ UTR subdivisions are “F,” “S,” “M,” and “L” for first, single, middle, and last, respectively. (E) Length of significantly differentially expressed genes colored by adjusted p value. (F) Genome-wide correlation of gene length and number of annotated IPA sites from RNA sequencing of two independent iPSC-derived motor neuron clones per individual. n = 40,619 intron-containing genes; default ggplot geom_smooth trendline; Pearson r correlation test; x axis in log10 base pairs. (G) Violin plot (top) of gene length for differentially expressed genes with or without annotated IPA sites; quantiles drawn at 25%, 50%, and 75% of data density; Welch’s t test; y axis in log10 base pairs. (H) Genome browser tracks of affected (A1, A2) and unaffected (U2, U3) iPSC-derived motor neuron RNA-sequencing and PAC-sequencing reads mapped to CAMTA1, decreased IPA (blue), increased distal 3′ UTR polyadenylation (yellow). RPM, reads per million. A subset of representative isoforms are shown. Representative gel images with qRT-PCR validation values are shown below; n = 3. Western blot (right) for CAMTA1 in CLP1KO and CLP1WT H9 hESC-derived motor neurons. β-actin, loading control. See also Figures S5 and S6 and Data S1.
Figure 6.
Figure 6.. Enrichment analysis of differentially expressed genes with APA in PCH10 patient iPSC-derived motor neurons predicts neuronal dysfunction
(A) ClueGO visualization of biological processes in differentially expressed genes with alternative polyadenylation in affected motor neurons compared to unaffected controls. (B) Top five genes ranked by adjusted p value from the six GO term clusters. See also Figure S7 and Data S1.
Figure 7.
Figure 7.. CLP1 p.R140H homozygous mutant mice model motor neuron dysfunction and show correlated gene expression changes to motor neurons derived from PCH10 patient iPSCs
(A) Immunofluorescence staining of control and homozygous Clp1 p.R140H (Clp1R140H/R140H) mutant diaphragms at P0 for presynaptic (neurofilament) and postsynaptic (α-bungarotoxin) markers; ImageJ tracing (left). Quantification; α-bungarotoxin, red, area: 1.00 ± SD 0.134 versus 0.959 ± SD 0.105; n = 3 mice per genotype. Scale bars, 1 mm. (B) Control and Clp1R140H/R140H neuromuscular junction (NMJ) patterning is shown by α-bungarotoxin staining at P30. Scale bars, 1 mm. (C) High-magnification images of immunofluorescence staining for presynaptic (GFP) and postsynaptic (α-bungarotoxin) markers in ChAT-GFP;Clp1R140H/R140H mice compared to control littermates at P30. Scale bars, 100 μm. (D) Quantification of NMJ size. Boxplot represents the distribution of average NMJ area for n = 3 mice per genotype, individual points represent the average NMJ area for 6 fields-of-view from a single diaphragm. Whiskers extend the full range of the data; two-sided Student’s t test. (E) Quantification of presynaptic (GFP) and postsynaptic (α-bungarotoxin) markers at diaphragm NMJs in control and ChAT-GFP;Clp1R140H/R140H mice at P30. Boxplot represents the distribution of colocalization coefficients for n = 3 mice per genotype, individual points represent the Pearson r (no threshold) for 6 NMJs from 4 fields-of-view from a single diaphragm. Whiskers extend the full range of the data, excluding outliers (>1.5× interquartile range); two-sided Student’s t test. (F and G) Stride length of 3-, 4-, and 5-month-old Clp1R140H/R140H mice compared to wild-type sex-matched littermates. Representative images of strides (F) from 4-month-old male mice. Scale bars, 1 cm. Data in (G) are mean values ± SEM, n = 4 mice per genotype and age; two-sided Student’s t test. (H) Schematic of experimental design for in vivo gene expression validation. e, embryonic day; FACS, fluorescence activated cell sorting. (I) qRT-PCR of FACS and whole embryonic spinal cords for motor neuron markers, Hb9/Mnx1 and Isl1; two-sided Student’s t test, n = 3. (J) Scatterplot correlation of differential expression for genes assessed by qRT-PCR from PCH10-patient-derived motor neurons versus Clp1R140H/R140H mouse primary spinal motor neurons compared to controls (CLP1 p.R140H heterozygous individuals or mice), n = 3. Pearson r = 0.61. See also Figure S8 and Data S1.
Figure 8.
Figure 8.. Loss of mRNA isoform diversity is a shared transcriptomic signature among neurodegenerative diseases
(A) APA events detected in mRNA 3′ end sequencing datasets from autopsy frontal cortex tissues of patients with myotonic dystrophy type 1 (DM1); two-sided binomial test. PAS, poly-adenylation site. (B) The aggregate normalized positional distribution of DM1 APA events within gene bodies; K-S test. (C) APA events detected in mRNA 3′ end sequencing from autopsy frontal cortex tissues of patients with myotonic dystrophy type 2 (DM2); two-sided binomial test. (D) The aggregate normalized positional distribution of DM2 APA events within gene bodies; K-S test. (E) APA events detected in mRNA 3′ end sequencing datasets from autopsy BA9 region tissues of patients with the sPD; two-sided binomial test. (F) The positional distribution of differential APA events within gene bodies in sPD tissues. (G) Model of neurodegeneration caused by 3′ end processing bias and limited isoform diversity. An example transcript can be cleaved in several places to produce mRNA isoforms with 3′ end diversity. Healthy neurons use a balance of isoforms, whereas diseased neurons show reduced isoform diversity with a proximal or distal cleavage bias.

Comment in

References

    1. Afgan E, Baker D, Batut B, van den Beek M, Bouvier D, Cech M, Chilton J, Clements D, Coraor N, Grüning BA, et al. (2018). The Galaxy platform for accessible, reproducible and collaborative biomedical analyses: 2018 update. Nucleic Acids Res 46, W537–W544. 10.1093/nar/gky379. - DOI - PMC - PubMed
    1. Alcott CE, Yalamanchili HK, Ji P, van der Heijden ME, Saltzman A, Elrod N, Lin A, Leng M, Bhatt B, Hao S, et al. (2020). Partial loss of CFIm25 causes learning deficits and aberrant neuronal alternative polyadenylation. Elife 9, e50895. 10.7554/eLife.50895. - DOI - PMC - PubMed
    1. Anders S, Reyes A, and Huber W. (2012). Detecting differential usage of exons from RNA-seq data. Genome Res 22, 2008–2017. 10.1101/gr.133744.111. - DOI - PMC - PubMed
    1. Bailey TL, Johnson J, Grant CE, and Noble WS (2015). The MEME Suite. Nucleic Acids Res 43, W39–W49. 10.1093/nar/gkv416. - DOI - PMC - PubMed
    1. Bailey TL, and Machanick P. (2012). Inferring direct DNA binding from ChIP-seq. Nucleic Acids Res 40, e128. 10.1093/nar/gks433. - DOI - PMC - PubMed

Publication types