Clinical Trial
. 2022 Feb 8;38(6):110337.
doi: 10.1016/j.celrep.2022.110337.

Dissecting Fc signatures of protection in neonates following maternal influenza vaccination in a placebo-controlled trial

Affiliations
Clinical Trial

Dissecting Fc signatures of protection in neonates following maternal influenza vaccination in a placebo-controlled trial

Carolyn M Boudreau et al. Cell Rep. .

Abstract

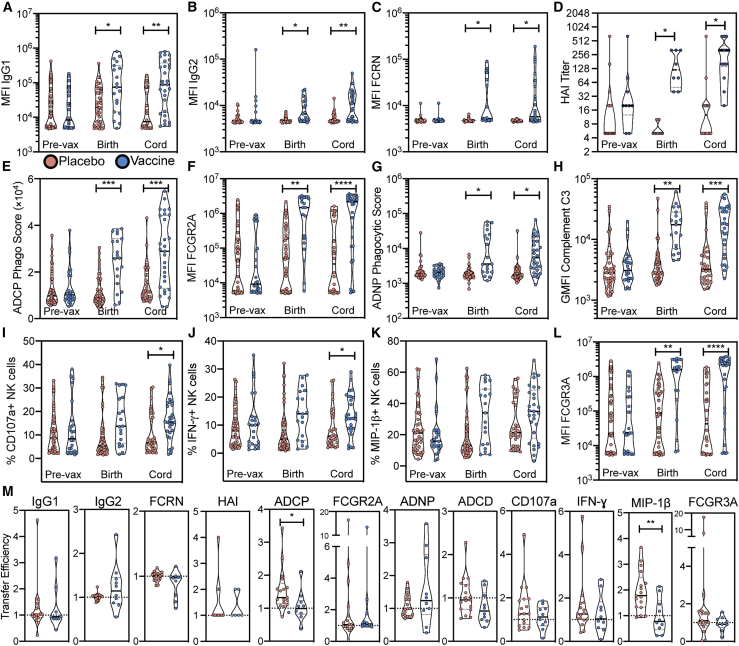
Influenza is an important cause of illness and morbidity for infants. Seasonal influenza vaccination during pregnancy aims to provide protection to mothers, but it can also provide immunity to infants. The precise influence of maternal vaccination on immunity in infants and how vaccine-elicited antibodies provide protection in some but not all infants is incompletely understood. We comprehensively profiled the transfer of functional antibodies and defined humoral factors contributing to immunity against influenza in a clinical trial of maternal influenza vaccination. Influenza-specific antibody subclass levels, Fc ɣ receptor (FCGR) binding levels, and antibody-dependent innate immune functions were all profiled in the mothers during pregnancy and at birth, as well as in cord blood. Vaccination increased influenza-specific antibody levels, antibody binding to FCGR, and specific antibody-dependent innate immune functions in both maternal and cord blood, with FCGR binding most enhanced via vaccination. Influenza-specific FCGR binding levels were lower in cord blood of infants who subsequently developed influenza infection. Collectively these data suggest that in addition to increased antibody amounts, the selective transfer of FCGR-binding antibodies contributes to the protective immune response in infants against influenza.

Keywords: Fc effector function; Fc receptor; adaptive immunity; antibody; influenza; innate immunity; maternal vaccination; placental transfer; vaccination.


Conflict of interest statement

Declaration of interests G.A. is a founder of SeromYx Systems, Inc.

Figures

None
Graphical abstract
Figure 1
Figure 1
Schematic of samples included in this study (A–D) The schematic (A) shows dyads with numbers of longitudinal samples across placebo and vaccinated groups. The schematic (B) shows the number of samples at each time point in each group. Numbers in red indicate samples for which HAI data is available. The schematic (C) shows dyads with number of longitudinal samples across control (uninfected infants) and case (infants who became infected). Schematic (D) shows number of samples at each time point in each group. Numbers in red indicate samples for which HAI data is available.
Figure 2
Figure 2
Vaccination boosts maternal and fetal antibodies but not transfer efficiency Violin plots (A–L) show isotype amounts, FCGR binding levels, HAI titers, or functional levels of H1 A/California/07/2009-specific antibodies pre-vaccination in maternal circulation, at the time of birth in maternal circulation, and in the cord blood at the time of birth. (A) H1 A/California/07/2009-specific IgG1 median fluorescence intensity (MFI) by Luminex bead-based assay. (B) H1 A/California/07/2009-specific IgG2 MFI by Luminex bead-based assay. (C) H1 A/California/07/2009-specific FCRN-binding antibody MFI by Luminex bead-based assay. (D) HAI titer. (E) Score of antibody-dependent cellular phagocytosis of immune complexed-H1 A/California/07/2009-coated beads. (F) H1 A/California/07/2009-specific FCGR2A-binding antibody MFI by Luminex bead-based assay. (G) Score of antibody-dependent neutrophil phagocytosis of immune complexed-H1 A/California/07/2009-coated beads. (H) MFI of antibody-dependent C3 deposition on immune complexed-influenza HA-coated beads. (I) HA-specific antibody-dependent CD107a expression by NK cells. (J) HA-specific antibody-dependent IFN-y expression by NK cells. (K) HA-specific antibody-dependent MIP-1b expression by NK cells. (L and M) H1 A/California/07/2009-specific FCGR3A-binding antibody MFI by Luminex bead-based assay. Each dot represents an individual and violins show the distribution of the group. Red dots represent pairs where the mother received a placebo injection, and blue dots represent pairs where the mother received seasonal influenza vaccination. (Pre-vax placebo n = 39; pre-vax vaccinee n = 24; time of birth placebo n = 41; time of birth vaccinee n = 29; cord placebo n = 30; cord vaccine n = 29.) Significance was determined by mixed-effects analysis followed by Sidak's multiple comparisons test between placebo and vaccine groups within each time point. Violin plots (M) show transfer efficiencies calculated as the ratio between cord blood experimental value and maternal experimental value at time of birth for a given antibody isotype, FCGR-binding, or function. (Placebo pairs n = 17; vaccinee pairs n = 10.) Significance was determined by Mann-Whitney U test. p < 0.05, ∗∗p < 0.01, ∗∗∗p < 0.001, ∗∗∗∗p < 0.0001. See also Figure S2.
Figure 3
Figure 3
FCGR binding levels separate vaccinee mother-child pairs from placebo recipients (A and C) Dot plots show partial least-squares discriminant analysis (PLSDA) scores along latent variable 1 (LV1) and latent variable 2 (LV2) for maternal samples at the time of birth (A) and cord blood samples (C). Models are significant (A: p < 0.001; C: p < 0.01) compared to permuted label models. PLSDA was modeled using least absolute shrinkage and selection operator (LASSO)-selected features out of the total pool of measured humoral biophysical and innate immune functional features. LV percentages represent the amount of total variance between samples captured by that LV. Bar plots show variable importance in protection (VIP) scores for the LASSO-selected features separating vaccinees from placebo recipients for maternal samples at the time of birth (B) and cord blood samples (D). VIP scores reflect the contribution of a feature across all latent variables. See also Figure S3.
Figure 4
Figure 4
FCGR binding levels separate infected infants from uninfected infants Violin plots (A–F) show isotype or FCGR binding levels of H3 A/Perth/16/2009-specific antibodies pre-vaccination, at the time of birth in maternal circulation, and in the cord blood at the time of birth. (A) H3 A/Perth/16/2009-specific IgG1 MFI by Luminex bead-based assay. (B) H3 A/Perth/16/2009-specific IgG2 MFI by Luminex bead-based assay. (C) H3 A/Perth/16/2009-specific FCRN-binding antibody MFI by Luminex bead-based assay. (D) H3 A/Perth/16/2009-specific FCGR2A-binding antibody MFI by Luminex bead-based assay. (E) H3 A/Perth/16/2009-specific FCGR3A-binding antibody MFI by Luminex bead-based assay. (F–I) H3 A/Perth/16/2009-specific FCGR3A-binding antibody MFI by Luminex bead-based assay. Each dot represents an individual and violins show the distribution of the group. Purple dots represent pairs where the infant would not be infected with influenza in the first six months of life, and yellow dots represent pairs where the infant would be infected with influenza A/H3N2 in the first six months of life. (Pre-vax control n = 42; pre-vax case n = 21; time of birth control n = 40; time of birth case n = 20; cord control n = 39; cord case n = 20.) Significance was determined by mixed-effects analysis followed by Sidak's multiple comparisons test between placebo and vaccine groups within each time point. p < 0.05, p < 0.01. Dot plot (G) shows PLSDA scores along latent variable 1 (LV1) and latent variable 2 (LV2) for transfer efficiencies. (Control pairs n = 17; case pairs n = 7.) PLSDA model (G) is significant compared to a permuted label model (p = 0.02). PLSDA was modeled using LASSO-selected features out of the total pool of H3-specific transfer efficiencies. Bar plot (H) shows VIP scores for the LASSO-selected features separating H3N2-infected infant transfer efficiencies from uninfected infant transfer efficiencies. Correlation network (I) shows positive correlation between LASSO-selected features (thick borders) and their co-correlates with a significance cutoff for inclusion at false discovery rate (FDR)-corrected q values < 0.05. Purple boxes indicate FCGRs, blue boxes indicate FCRN, and pink boxes indicate IgG amounts. See also Figure S4.
Figure 5
Figure 5
Humoral intercorrelation in cord blood differentiates infected infants from uninfected infants (A–C) Flower plots (A) show average relative magnitude of measured humoral features within a time point (maternal pre-vaccination, maternal time of birth, and cord blood) and group (uninfected versus infected). # marks the wedges representing H1 CA/09 FCGR binding levels, as referenced in the text. Heat maps (B and C) show Spearman correlation coefficients for intercorrelations between measured antibody features. Within all features (except ADCD and antibody-dependent NK cell activation [ADNKA]) the five rows correspond to antigens specific for the five vaccine antigens: H1 A/California/07/2009, H3 A/Perth/16/2009, H3 A/Victoria/361/2011, B/Brisbane/06/2008, and B/Wisconsin/01/2010. ADCD and ADNKA were performed on pooled HA antigens, and ADNKA rows correspond to NK activation readouts: CD107a, IFN-ɣ, and MIP-1β. Matrices represent data for all cord blood samples pooled by infection outcome. For the subset of samples with HAI titers measured, matrix (C) represents Spearman correlation coefficients between HAI against vaccine strains (vertical) and antibody functional and biophysical features along the horizontal.
Figure 6
Figure 6
Vaccination strongly affects the protective humoral features in cord blood (A–C) PLSDA models were trained to distinguish between cord blood of infants who go on to be infected versus those who do not, using either all measured features (light blue) or just those features determined to distinguish between cords of infants whose mothers were vaccinated and those who were not as shown in Figure 2B (dark blue). Receiver operating characteristic curves for final models are represented in (A). Positive rates refer to the model's ability to correctly classify cords into infected or uninfected: a false positive indicates an incorrect designation as a case, where a true positive indicates a correct designation as a case. Model accuracy in identifying cords of infected versus uninfected infants was tested for each fold- and replicate-specific test dataset. These values are represented in the violin plot (B). Significance was determined by Mann-Whitney U test (∗∗∗p < 0.001). Bar plot (C) shows VIP scores for the vaccine LASSO-selected features separating infected infant transfer efficiencies from uninfected infant transfer efficiencies. Bars in yellow show features enriched in infected infants, while bars in purple show features enriched in uninfected infants.

References

    1. Ackerman M.E., Moldt B., Wyatt R.T., Dugast A.S., McAndrew E., Tsoukas S., Jost S., Berger C.T., Sciaranghella G., Liu Q., et al. A robust, high-throughput assay to determine the phagocytic activity of clinical antibody samples. J. Immunol. Methods. 2011;366:8–19. - PMC - PubMed
    1. Ackerman M.E., Das J., Pittala S., Broge T., Linde C., Suscovich T.J., Brown E.P., Bradley T., Natarajan H., Lin S., et al. Route of immunization defines multiple mechanisms of vaccine-mediated protection against SIV. Nat. Med. 2018;24:1590–1598. - PMC - PubMed
    1. Akbulut H., Çelik A., Akbulut A., Ayar A. Placental transfer of total IgG and IgG subclasses in a Turkis population living in eastern Anatolia. Nobel Med. 2012;8:59–64.
    1. Amin A.B., Nunes M.C., Tapia M.D., Madhi S.A., Cutland C.L., Wairagkar N., Omer S.B. Immunogenicity of influenza vaccines administered to pregnant women in randomized clinical trials in Mali and South Africa. Vaccine. 2020;38:6478–6483. - PMC - PubMed
    1. Basnet R., Hinderaker S.G., Enarson D., Malla P., Mørkve O. Delay in the diagnosis of tuberculosis in Nepal. BMC Public Health. 2009;9:1–5. - PMC - PubMed

Publication types