. 2022 Feb 9;12(1):14.
doi: 10.1186/s13578-022-00748-z.

Pseudomonas aeruginosa modulates alginate biosynthesis and type VI secretion system in two critically ill COVID-19 patients

Affiliations

Pseudomonas aeruginosa modulates alginate biosynthesis and type VI secretion system in two critically ill COVID-19 patients

Jiuxin Qu et al. Cell Biosci. .

Abstract

Background: COVID-19 pneumonia has caused huge impact on the health of infected patients and associated with high morbidity and mortality. Shift in the lung microbial ecology upon such viral infection often worsens the disease and increases host susceptibility to superinfections. Bacterial superinfection contributes to the aggravation of COVID-19 and poses a great challenge to clinical treatments. An in-depth investigation on superinfecting bacteria in COVID-19 patients might facilitate understanding of lung microenvironment post virus infections and superinfection mechanism.

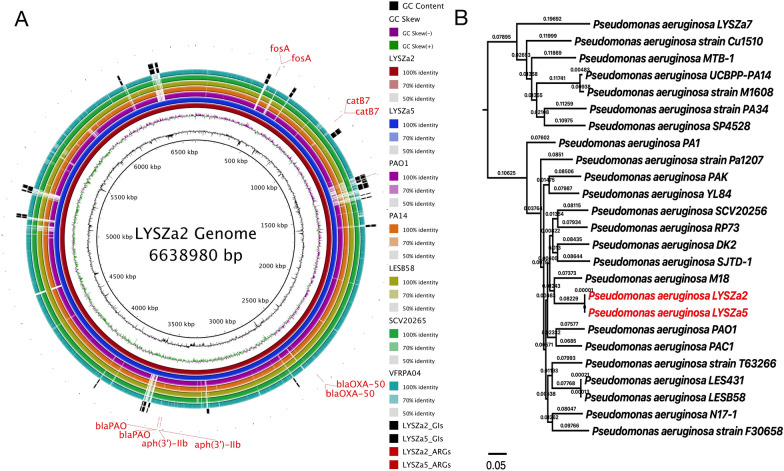
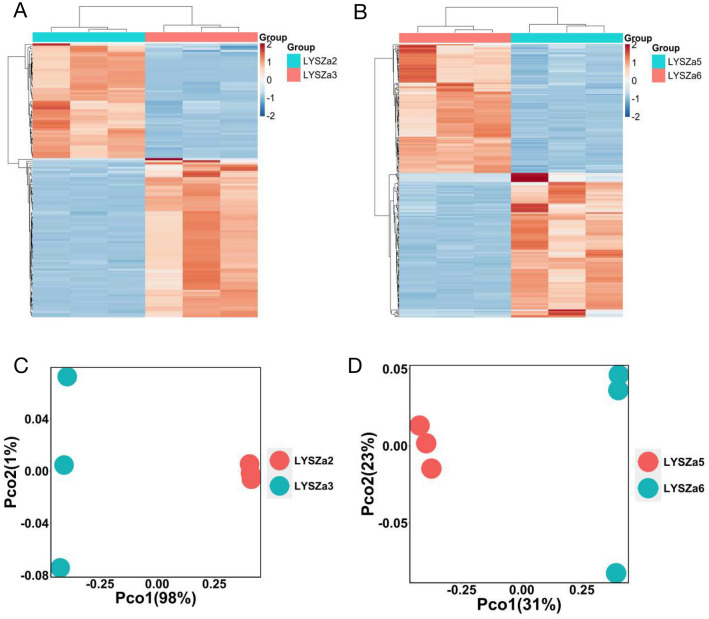
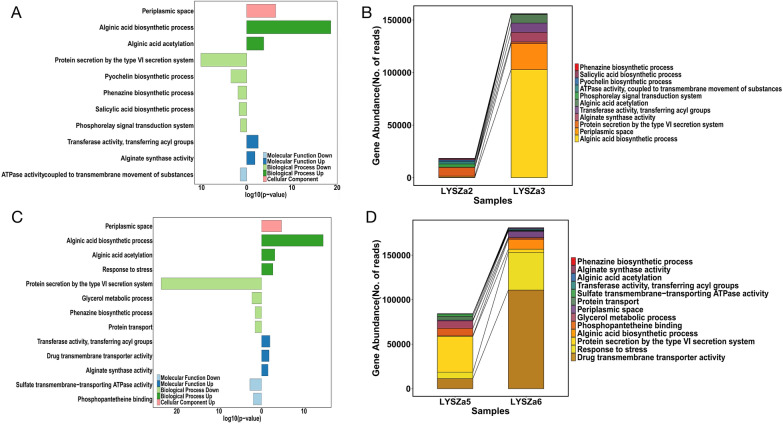
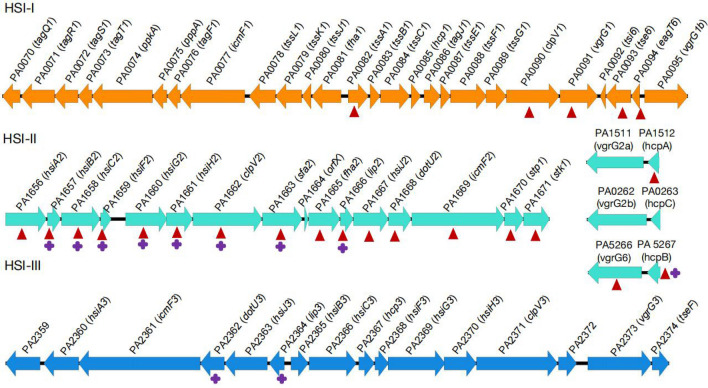
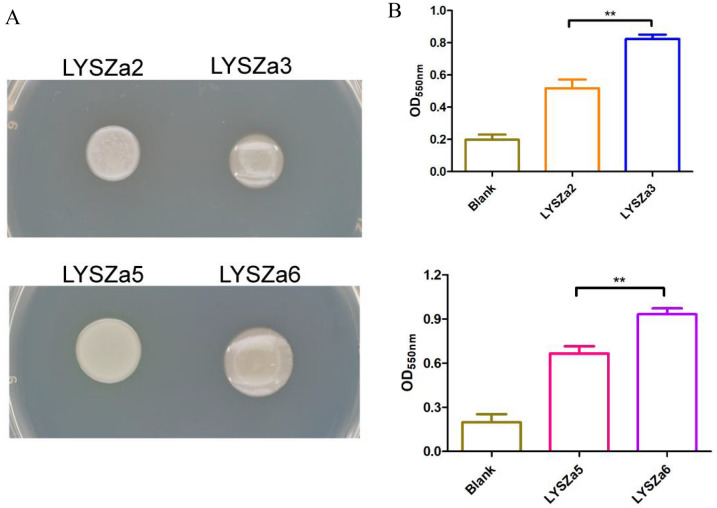
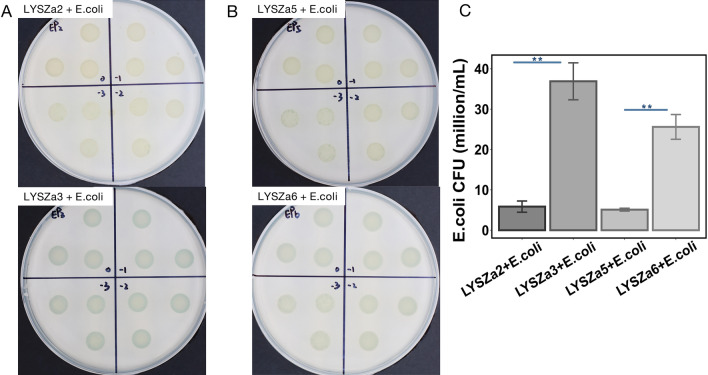
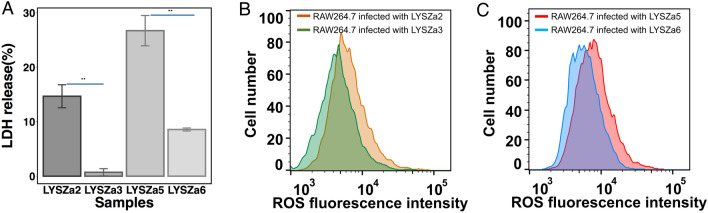
Results: We analyzed the adaptation of two pairs of P. aeruginosa strains with the same MLST type isolated from two critical COVID-19 patients by combining sequencing analysis and phenotypic assays. Both P. aeruginosa strains were found to turn on alginate biosynthesis and attenuate type VI secretion system (T6SS) during short-term colonization in the COVID-19 patients, which results in excessive biofilm formation and virulence reduction-two distinct markers for chronic infections. The macrophage cytotoxicity test and intracellular reactive oxygen species measurement confirmed that the adapted P. aeruginosa strains reduced their virulence towards host cells and are better to escape from host immune clearance than their ancestors.

Conclusion: Our study suggests that SARS-CoV-2 infection can create a lung environment that allow rapid adaptive evolution of bacterial pathogens with genetic traits suitable for chronic infections.

Keywords: Bacterial superinfection; Biofilm; COVID-19; Pseudomonas aeruginosa; Type VI Secretion System.


Conflict of interest statement

The authors declare that they have no competing interests.

Figures

Fig. 1
Fig. 1
Ring Plot and Phylogenetic tree of LYSZa2 and LYSZa5. A Ring plot of LYSZa2 and LYSZa5 comparing with other P. aeruginosa genomes. From the innermost, ring 1: GC content (black); ring 2: GC skew (purple/green); ring 3: LYSZa2(dark red); ring 4: LYSZa5(navy); ring 5: PAO1 lab reference strain (violet); ring 6: PA14 clinical virulent strain (orange); ring 7: LESB58 hypervirulent clinical strain from CF patient (olive); ring 8: SCV20265 small colony variant strain (light green); ring 9: VRFPA04 multidrug resistant strain from keratitis patient(cyan); ring 10 and 11: GIs on LYSZa2 and LYSZa5 (black); ring 12 and 13: ARGs on LYSZa2 and LYSZa5 (red); B Phylogenetic tree constructed using LYSZa2 and LYSZa5 genomes and 23 other P. aeruginosa genomes based on core genome alignment, LYSZa2 and LYSZa5 are highlighted in red
Fig. 2
Fig. 2
Heatmaps and PCoA plots of DEGs between the ancestry isolates and the progeny isolates. A Heatmap of significant DEGs in LYSZa3 compared to LYSZa2; B heatmap of significant DEGs in LYSZa6 compared to LYSZa5; C PCoA plots of LYSZa3 group and LYSZa2 group based on DEGs using Bray Curtis dissimilarity; D PCoA plots of LYSZa6 group and LYSZa5 group based on DEGs using Bray Curtis dissimilarity
Fig. 3
Fig. 3
GO enrichment analysis and variation in gene abundance in each GO. A GO enriched in LYSZa3 compared to LYSZa2, bars towards right-hand side showing genes assigned to the functions were upregulated, bars towards left-hand side showing genes assigned to the functions were downregulated, up- and down-regulation are indicated in the legend as well, p-value < 0.05; B Variation in gene abundance involved in the enriched GO functions listed in A in LYSZa2 and LYSZa3; C GO enriched in LYSZa6 compared to LYSZa5, bars towards right-hand side showing genes assigned to the functions were upregulated, bars towards left-hand side showing genes assigned to the functions were downregulated, up- and down-regulation are indicated in the legend as well, p-value < 0.05; D Variation in gene abundance involved in the enriched GO functions listed in C in LYSZa5 and LYSZa6
Fig. 4
Fig. 4
Schematic figure of HSI-I, HSI-II and HSI-III gene clusters. Genes downregulated in LYSZa3 are denoted by purple crosses; genes downregulated in LYSZa6 are denoted by red triangles. Gene name was obtained from Pseudomonas Genome Database [49]
Fig. 5
Fig. 5
Phenotypic analysis. A Colony morphologies of the isolates; B Biofilm quantification tests by crystal violet staining, **p-value < 0.05; Upper panel: biofilm quantification test of LYSZa2 and LYSZa3, lower panel: biofilm quantification test of LYSZa5 and LYSZa6
Fig. 6
Fig. 6
Bacterial competition assay between the isolates and E. coli. Blue pigment intensity indicates the survival of E. coli. A Upper panel: competition between LYSZa2 and E. coli; lower panel: competition between LYSZa3 and E. coli, number in each section denotes the dilution factor, ranged from 100 to 10–3; B Upper panel: competition between LYSZa5 and E. coli; lower panel: competition between LYSZa6 and E. coli, number in each section denotes the dilution factor, ranged from 100 to 10–3; C Counts of E. coli CFU left in each competition, **p-value < 0.05
Fig. 7
Fig. 7
Macrophage cytotoxicity and ROS production of the ancestry isolates and the progeny isolates. A The cytotoxicity effect against macrophage cells of LYSZa2, LYSZa3, LYSZa5 and LYSZa6 is illustrated by the percent of LDH released, **p-value < 0.05. B The intracellular ROS levels in RAW264.7 cells at 3 h after phagocytosis of LYSZa2, LYSZa3 and LYSZa5, LYSZa6 (C)

Similar articles

Cited by

References

    1. Veras FP, et al. SARS-CoV-2-triggered neutrophil extracellular traps mediate COVID-19 pathology. J Exp Med. 2020;217(12):e20201129. - PMC - PubMed
    1. Mehta P, et al. COVID-19: consider cytokine storm syndromes and immunosuppression. Lancet. 2020;395(10229):1033–1034. - PMC - PubMed
    1. Hanada S, et al. Respiratory viral infection-induced microbiome alterations and secondary bacterial pneumonia. Front Immunol. 2018;9:2640. - PMC - PubMed
    1. Rawson TM, et al. Bacterial and fungal coinfection in individuals with coronavirus: a rapid review to support COVID-19 antimicrobial prescribing. Clin Infect Dis. 2020;71(9):2459–2468. - PMC - PubMed
    1. Wang L, et al. Coronavirus disease 2019 in elderly patients: Characteristics and prognostic factors based on 4-week follow-up. J Infect. 2020;80(6):639–645. - PMC - PubMed

LinkOut - more resources