. 2022 Feb 10;11(1):9.
doi: 10.1186/s40035-022-00284-3.

Adenosine A1 receptor ligands bind to α-synuclein: implications for α-synuclein misfolding and α-synucleinopathy in Parkinson's disease

Affiliations

Adenosine A1 receptor ligands bind to α-synuclein: implications for α-synuclein misfolding and α-synucleinopathy in Parkinson's disease

Elisabet Jakova et al. Transl Neurodegener. .

Abstract

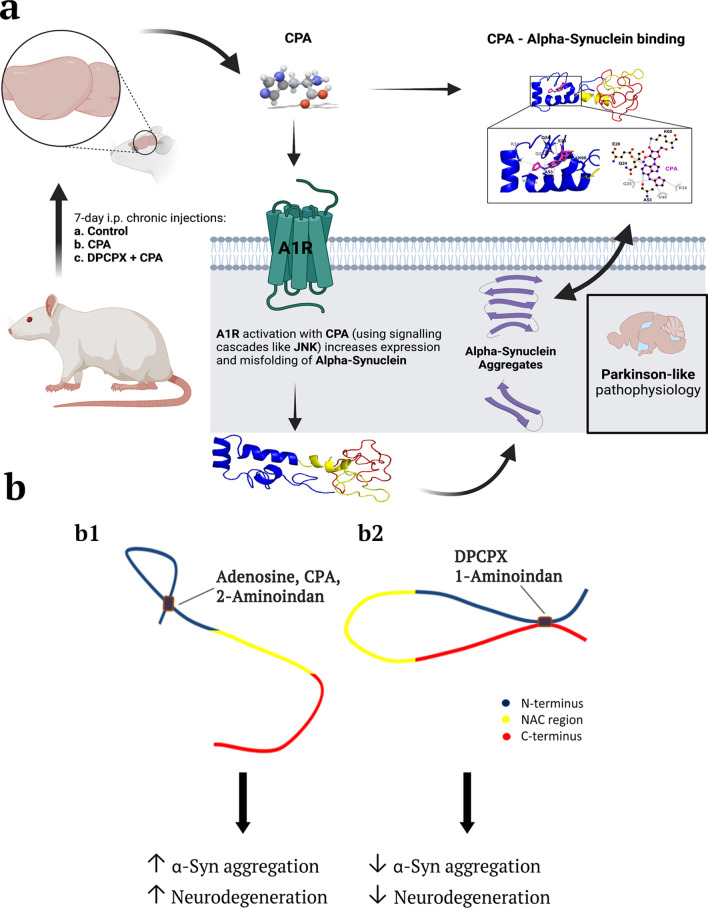
Background: Accumulating α-synuclein (α-syn) aggregates in neurons and glial cells are the staples of many synucleinopathy disorders, such as Parkinson's disease (PD). Since brain adenosine becomes greatly elevated in ageing brains and chronic adenosine A1 receptor (A1R) stimulation leads to neurodegeneration, we determined whether adenosine or A1R receptor ligands mimic the action of known compounds that promote α-syn aggregation (e.g., the amphetamine analogue 2-aminoindan) or inhibit α-syn aggregation (e.g., Rasagiline metabolite 1-aminoindan). In the present study, we determined whether adenosine, A1R receptor agonist N6-Cyclopentyladenosine (CPA) and antagonist 8-cyclopentyl-1,3-dipropylxanthine (DPCPX) could directly interact with α-syn to modulate α-syn aggregation and neurodegeneration of dopaminergic neurons in the substantia nigra (SN).

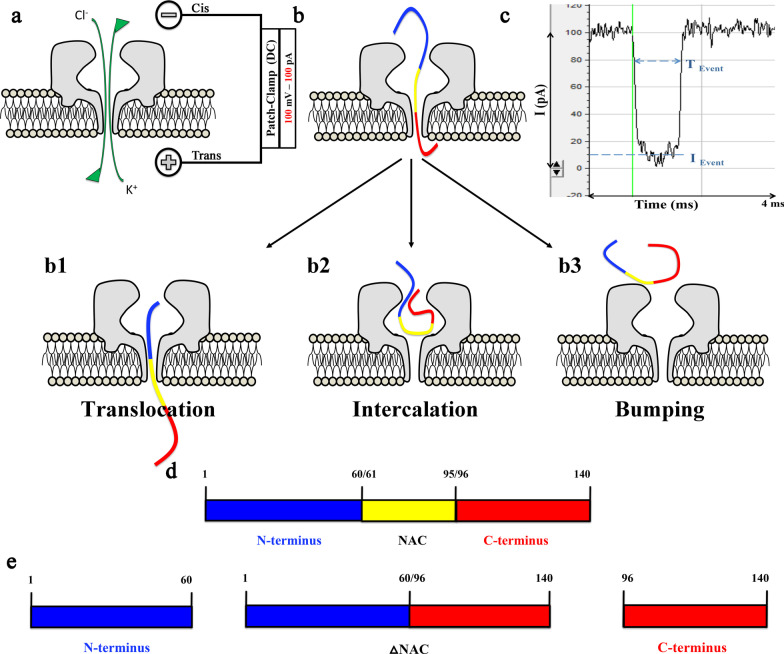
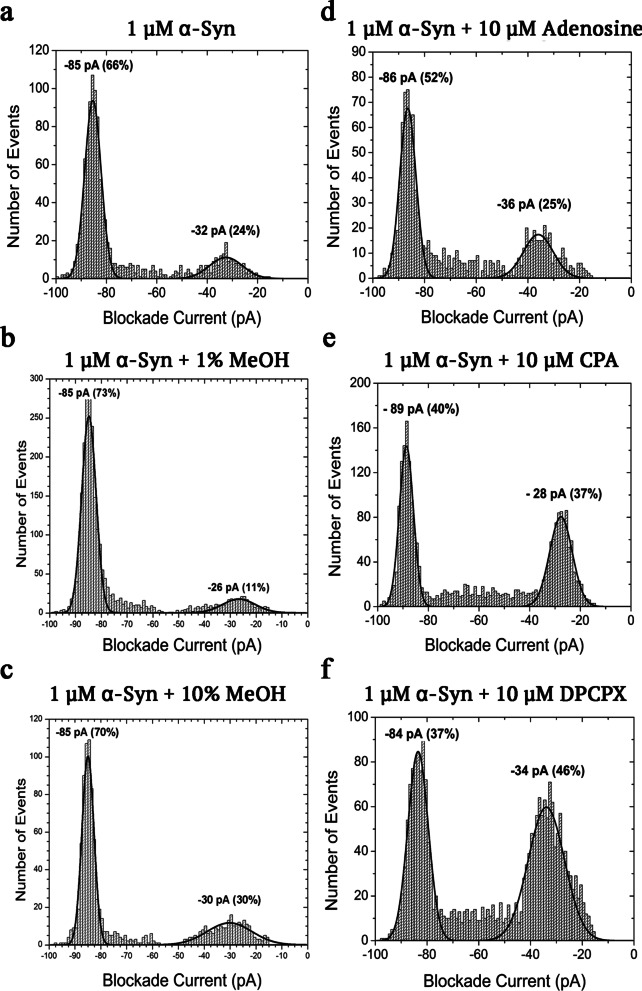
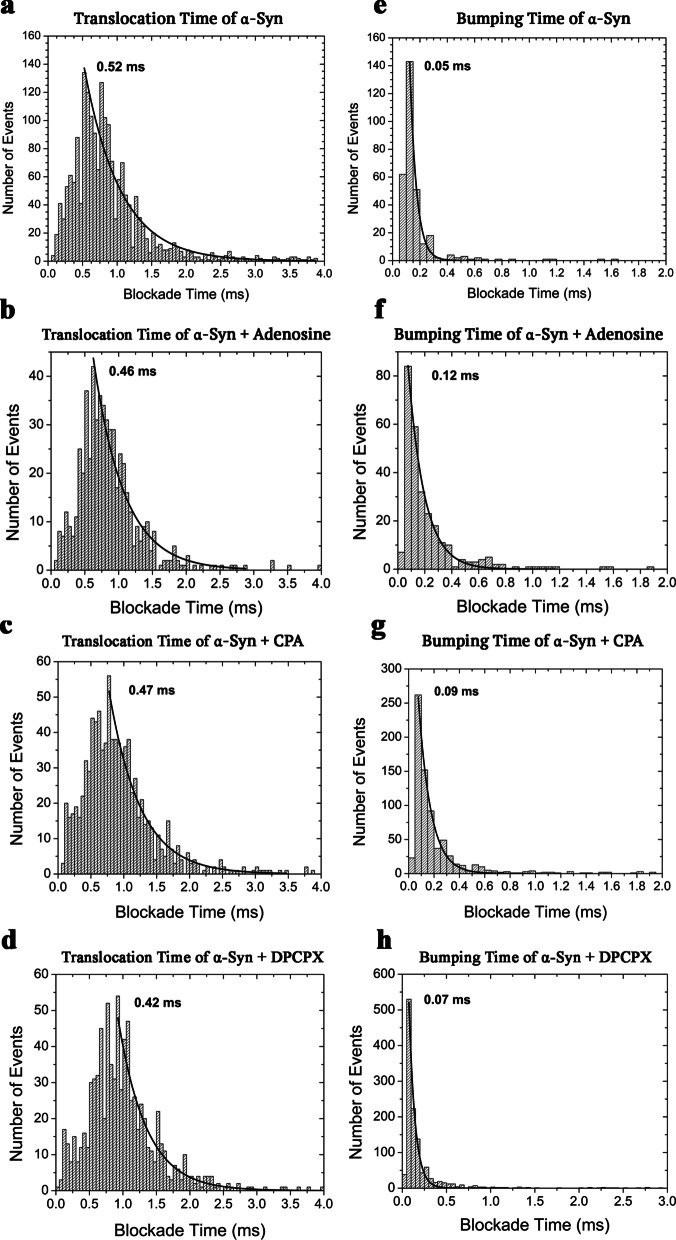
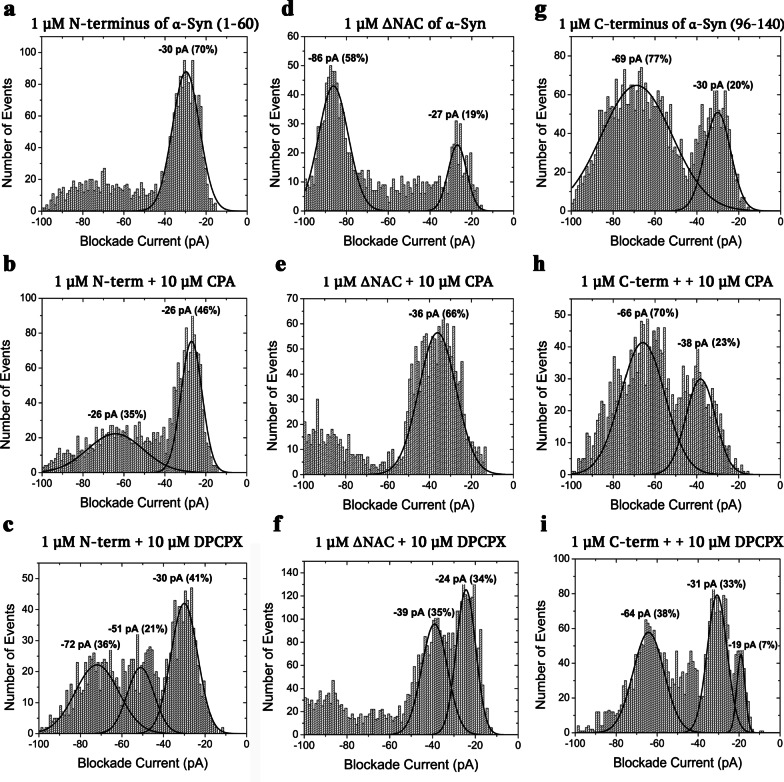
Methods: Nanopore analysis and molecular docking were used to test the binding properties of CPA and DPCPX with α-syn in vitro. Sprague-Dawley rats were administered with 7-day intraperitoneal injections of the A1R ligands and 1- and 2-aminoindan, and levels of α-syn aggregation and neurodegeneration were examined in the SN pars compacta and hippocampal regions using confocal imaging and Western blotting.

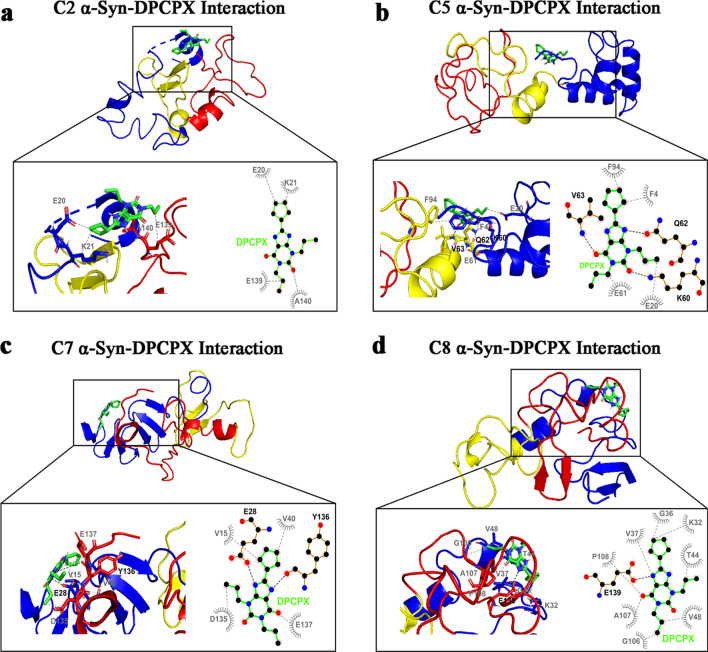
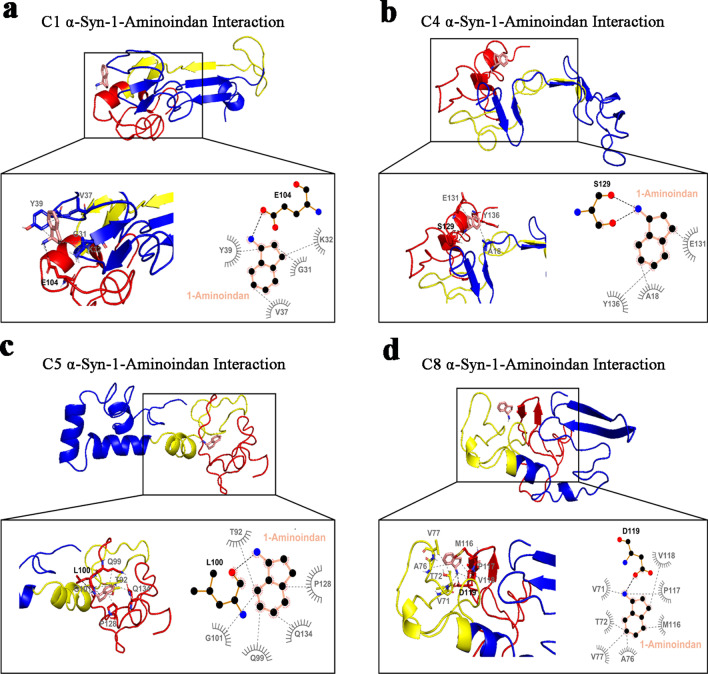
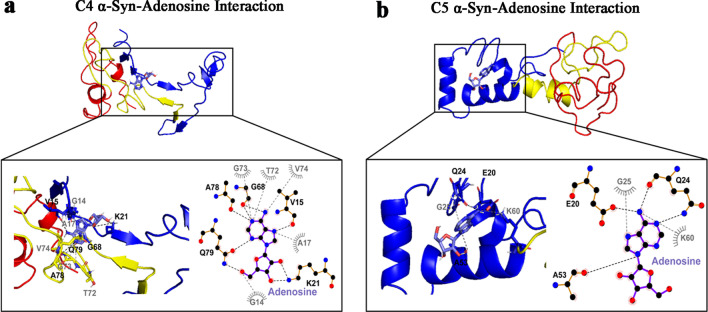
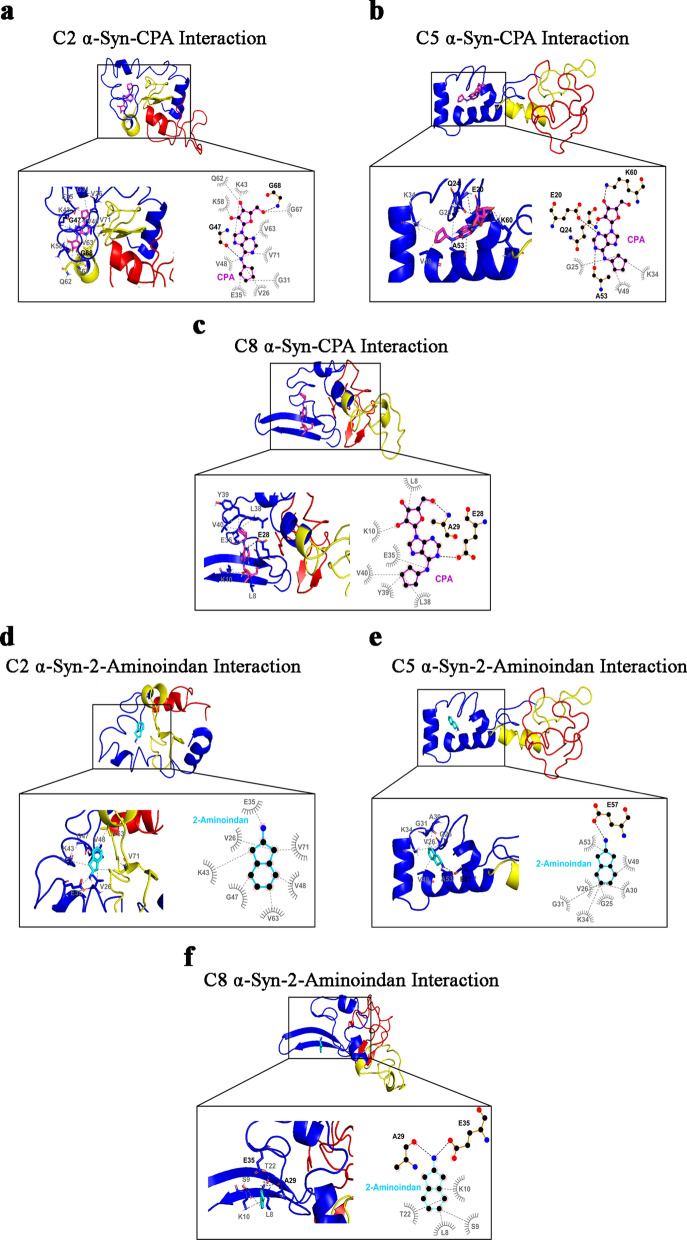
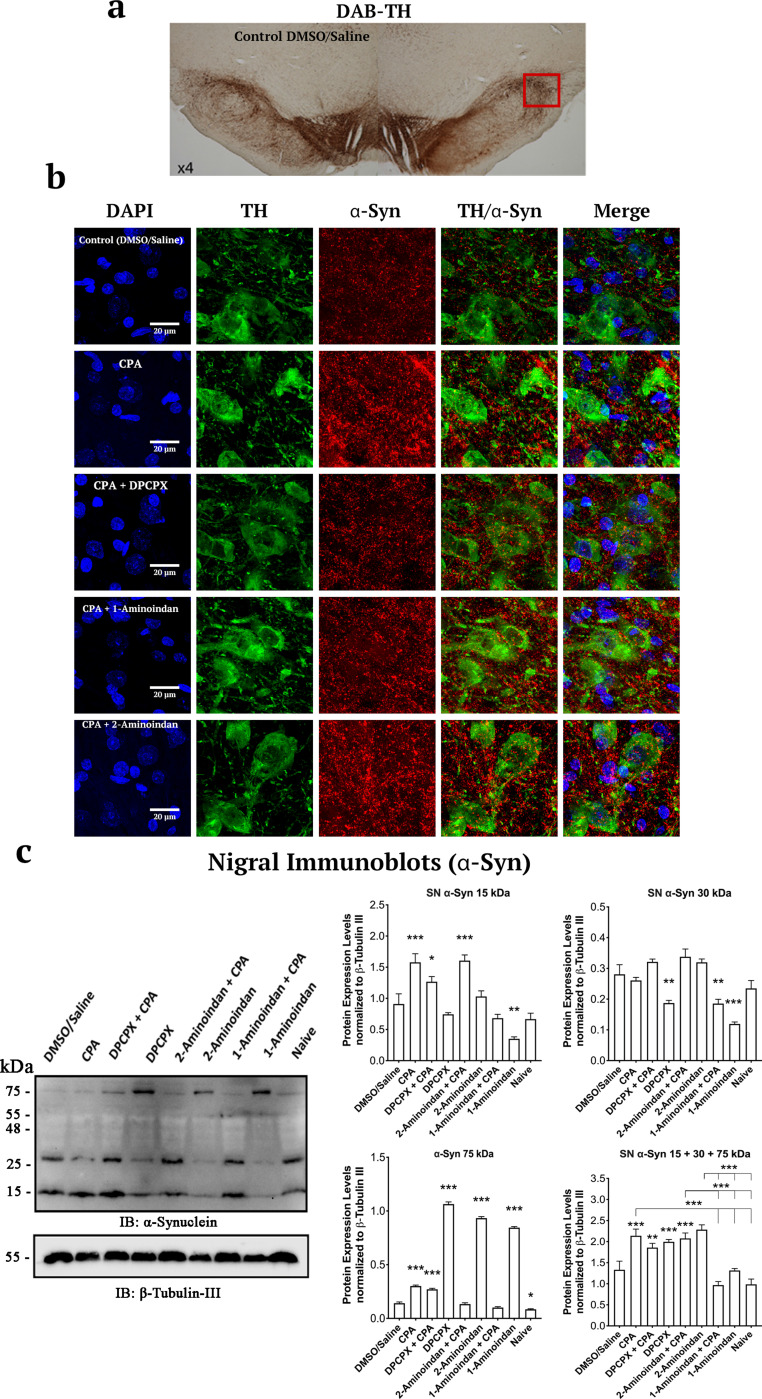
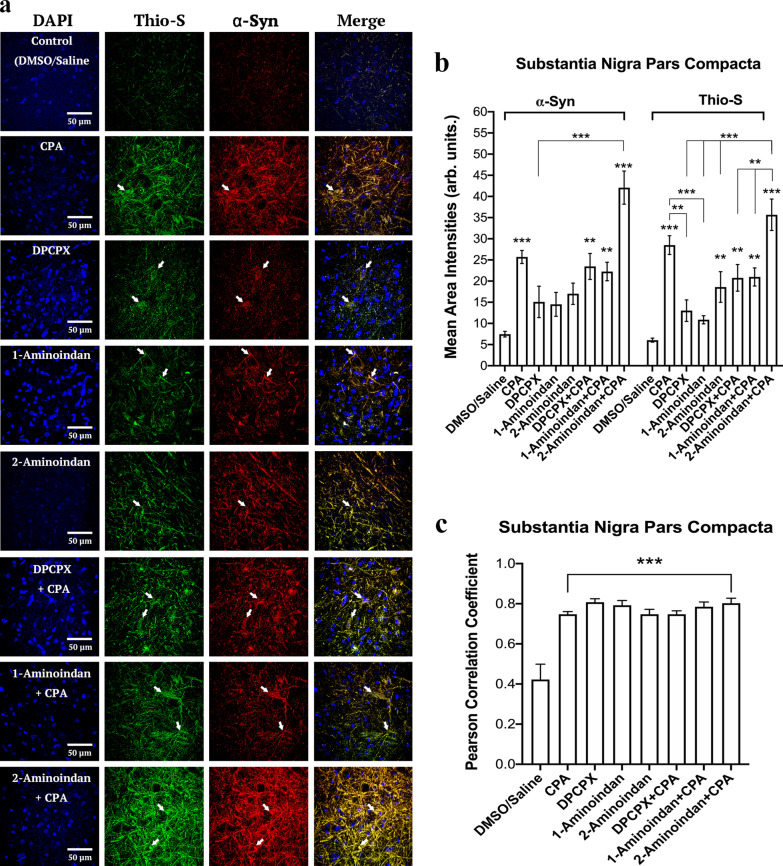
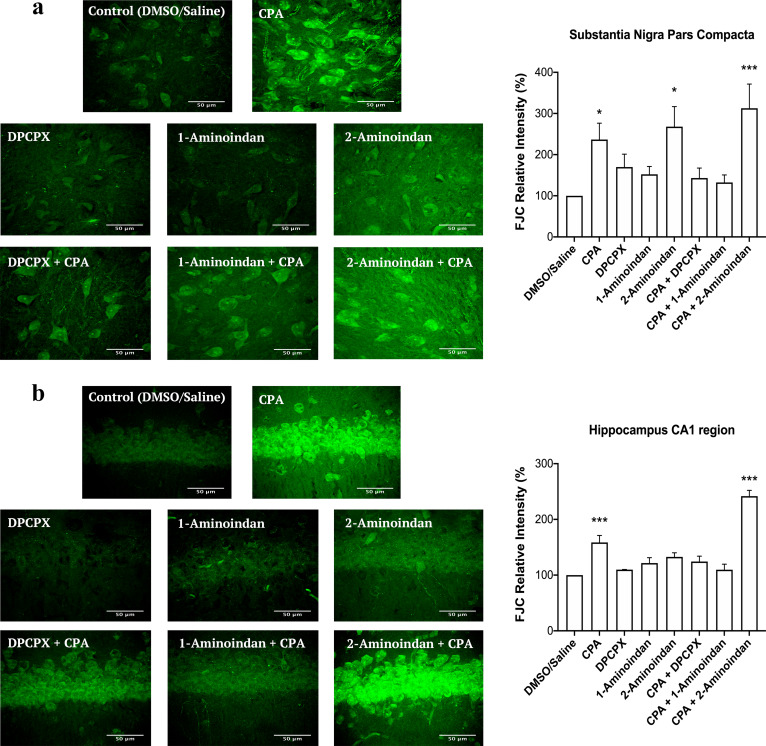
Results: Using nanopore analysis, we showed that the A1R agonists (CPA and adenosine) interacted with the N-terminus of α-syn, similar to 2-aminoindan, which is expected to promote a "knot" conformation and α-syn misfolding. In contrast, the A1R antagonist DPCPX interacted with the N- and C-termini of α-syn, similar to 1-aminoindan, which is expected to promote a "loop" conformation that prevents α-syn misfolding. Molecular docking studies revealed that adenosine, CPA and 2-aminoindan interacted with the hydrophobic core of α-syn N-terminus, whereas DPCPX and 1-aminoindan showed direct binding to the N- and C-terminal hydrophobic pockets. Confocal imaging and Western blot analyses revealed that chronic treatments with CPA alone or in combination with 2-aminoindan increased α-syn expression/aggregation and neurodegeneration in both SN pars compacta and hippocampus. In contrast, DPCPX and 1-aminoindan attenuated the CPA-induced α-syn expression/aggregation and neurodegeneration in SN and hippocampus.

Conclusions: The results indicate that A1R agonists and drugs promoting a "knot" conformation of α-syn can cause α-synucleinopathy and increase neuronal degeneration, whereas A1R antagonists and drugs promoting a "loop" conformation of α-syn can be harnessed for possible neuroprotective therapies to decrease α-synucleinopathy in PD.

Keywords: 1-aminoindan; 2-aminoindan; 8-cyclopentyl-1,3-dipropylxanthine; Adenosine A1 receptor; Alpha-synucleinopathy; N6-cyclopentyladenosine; Neurodegeneration; Neuroprotection; Protein misfolding.


Conflict of interest statement

The authors declare that they have no competing interests.

Figures

Fig. 1
Fig. 1
Nanopore analysis setup and α-synuclein (α-syn) interaction with the α-Hemolysin pore. a The patch-clamp setup at 100 mV direct current (DC) allows the ions to flow in the pore and create an ionic current b The interruption of the current when α-syn interacts with the pore forming three distinguishable blockade current events: b1 Translocation events, where α-syn goes through the pore causing a large current blockade (as seen in Fig. 1 c); b2 Intercalation events, where α-syn is trapped in the pore entrance, but will diffuse back after a period of time causing an intermediate current blockade; b3 Bumping events, where α-syn approaches the pore, but diffuses away without entering causing a small current blockade. c Disruption of the blockade current and time caused by α-syn when the protein translocates the pore. d Full sequence of α-syn. e The domains of α-syn used in the nanopore setup consisting of: N-terminus (blue); ΔNAC, the entire sequence of α-synuclein without the non-amyloid β-component region (blue and red); and C-terminus (red)
Fig. 2
Fig. 2
Representative blockade current histograms of 1 μM α-synuclein alone (a) and with 1% methanol (b), 10% methanol (c), 10 μM adenosine (d), 10 μM CPA (e) and 10 μM DPCPX (f) at 100 mV DC, indicating binding to the protein. Each experiment was run in triplicates and the standard error of the mean estimated for the percentage of events was <  ± 10% (see Table 1 and Additional file 1: Table S1)
Fig. 3
Fig. 3
Representative blockade time profiles of translocation (ad) and bumping events (eh) for 1 μM α-synuclein alone and in the presence of 10 μM adenosine, 10 μM CPA or 10 μM DPCPX. Each experiment was run in triplicates. For mean and SEM values of populations of translocation and bumping and blockade times in the absence or presence of adenosine, CPA or DPCPX, please see Table 1
Fig. 4
Fig. 4
Representative blockade current histograms of 10 μM CPA and 10 μM DPCPX with N-terminus (a–c), ΔNAC (d–f) and C-terminus (g–i) of α-synuclein at 100 mV DC. Each experiment was run in triplicates and the error estimated for the percentage of events was <  ± 10% (see Table 2)
Fig. 5
Fig. 5
Effects of adenosine A1 receptor (A1R) ligands on α-synuclein (α-syn) expression and folding patterns in in vivo and in vitro studies. a A1R agonist CPA (and adenosine) increases α-syn expression and aggregation in the rat substantia nigra. Nanopore analysis and molecular docking simulations predicted binding of A1R agonist CPA (and adenosine) to the N-terminus of α-syn, leaving the NAC domain intact and able to promote aggregation. b (b1) Adenosine, CPA and 2-aminoindan bind to and stabilize α-syn to adopt a “knot” conformation which has been shown to induce aggregation and neurodegeneration. In contrast (b2), DPCPX and 1-aminoindan bind to both the N- and C-termini of α-syn, which does not promote aggregation and neurodegeneration. Created using BioRender.com
Fig. 6
Fig. 6
Molecular docking simulation of α-synuclein (α-syn) structures C2 (a), C5 (b), C7 (c), and C8 (d) bound to DPCPX. Below full 3D representations show magnified binding pocket of α-syn and the locations of amino acid residues responsible for each drug binding. Bold black dashed lines and amino acid residues indicate hydrogen bonding, while the grey dashed lines and amino acid residues indicate hydrophobic interactions. Hydrogen bonding of DPCPX with both the N- and C-terminal amino acid residues is observed in C7 α-syn structure (c). DPCPX also forms hydrogen bond with either the N-terminal (C5 α-syn structure in b) or C-terminal amino acids (C8 α-syn structure in d) and also hydrophobic bonds with portions of the NAC region. N-and C-terminal binding of DPCPX is also observed without hydrogen bonding (C2 α-syn structure in a). The molecular docking study was carried out using Autodock Vina module implemented in PyRx tool. Protein and ligand interactions were analyzed and visualized through Pymol and LigPlot +
Fig. 7
Fig. 7
Molecular docking simulation of α-synuclein (α-syn) structures C1 (a), C4 (b), C5 (c) and C8 (d) bound to 1-aminoindan. Below full 3D representations show the magnified binding domains of α-syn and the amino acid residues in both the N- and C- termini of α-syn that facilitate drug binding. Bold black dashed lines and amino acid residues indicate hydrogen bonding, whereas the grey dashed lines indicate hydrophobic interactions. Hydrogen bonding of 1-aminoindan with C-terminal amino acid residues is observed in C1, C4, C5 and C8 α-syn structures. In addition, hydrophobic interactions occur between 1-aminoindan and N-terminal amino acid residues (C1 and C4 α-syn structures) and also between 1-aminoindan and portions of the NAC region (C5 and C8 α-syn structures). The molecular docking study was carried out using Autodock Vina module implemented in PyRx tool. Protein and ligand interactions were analyzed and visualized through Pymol and LigPlot +
Fig. 8
Fig. 8
Molecular docking simulation of α-synuclein (α-syn) structures C4 (a) and C5 (b) bound to adenosine. Below full 3D representations show the magnified binding pocket of α-syn and the amino acid residue locations responsible for each drug binding. Bold black dashed lines and amino acid residues indicate hydrogen bonding, whereas the grey dashed lines and amino acid residues indicate hydrophobic interactions. Adenosine only formed hydrogen bonds and hydrophobic interactions with N-terminal amino acid residues in C5 α-syn structure. In addition, adenosine also formed hydrogen bonds with amino acid residues within the N-terminus and NAC region in C4 α-syn structure. The molecular docking study was carried out using Autodock Vina module implemented in PyRx tool. Protein and ligand interactions were analyzed and visualized through Pymol and LigPlot +
Fig. 9
Fig. 9
Molecular docking simulation of α-synuclein (α-syn) structures C2 (a), C5 (b), and C8 (c) bound to CPA; C2 (d), C5 (e), and C8 (f) bound to 2-aminoindan. Below full 3D representations show the magnified binding pocket of α-syn and the amino acid residue locations responsible for each drug binding. Bold black dashed lines and amino acid residues indicate hydrogen bonding, whereas the grey dashed lines and amino acid residues indicate hydrophobic interactions. Both CPA and 2-aminoindan formed hydrogen bonds and hydrophobic interactions with the N-terminal amino acids only (C5 and C8 α-syn structures) (b-c and ef, respectively). CPA also forms hydrogen bond and hydrophobic interactions with amino acids within the N-terminal and the NAC region (C2 α-syn structure) (a). In contrast, 2-aminoindan only forms hydrophobic interactions with the N-terminus and NAC domain in C2 α-syn structure (d). The molecular docking study was carried out using Autodock Vina module implemented in PyRx tool. Protein and ligand interactions were analyzed and visualized through Pymol and LigPlot +
Fig. 10
Fig. 10
Summary of the surface area analysis of the pars compacta region of the substantia nigra for DAPI, tyrosine hydroxylase (TH), and α-synuclein (α-syn). (a) Image of a 40-μm nigral brain slice in the DMSO/Saline control group, with 3,3’-diaminobenzidine (DAB) and TH staining at 4 × magnification with a light microscope. (b) Representative images of DAPI (Blue), TH (Green, Alexa Fluor 555), and α-syn (Red, Alexa Fluor 647) staining in the substantia nigra pars compacta of rats with 7-day chronic intraperitoneal injections of the following agents: Control (DMSO/Saline), CPA, DPCPX + CPA, 1-aminoindan + CPA, and 2-aminoindan + CPA. CPA with or without 2-aminoindan increased α-syn immunofluorescence compared to control. The CPA-induced increase in α-syn was attenuated by DPCPX or 1-aminoindan. Scale bar, 20 μm. (c) Western blots from total lysates of the substantia nigra and quantification of α-syn level in the substantia nigra. CPA increased the level of 15 kDa α-syn monomers, which was attenuated by DPCPX and 1-aminoindan but not by 2-aminoindan. DPCPX and 1-aminoindan alone significantly reduced the level of 30 kDa α-syn dimers. In contrast, DPCPX, 2-aminoindan, and 1-aminoindan alone significantly increased the 75 kDa α-syn, which likely represent the α-syn tetramers. All values were normalized to β-tubulin III. n = 4 animals in each treatment group. Mean ± SEM. ns, non-significant; *P < 0.05; **P < 0.01; and ***P < 0.001 (one-way ANOVA followed by Student–Newman–Keuls post-hoc multiple comparison test)
Fig. 11
Fig. 11
Summary of surface area analysis of α-synuclein (α-syn) and Thioflavin S in the substantia nigra (SN) pars compacta region. (a) Confocal microscopic images of DAPI, α-syn and Thioflavin S staining in 40-μm nigral brain slices of rats with the following treatments: Control (DMSO/Saline), CPA, DPCPX, 1-aminoindan, 2-aminoindan, DPCPX + CPA, 1-aminoindan + CPA, and 2-aminoindan + CPA. Scale bar, 50 μm. (b) The mean area intensities of α-syn and Thioflavin S in the SN pars compacta. The fluorescence intensity was quantified in a 100 × 100 μm2 region and normalized by subtracting the fluorescence intensity in a 50 × 50 μm2 background non-cell body bottom area. CPA increased the levels of α-syn and aggregated α-syn, and these levels were further enhanced by co-treatments with 2-aminoindan. (c) Pearson correlation coefficient of α-syn and Thioflavin S in the SN pars compacta with CPA. Average intensity values and correlation coefficients in bars represent mean ± SEM from n = 4 independent experiments. ns, non-significant; *P < 0.05; **P < 0.01; and ***P < 0.001 (one-way ANOVA followed by Student–Newman–Keuls post-hoc multiple comparison test)
Fig. 12
Fig. 12
Fluoro-Jade C (FJC) staining in the SN pars compacta (a) and CA1 of hippocampus (b) of rats with 7-day chronic intraperitoneal injection of Control (DMSO/saline), CPA, DPCPX, 1-aminoindan, 2-aminoindan, DPCPX + CPA, 1-aminoindan + CPA, and 2-aminoindan + CPA. Scale bar 50 μm. Summary bar graphs show significant increases in the relative fluorescence intensity of FJC staining in pars compacta after CPA, 2-aminoindan, and CPA + 2-aminonindan treatments (a). In contrast, only CPA and CPA + 2-aminoindan treatments significantly increased FJC fluorescence in the CA1 hippocampal neurons (b). FJC fluorescence intensity in a 100 × 100 μm2 region was normalized to the control group (100%). Values are shown as mean ± SEM. The average FJC fluorescence values were obtained from n = 4 independent experiments. ns, non-significant; *P < 0.05; **P < 0.01; and ***P < 0.001 (one-way ANOVA followed by Student–Newman–Keuls post-hoc multiple comparison test)

Similar articles

Cited by

References

    1. Gillis P, Malter JS. The adenosine-uridine binding factor recognizes the AU-rich elements of cytokine, lymphokine, and oncogene mRNAs. J Biol Chem. 1991;266(5):3172–3177. - PubMed
    1. Bours MJ, Swennen EL, Di Virgilio F, Cronstein BN, Dagnelie PC. Adenosine 5'-triphosphate and adenosine as endogenous signaling molecules in immunity and inflammation. Pharmacol Ther. 2006;112(2):358–404. - PubMed
    1. Touyz RM, Briones AM. Reactive oxygen species and vascular biology: implications in human hypertension. Hypertens Res. 2011;34(1):5–14. - PubMed
    1. Burnstock G, Verkhratsky A. Long-term (trophic) purinergic signalling: purinoceptors control cell proliferation, differentiation and death. Cell Death Dis. 2010;1(1):e9–e9. - PMC - PubMed
    1. Cao X, Li LP, Qin XH, Li SJ, Zhang M, Wang Q, et al. Astrocytic Adenosine 5′-Triphosphate release regulates the proliferation of neural stem cells in the adult hippocampus. Stem Cells. 2013;31(8):1633–1643. - PubMed

Publication types