. 2022 Jan;10(2):e003534.
doi: 10.1136/jitc-2021-003534.

Single-cell transcriptome analysis revealed a suppressive tumor immune microenvironment in EGFR mutant lung adenocarcinoma

Affiliations

Single-cell transcriptome analysis revealed a suppressive tumor immune microenvironment in EGFR mutant lung adenocarcinoma

Lei Yang et al. J Immunother Cancer. 2022 Jan.

Abstract

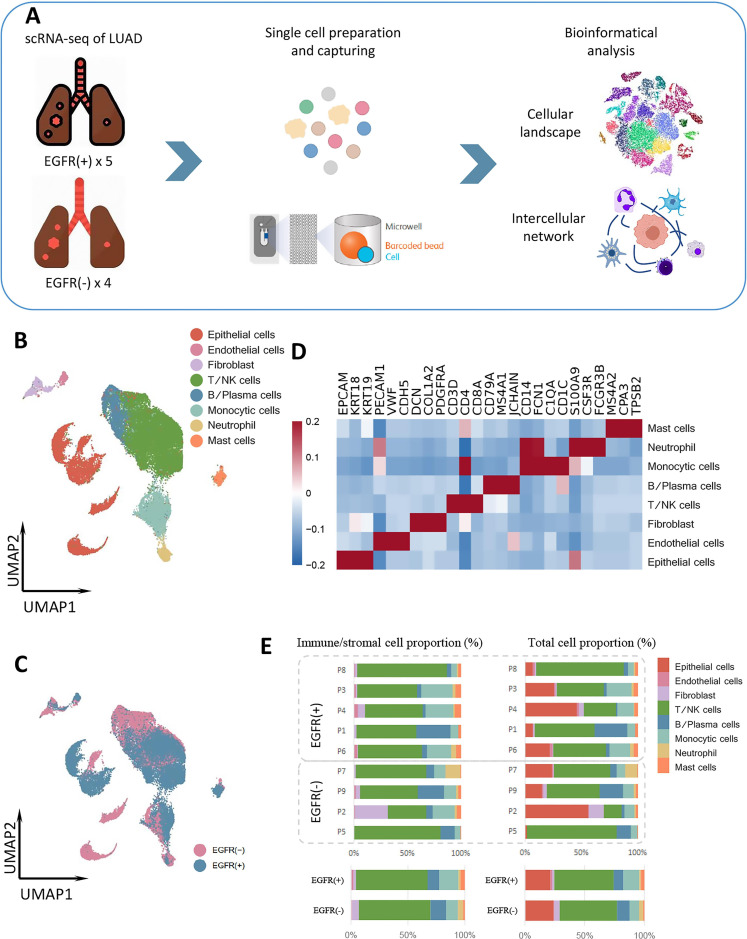
Backgrounds: Immunotherapy is less effective in patients with epidermal growth factor receptor (EGFR) mutant non-small-cell lung cancer (NSCLC). Lower programmed cell death-ligand 1 (PD-L1) expression and tumor mutation burden (TMB) are reported to be the underlying mechanism. Being another important factor to affect the efficacy of immunotherapy, tumor microenvironment (TME) characteristics of this subgroup of NSCLC are not comprehensively understood up to date. Hence, we initiated this study to describe the specific TME of EGFR-mutant lung adenocarcinoma (LUAD) from cellular compositional and functional perspectives to better understand the immune landscape of this most common subtype of NSCLC.

Methods: We used single-cell transcriptome sequencing and multiplex immunohistochemistry to investigate the immune microenvironment of EGFR-mutant and EGFR wild-type LUADs and determined the efficacy of immunotherapy. We analyzed single cells from nine treatment-naïve samples and compared them to three post-immunotherapy samples previously reported from single cell perspective using bioinformatics methods.

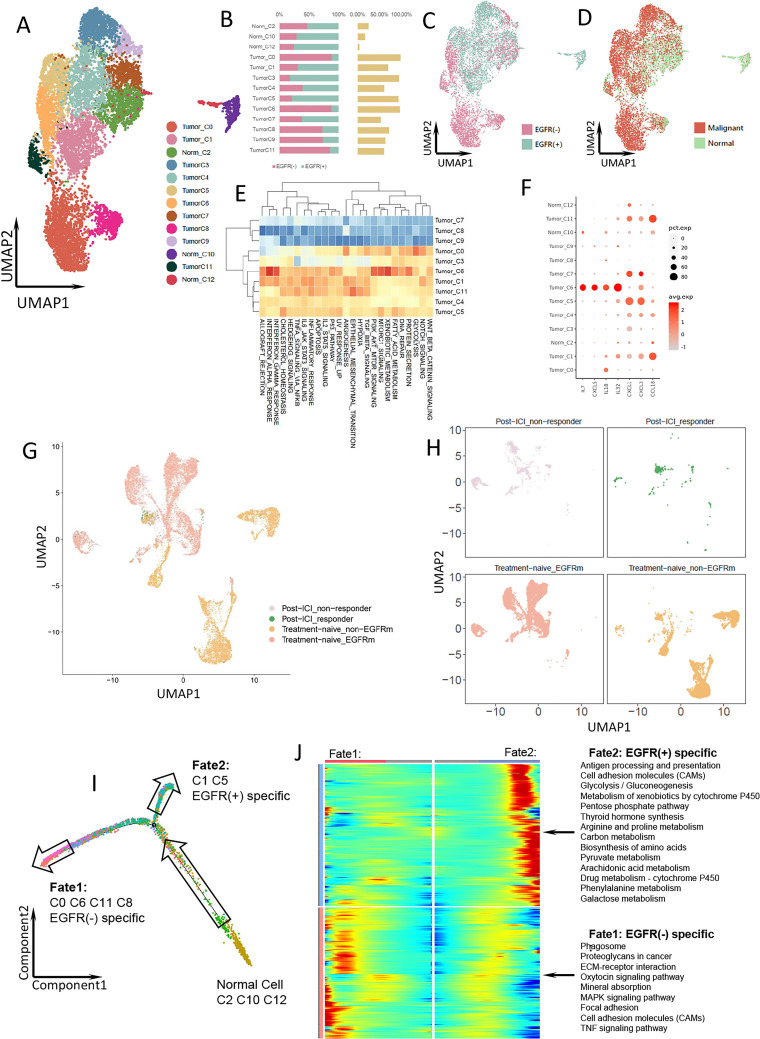
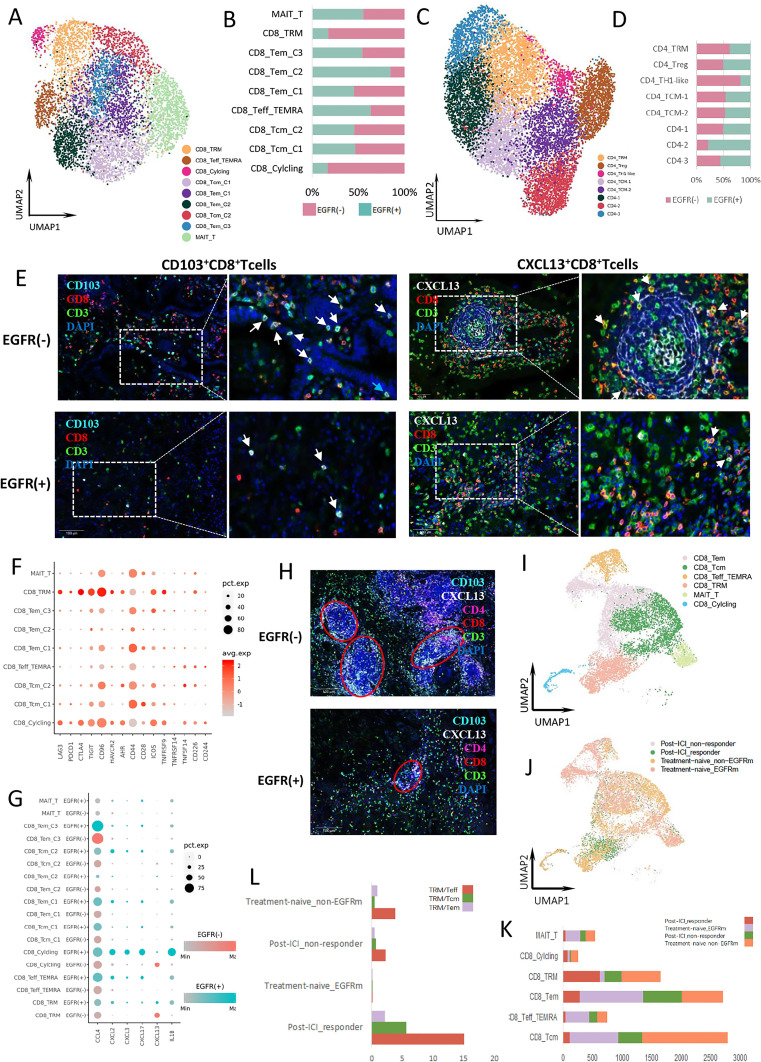
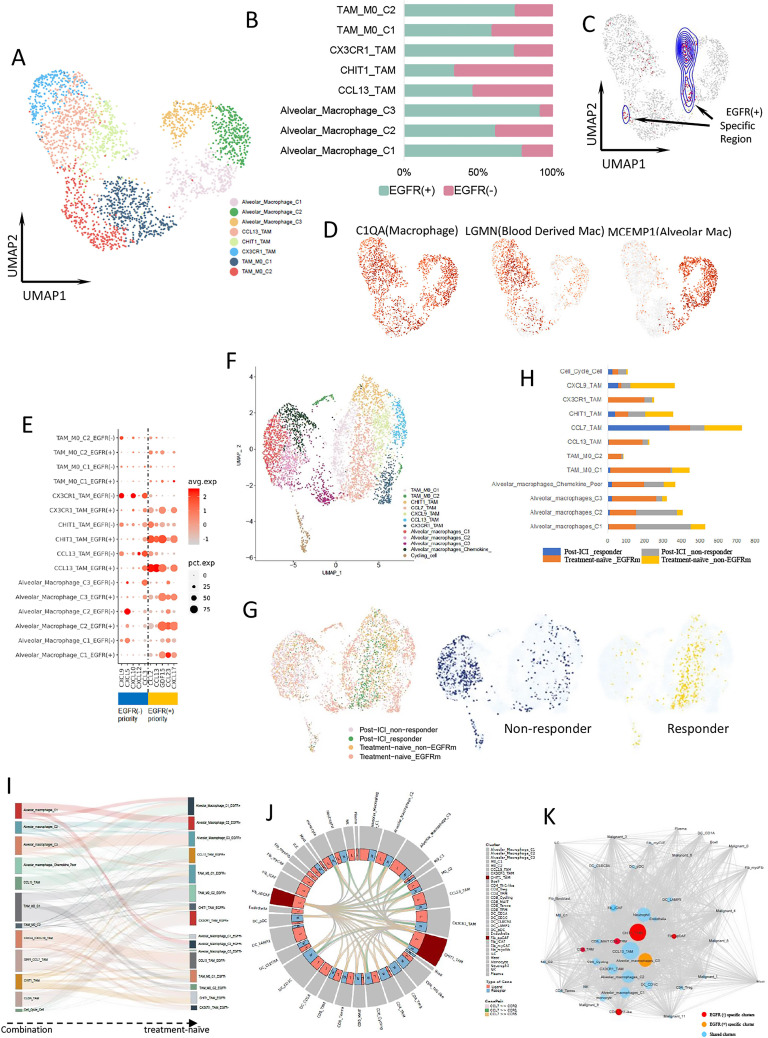
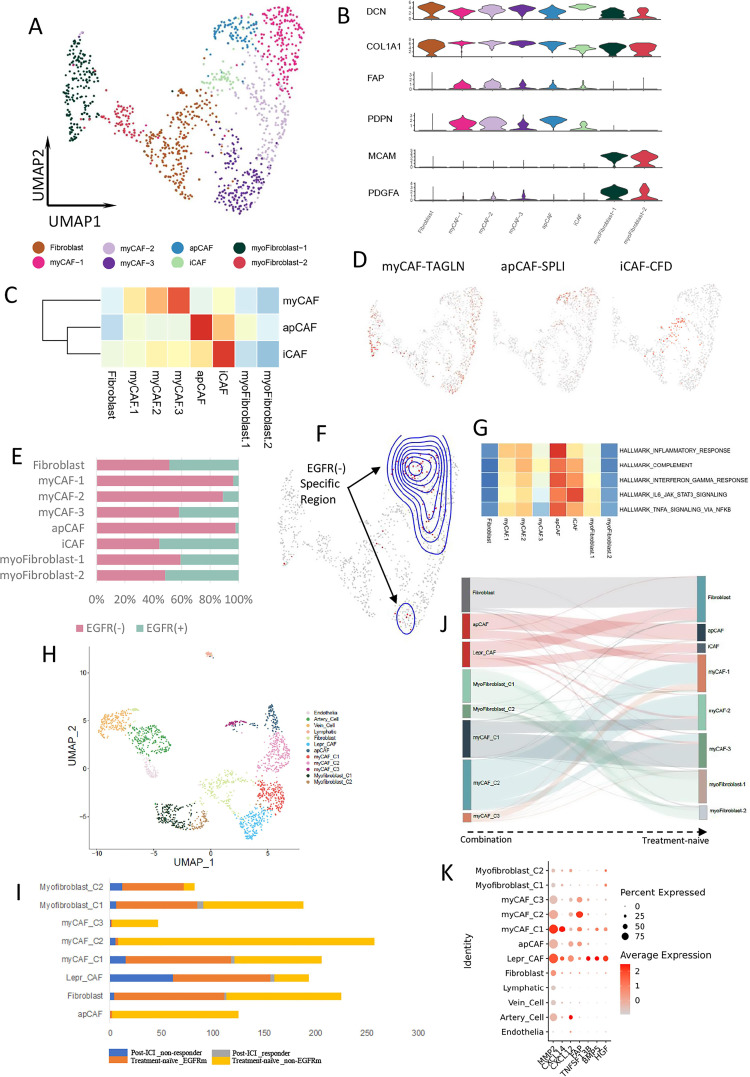
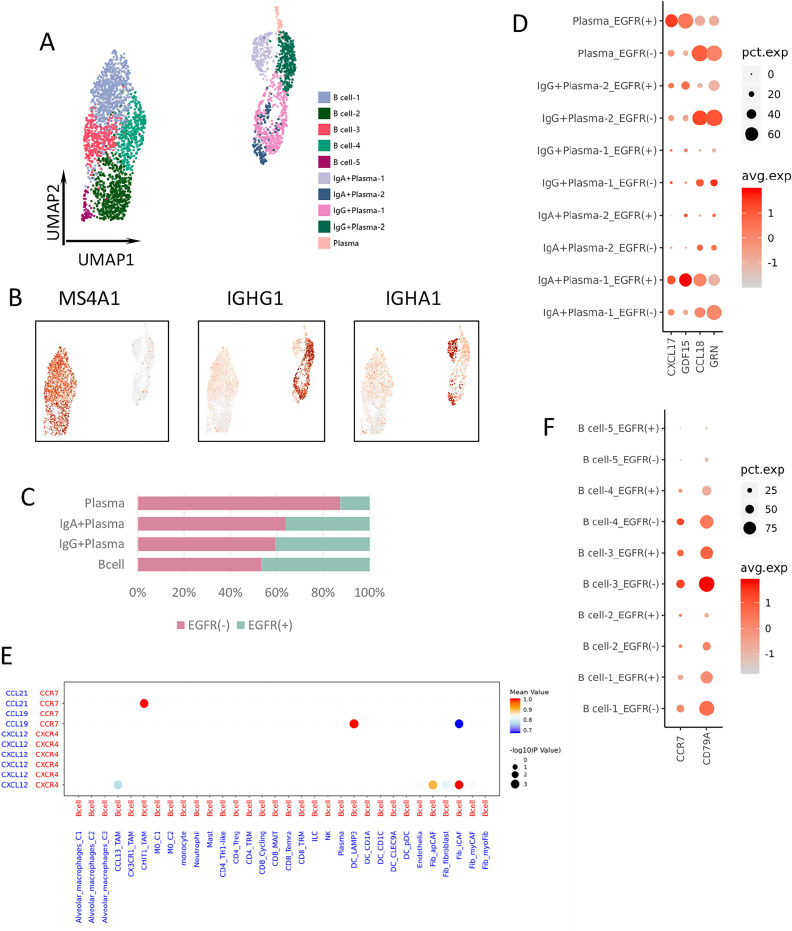
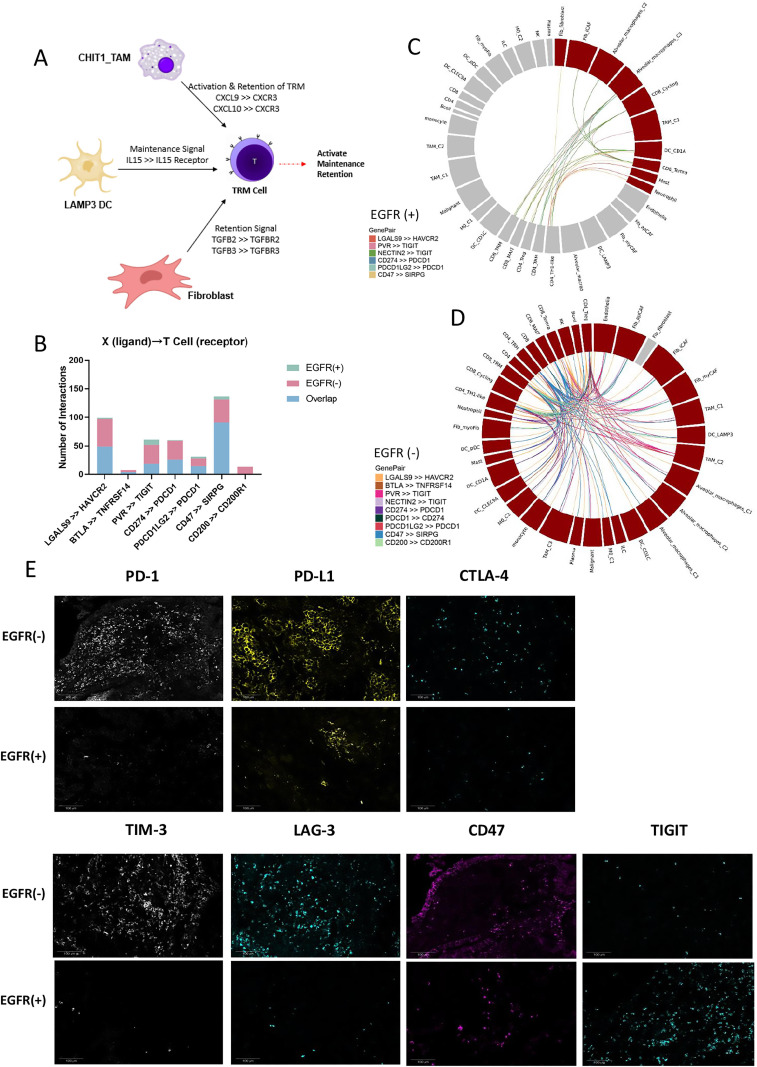
Results: We found that EGFR-mutant malignant epithelial cells had similar characteristics to the epithelial cells in non-responders. EGFR-mutant LUAD lacked CD8+ tissue-resident memory (TRM) cells, which could promote tertiary lymphoid structure generation by secreting CXCL13. In addition, other cell types, including tumor-associated macrophages and cancer-associated fibroblasts, which are capable of recruiting, retaining, and expanding CD8+ TRM cells in the TME, were also deficient in EGFR-mutant LUAD. Furthermore, EGFR-mutant LUAD had significantly less crosstalk between T cells and other cell types via programmed cell death-1 (PD-1) and PD-L1 or other immune checkpoints compared with EGFR wild-type LUAD.

Conclusions: Our findings provide a comprehensive understanding of the immune landscape of EGFR-mutant LUAD at the single-cell level. Based on the results, many cellular components might have negative impact on the specific TME of EGFR-mutant LUAD through influencing CD8+ TRM. Lack of CD8+ TRM might be a key factor responsible for the suppressive TME of EGFR-mutant LUAD.

Keywords: immunotherapy; lung neoplasms; tumor microenvironment.


Conflict of interest statement

Competing interests: QZ reports honoraria from AstraZeneca, Boehringer Ingelheim, BMS, Eli Lilly, MSD, Pfizer, Roche, and Sanofi, outside the submitted work. WZ reports honoraria from AstraZeneca, Eli Lilly, Pfizer, Roche, and Sanofi, outside the submitted work. Y-LW reports advisory services for AstraZeneca, Boehringer Ingelheim, Novartis, and Takeda; personal fees from AstraZeneca, Beigene, Boehringer Ingelheim, BMS, Eli Lilly, MSD, Pfizer, Roche, and Sanofi; grants from AstraZeneca, Boehringer Ingelheim, BMS, Hengrui, and Roche, outside the submitted work. All other authors declare no competing interests.

Figures

Figure 1
Figure 1
Global immune landscape and cell types in LUAD. (A) Workflow of the sample collection, preparation, sequencing, and bioinformatic analysis. (B) UMAP plot of the 40,799 total cells from treatment-naïve samples, color-coded by cell type. (C) UMAP plot of the 40,799 total cells from treatment-naïve samples, color-coded by group. (D) Heatmap of marker genes of all cell types. (E) Proportions of cell types in individual samples (above) and in different groups (bottom). EGFR, epidermal growth factor receptor; LUAD, lung adenocarcinoma; NK, natural killer; scRNA-seq, single-cell RNA sequencing.
Figure 2
Figure 2
Epithelial cells with different EGFR mutation status in LUAD. (A) UMAP plot of 9067 epithelial cells from treatment-naïve samples, divided into normal cell clusters and malignant cell clusters. (B) The proportion of each epithelial cell cluster in EGFR(−) (pink) and EGFR(+) (cyan) group. The yellow bar shows the proportion of each epithelial cell cluster in total epithelial cells. (C) UMAP plot of the epithelial cells from treatment-naïve samples, color-coded by group. (D) UMAP plot of the epithelial cells from treatment-naïve samples, color-coded by cell type. (E) Heatmap of the Qusage GO term enrichment/hallmark analysis of each cluster in epithelial cells. (F) Bubble plot of cytokine and IL expression among epithelial cell clusters. (G) UMAP plot of pooled epithelial cells in both treatment naïve and post-ICI treatment samples. (H) UMAP plot of epithelial cells from post-ICI responder, post-ICI non-responder, treatment-naïve EGFR-mutant and treatment-naïve EGFR(−) samples, respectively. (I) Pseudo-time plot of epithelial cells with different EGFR status in treatment-naïve samples exhibiting two differentiation trajectory fates. (J) Radiation plot showing significant differential expression for each fate. Genes with high expression are colored in red and genes with low expression are in blue. EGFR, epidermal growth factor receptor; GO, Gene Ontology; ICI, immune-checkpoint inhibitor; LUAD, IL, interleukin; LUAD, lung adenocarcinoma.
Figure 3
Figure 3
T and NK cell clusters and functions in LUAD. (A) UMAP plot of 6568 CD8+ T cells from treatment-naïve samples. (B) The proportion of each CD8+ T cell cluster in EGFR(−) (pink) and EGFR(+) (cyan) group. (C) UMAP plot of 11,755 CD4+ T cells from treatment-naïve samples. (D) The proportion of each CD4+ T cell cluster in EGFR(−) (pink) and EGFR(+) (cyan) group. (E) Expression of CD103 (left) and CXCL13 (right) by CD8+ T cells in the EGFR(−) and EGFR(+) TME. The TLS structure with CXCL13 + CD8+ T cells was also displayed in EGFR(−) TME. The TLS structure was surrounded by CXCL13 + CD8+ T cells. (F) Bubble plot of immune checkpoint receptor expression among CD8+ T cell clusters. (G) Bubble plot of cytokine and IL expression among CD8+ T cell clusters from different group. (H) The density of TLS in the EGFR(−) and EGFR(+) TME. (I) UMAP plot of pooled CD8+ T cells in both treatment-naïve and post-treatment samples. All pooled CD8+ T cells were annotated and divided into 6 main cell types. (J) UMAP plot of pooled CD8+ T cells from post-ICI responder, post-ICI non-responder, treatment-naïve EGFR-mutant, and treatment-naïve EGFR-negative samples, respectively. (K) The proportion of different CD8+ T cell cluster from post-ICI responder, post-ICI non-responder, treatment-naïve EGFR-mutant, and treatment-naïve EGFR(−) samples, respectively. (L) The ratio of CD8+ TRM cells to other T cells in post-ICI responder, post-ICI non-responder, treatment-naïve EGFR-mutant, and treatment-naïve EGFR-negative samples, respectively. EGFR, epidermal growth factor receptor; ICI, immune-checkpoint inhibitor; IL, interleukin; NK, natural killer; TLS, tertiary lymphoid structure; TME, tumor microenvironment.
Figure 4
Figure 4
Macrophage expression differs by EGFR mutation status. (A) UMAP plot of 2649 macrophages from treatment-naïve samples. (B) The proportion of each macrophage cluster in EGFR(−) (pink) and EGFR(+) (cyan) group. (C) UMAP plot of macrophages from EGFR(+)-specific region calculated by DASeq. (D) Expression of marker genes for macrophages, blood-derived macrophages, and alveolar macrophages. (E) Bubble plot of cytokine expression among macrophage clusters from different group. (F) UMAP plot of pooled macrophages in both treatment-naïve and post-treatment samples. (G) UMAP plot of pooled macrophages from post-ICI responder, post-ICI non-responder, treatment-naïve EGFR-mutant, and treatment-naïve EGFR-negative samples, respectively (left). The macrophages from responder (middle) and non-responder (right) were separately distributed. (H) The proportion of different macrophage cluster from post-ICI responder, post-ICI non-responder, treatment-naïve EGFR-mutant, and treatment-naïve EGFR-negative samples, respectively. (I) Macrophage clusters comparation between combination samples and treatment-naïve samples. (J) CHIT1_TAM interacted with other immune cells, including CD8+ T cells through CCL7 and its receptors binding. (K) Cellular interaction network for all LUAD cell types constructed based on the CellPhoneDB results. Lines represent the relationship between two clusters in terms of cytokine expression. Node size reflects the strength of the relationship. Red nodes represent EGFR(−)-specific clusters, orange nodes represent EGFR(+)-specific clusters, and blue nodes represent sharing clusters from both groups. EGFR, epidermal growth factor receptor; ICI, immune-checkpoint inhibitor; TAM, tumor-associated macrophage.
Figure 5
Figure 5
CAF clustering and function in EGFR-negative LUAD. (A) UMAP plot of 1145 fibroblasts from treatment-naïve samples. (B) Violin plot of different marker genes for each fibroblast cluster. (C) The correlation of each fibroblast cluster with different CAF subtypes according to the marker gene expression scoring. (D) Expression of marker genes for myCAFs, apCAFs, and iCAF. (E) The proportion of each fibroblast cluster in EGFR(−) (pink) and EGFR(+) (cyan) group. (F) UMAP plot of fibroblast from EGFR(−)-specific region calculated by DASeq. (G) Heatmap of the Qusage GO term enrichment/hallmark analysis for different fibroblast clusters. (H) UMAP plot of pooled fibroblast and endothelial cells in both treatment-naïve and post-treatment samples. (I) The proportion of different fibroblast cluster from post-ICI responder, post-ICI non-responder, treatment-naïve EGFR-mutant, and treatment-naïve EGFR-negative samples, respectively. (J) Fibroblast clusters comparation between combination samples and treatment-naïve samples. (K) Bubble plot of the MSC-associated marker genes expressed by LEPR+ CAFs. apCAFs, antigen presenting CAFs; DASeq, differential abundance sequencing; EGFR, epidermal growth factor receptor; CAFs, cancer-associated fibroblasts; GO, Gene Ontology; iCAFs, inflammatory CAFs; ICI, immune-checkpoint inhibitor; LEPR leptin receptor, LUAD, lung adenocarcinoma; MSC, mesenchymal stem cell; myCAFs, myofibroblastic CAFs.
Figure 6
Figure 6
B-cell clustering and differential gene expression. (A) UMAP plot of 3453 B/plasma cells from treatment-naïve samples. (B) Expression of marker genes for different B/plasma cell clusters. (C) The proportion of each B/plasma cells cluster in EGFR(−) (pink) and EGFR(+) (cyan) group. (D) Bubble plot of differential gene expression among plasma cell clusters from different groups. (E) Cell–cell interactions between B cells and other types of immune cells through ligand and receptor binding. (F) Expression of CCR7 and CD79A among B cell clusters from different groups. EGFR, epidermal growth factor receptor.
Figure 7
Figure 7
Cell interactions within the TME of LUAD. (A) The specific interactions between CD8+ TRM cells and other cells in EGFR(−) group. (B) Bar chart shows the interactions between T cells expressing immune checkpoint receptors and other cells that express immune checkpoint ligands in EGFR(+) and EGFR(−) group. (C) Circle plot of specific immune checkpoint interactions between T cell and other cells in EGFR(+) group. (D) Circle plot of specific immune checkpoint interactions between T cell and other cells in EGFR(−) group. (E) Immune checkpoint protein expression in EGFR(+) and EGFR(−) samples, including PD-1, PD-L1, CTLA4, TIM3, LAG3, CD47, and TIGIT. EGFR, epidermal growth factor receptor; LAG3, lymphocyte activating 3; LUAD, lung adenocarcinoma; PD-1, programmed cell death protein 1; PD-L1, programmed death-ligand 1; TIM3, T cell immunoglobulin and mucin domain-containing protein 3; TME, tumor microenvironment; TRM, tissue-resident memory.

References

    1. Topalian SL, Hodi FS, Brahmer JR, et al. . Five-year survival and correlates among patients with advanced melanoma, renal cell carcinoma, or non-small cell lung cancer treated with nivolumab. JAMA Oncol 2019;5:1411–20. 10.1001/jamaoncol.2019.2187 - DOI - PMC - PubMed
    1. Li J, Gu J. PD-L1 expression and EGFR status in advanced non-small-cell lung cancer patients receiving PD-1/PD-L1 inhibitors: a meta-analysis. Future Oncol 2019;15:1667–78. 10.2217/fon-2018-0639 - DOI - PubMed
    1. Toki MI, Mani N, Smithy JW, et al. . Immune marker profiling and programmed death ligand 1 expression across NSCLC mutations. J Thorac Oncol 2018;13:1884–96. 10.1016/j.jtho.2018.09.012 - DOI - PMC - PubMed
    1. Association between tissue TMB (tTMB) and clinical outcomes with pembrolizumab monotherapy (pembro) in PD-L1-positive advanced NSCLC in the KEYNOTE-010 and -042 trials. Ann Oncol 2019;30:v851–934.
    1. Dong Z-Y, Zhang J-T, Liu S-Y, et al. . EGFR mutation correlates with uninflamed phenotype and weak immunogenicity, causing impaired response to PD-1 blockade in non-small cell lung cancer. Oncoimmunology 2017;6:e1356145. 10.1080/2162402X.2017.1356145 - DOI - PMC - PubMed

Publication types