. 2022 Feb 9;13(1):773.
doi: 10.1038/s41467-022-28376-8.

Dynamic Runx1 chromatin boundaries affect gene expression in hematopoietic development

Affiliations

Dynamic Runx1 chromatin boundaries affect gene expression in hematopoietic development

Dominic D G Owens et al. Nat Commun. .

Abstract

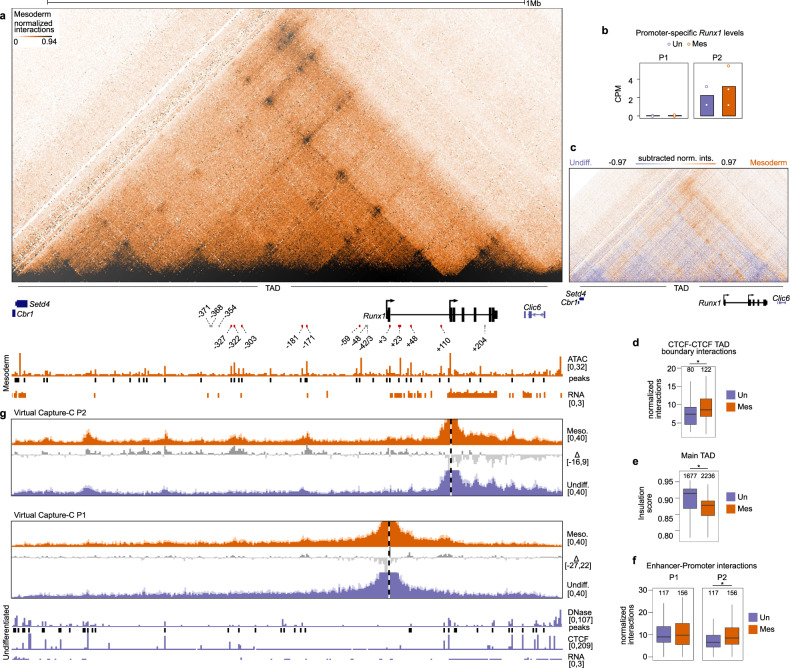
The transcription factor RUNX1 is a critical regulator of developmental hematopoiesis and is frequently disrupted in leukemia. Runx1 is a large, complex gene that is expressed from two alternative promoters under the spatiotemporal control of multiple hematopoietic enhancers. To dissect the dynamic regulation of Runx1 in hematopoietic development, we analyzed its three-dimensional chromatin conformation in mouse embryonic stem cell (ESC) differentiation cultures. Runx1 resides in a 1.1 Mb topologically associating domain (TAD) demarcated by convergent CTCF motifs. As ESCs differentiate to mesoderm, chromatin accessibility, Runx1 enhancer-promoter (E-P) interactions, and CTCF-CTCF interactions increase in the TAD, along with initiation of Runx1 expression from the P2 promoter. Differentiation to hematopoietic progenitor cells is associated with the formation of tissue-specific sub-TADs over Runx1, a shift in E-P interactions, P1 promoter demethylation, and robust expression from both Runx1 promoters. Deletion of promoter-proximal CTCF sites at the sub-TAD boundaries has no obvious effects on E-P interactions but leads to partial loss of domain structure, mildly affects gene expression, and delays hematopoietic development. Together, our analysis of gene regulation at a large multi-promoter developmental gene reveals that dynamic sub-TAD chromatin boundaries play a role in establishing TAD structure and coordinated gene expression.


Conflict of interest statement

J.R.Hu and D.J. are founders and shareholders of, and D.J.D. and R.S. are paid consultants for Nucleome Therapeutics. Other authors declare no competing interests.

Figures

Fig. 1
Fig. 1. Runx1 resides within a topologically associating domain (TAD) in undifferentiated cells.
a Schematic of the Runx1 locus on mouse chromosome 16, with Runx1 proximal (P2) and distal (P1) promoters, exons, and adjacent gene desert labeled. Previously identified enhancers are indicated by red circles that are numbered according to the distance (in kb) from the Runx1 start codon in exon 1,–,–,–. b Schematic of seven-day differentiation protocol with cytokines and markers used for isolation of cells by FACS indicated. EHT = endothelial-to-hematopoietic transition. DNaseI-seq data in mESC was previously published. c Bright-field images of different stages of in vitro differentiation. Colonies of hemogenic endothelial (HE) cells are outlined with dashed yellow lines and clusters of emerging hematopoietic progenitors are indicated by hollow white arrowheads. Scale bars = 200 µm. Representative images are shown. Experiments were performed more than ten times with similar results. d Principal component analysis (PCA) of individual poly(A) minus RNA-seq replicates colored by cell type. e Plot of normalized counts of lineage marker gene expression across differentiation. Undifferentiated n = 2, mesoderm n = 3, hematopoietic n = 4. f PCA of individual Tiled-C replicates colored by cell type. g Tiled-C matrix at 2 kb resolution for undifferentiated mESCs. Matrix is a merge of three independent replicates (n = 3). Interactions are visualized with a threshold at the 94th percentile. Runx1 promoters (P1 and P2), neighboring genes, the adjacent gene desert, and approximate location of the 1.1 Mb Runx1 TAD are labeled. Publicly available CTCF ChIP-seq in E14 mESCs was reanalyzed and the orientation of CTCF motifs identified de novo under CTCF peaks is indicated. Previously published enhancer regions are indicated and numbered according to their distance from the Runx1 start codon in exon 1. Enhancer regions that are accessible in undifferentiated cells are shown as red bars and enhancers that did not overlap DNaseI-seq peaks are identified by gray bars.
Fig. 2
Fig. 2. Early hematopoietic differentiation leads to increased enhancer-Runx1 P2 interactions.
a Tiled-C matrix from mesoderm (2 kb resolution, threshold at the 94th percentile, n = 4). Runx1 promoters and location of Runx1 TAD are labeled below the matrix. RPKM-normalized ATAC-seq track is shown with called peaks (MACS2, adjusted p < 0.05, peaks called from one merged bam file). CPM-normalized poly(A)-minus RNA-seq (n = 3) is shown. Previously published enhancer regions are indicated. Enhancer regions that are accessible in mesoderm are shown as red bars and numbered according to their distance from the Runx1 start codon in exon 1. Enhancers that did not overlap ATAC-seq peaks are identified by gray bars. b Promoter-specific Runx1 levels in undifferentiated and mesoderm cells. Data were analyzed from two (undifferentiated) or three (mesoderm) biologically independent experiments. c Subtraction of normalized Tiled-C matrices between undifferentiated and mesoderm. The matrix is a subtraction of the signal between two merged matrices (undifferentiated n = 3, mesoderm n = 4, 2 kb resolution, threshold at +97th and −97th percentile). d Quantification of interactions between the four outermost CTCF peaks at the edges of the TAD (*, Kruskal–Wallis and Dunn’s test, two-sided adjusted p = 0.003). e Insulation score (intra-TAD interaction ratio) of the main Runx1 TAD (*, Kruskal–Wallis and Dunn’s test, two-sided adjusted p = 1.4 × 10−135). f Quantification of total interactions from the viewpoint of each promoter with all previously published enhancers (Supplementary Table 2) (*, Kruskal–Wallis and Dunn’s test, two-sided adjusted p = 0.005). g Virtual Capture-C profiles (obtained from Tiled-C data, see “Methods”) from the viewpoint of both Runx1 promoters in undifferentiated mESCs (blue tracks) and mesodermal cells (orange tracks). Runx1 promoters (P1 and P2) are indicated by a vertical dashed line. Dark colors represent the mean reporter counts in 2 kb bins (undifferentiated n = 3, mesoderm n = 4) normalized to the total cis-interactions in each sample. Standard deviation is shown in the lighter color. Subtractions between two cell types as indicated are shown as gray tracks. DNaseI-seq, DNaseI peaks, CTCF ChIP-seq, and RNA-seq from undifferentiated mESCs are indicated in blue below Capture-C tracks. df Boxplot centre shows median, bounds of the box indicate 25th and 75th percentiles, and maxima and minima show the largest point above or below 1.5 * interquartile range. Outlying points are not shown. Data were analyzed from the total number of bins indicated above each boxplot from three (undifferentiated) or four (mesoderm) biologically independent experiments.
Fig. 3
Fig. 3. EHT progression is associated with sub-TAD reinforcement, increased Runx1 expression and P1 activation.
a Tiled-C matrix from HPCs (2 kb resolution, threshold at the 94th percentile, n = 4). Runx1 promoters and location of Runx1 TAD are labeled below the matrix. RPKM-normalized ATAC-seq track is shown with called peaks (MACS2 adjusted p < 0.05, peaks called from one merged bam file). CPM-normalized poly(A)-minus RNA-seq (n = 4) is shown. CTCF occupancy in 416B hematopoietic progenitor cells is shown. Previously published enhancer regions are indicated. Enhancer regions that are accessible in HPCs are shown as red bars and numbered according to their distance from the Runx1 start codon in exon 1. Enhancers that did not overlap ATAC-seq peaks are identified by gray bars. b Promoter-specific Runx1 levels in mesoderm and HPCs. Data were analyzed from three biologically independent experiments. c Left, insulation score (intra-TAD interaction ratio) of the main Runx1 TAD (*, Kruskal–Wallis and Dunn’s test, two-sided adjusted p = 2.1 × 10−7). Right, quantification of interactions between the four outermost CTCF peaks at the edges of the TAD. d Top, zoom of Tiled-C data at 2 kb resolution with a threshold at 94th percentile. Below, subtraction of normalized Tiled-C matrices between mesoderm and HPCs. The matrix is a subtraction of the signal between two merged matrices (n = 4, 2 kb resolution, threshold at +97th and −97th percentile). e Insulation scores (intra-TAD interaction ratio) of the two Runx1 sub-TADs (*, Kruskal–Wallis and Dunn’s test, P1-P2 TAD two-sided adjusted p = 3.1 × 10−43 and P2-3′ TAD two-sided adjusted p = 6.6 × 10−13). f Quantification of total interactions from the viewpoint of each promoter with all previously published enhancers (Supplementary Table 2) (*, Kruskal–Wallis and Dunn’s test, two-sided adjusted p = 0.004). g Virtual Capture-C profiles (obtained from Tiled-C data, see “Methods”) from the viewpoint of both Runx1 promoters in mesoderm (orange tracks) and HPCs (green tracks). Runx1 promoters (P1 and P2) are indicated by a vertical dashed line. Dark colors represent the mean reporter counts in 2 kb bins (n = 4) normalized to the total cis-interactions in each sample. Standard deviation is shown in the lighter color. Subtractions of the signal between two cell types as indicated are shown as gray tracks. ATAC-seq and peaks and RNA-seq from mesoderm are indicated in orange below Capture-C tracks. c, e, f Boxplot centre shows median, bounds of the box indicate 25th and 75th percentiles, and maxima and minima show the largest point above or below 1.5 * interquartile range. Outlying points are not shown. Data were analyzed from the total number of bins indicated above each boxplot from four biologically independent experiments.
Fig. 4
Fig. 4. Runx1 promoter-proximal CTCF sites play a role in establishing Runx1 chromatin architecture.
a Schematic of Runx1 TAD showing CTCF binding in mESCs and the orientation of CTCF motifs underlying peaks. P1 and P2 promoter-proximal CTCF sites are indicated with CRISPR/Cas9 strategies to delete them. Distance to Runx1 transcription start sites is indicated. Vertebrate conservation (phastCons, cons), CTCF occupancy in 416B HPCs, core motif sequence, single guide (sg)RNA, and deletion alleles (dels) are indicated. b, c Subtraction of Tiled-C matrices between P2-CTCF-KO (b) P1-CTCF-KO (c) and wild-type hematopoietic cells is shown at 2 kb resolution with threshold at +/−97th percentile of subtracted normalized interactions (subtracted norm. ints.) (n = 4). Locations of CTCF site deletions are indicated by a pink and green cross. RPKM-normalized ATAC-seq in wild-type HPCs and CTCF occupancy in 416B cells is shown. The locations of the main Runx1 TAD and sub-TADs are indicated. d, e Tiled-C matrix from P2-CTCF-KO (d) and P2-CTCF-KO (e) (2 kb resolution, threshold at 94th percentile, n = 4). f Insulation scores (intra-TAD interaction ratio) for main Runx1 TAD and sub-TADs in wild type, P1-CTCF-KO, and P2-CTCF-KO HPCs (*, Kruskal–Wallis and Dunn’s test, two-sided adjusted p-values: main TAD WT and P1-CTCF-KO p = 4.8−4, WT and P2-CTCF-KO p = 0.03, P1-P2 sub-TAD WT and P1-CTCF-KO p = 0.003). Boxplot centre shows median, bounds of the box indicate 25th and 75th percentiles, and maxima and minima show the largest point above or below 1.5 * interquartile range. Outlying points are not shown. Data were analyzed from the total number of bins indicated above each boxplot from four biologically independent experiments.
Fig. 5
Fig. 5. Runx1 spatiotemporal expression is slightly altered after loss of P2-proximal CTCF.
a Total Runx1 levels in poly(A)-minus RNA-seq in the cell types and genotypes indicated. The expanded graph with a dashed outline shows data just for mesodermal cells on a different axis. b Promoter-specific Runx1 levels for each promoter in the cell types and genotypes indicated. c PCA of all poly(A)-minus RNA-seq replicates. d PCA of mesoderm RNA-seq samples. e Volcano plots showing differentially expressed genes (DEGs, DESeq2 adjusted two-sided p < 0.05, fold change >1) in P2-CTCF-KO compared to wild-type mesoderm. f Expression of lineage marker genes across differentiation in the genotypes indicated (*, DESeq2 adjusted two-sided p-values: T (0.048), Eomes (0.0021), Pecam1 (0.037), Etv6 (0.043), Ikzf1 (0.016), Ikzf2 (1.1 × 10−5), Erg (0.0079), Flt1 (0.0078), fold change >1). g GO term biological processes associated with the DEG list between wild-type and P2-CTCF-KO mesoderm. Gene ratios and −log10 p-values adjusted using the Benjamini–Hochberg method are indicated for significantly enriched (goseq p-values adjusted with Benjamini–Hochberg procedure p < 0.05) GO terms. ag Data were analyzed from n = 3 independent experiments for Wild type, P1-CTCF-KO, P2-CTCF-KO mesoderm, n = 4 independent experiments wild-type hematopoietic, n = 3 independent experiments P1-CTCF-KO hematopoietic, n = 5 independent experiments P2-CTCF-KO hematopoietic).
Fig. 6
Fig. 6. Schematic model of dynamic chromatin changes at Runx1 during hematopoietic development and after promoter-proximal CTCF site deletions.
Large light gray triangles represent the preformed main 1.1 Mb Runx1 TAD. The orientation of selected CTCF motifs is indicated below the TAD. Selected previously identified enhancer elements in each cell type are represented by gray circles (inaccessible) or red circles (accessible). Dashed lines throughout the TAD represent long-range chromatin interactions, with the darker color indicating a stronger interaction. Hematopoietic progenitor cell (HPC)-specific sub-TADs over the Runx1 gene are indicated by dark gray smaller triangles within the larger TAD. A larger schematic of the Runx1 gene is shown in each cell type with larger arrows at each promoter representing more transcription from that promoter. P1 and P2-CTCF-KO interactions in HPCs are indicated in the bottom two triangles, with the location of the deleted sites indicated by green and pink crosses. The lighter sub-TAD triangles over the Runx1 gene indicate reduced sub-TAD insulation after promoter-proximal CTCF site deletion. The green and pink colored areas in the TAD represent increased interactions compared to wild type after deletion of P1-CTCF and P2-CTCF, respectively. The lighter green and pink dashed lines represent reduced long-range interactions from the promoters after P1 and P2-CTCF site deletion.

References

    1. de Bruijn M, Dzierzak E. Runx transcription factors in the development and function of the definitive hematopoietic system. Blood. 2017;129:2061–2069. - PubMed
    1. Levanon D, Groner Y. Structure and regulated expression of mammalian RUNX genes. Oncogene. 2004;23:4211–4219. - PubMed
    1. Gao L, et al. RUNX1 and the endothelial origin of blood. Exp. Hematol. 2018;68:2–9. - PMC - PubMed
    1. Yzaguirre AD, de Bruijn MF, Speck NA. The role of Runx1 in embryonic blood cell formation. Adv. Exp. Med. Biol. 2017;962:47–64. - PMC - PubMed
    1. Sood R, Kamikubo Y, Liu P. Role of RUNX1 in hematological malignancies. Blood. 2017;129:2070–2082. - PMC - PubMed

Publication types

MeSH terms