. 2022 Feb 9;13(1):758.
doi: 10.1038/s41467-022-28279-8.

Combining p53 mRNA nanotherapy with immune checkpoint blockade reprograms the immune microenvironment for effective cancer therapy

Affiliations

Combining p53 mRNA nanotherapy with immune checkpoint blockade reprograms the immune microenvironment for effective cancer therapy

Yuling Xiao et al. Nat Commun. .

Abstract

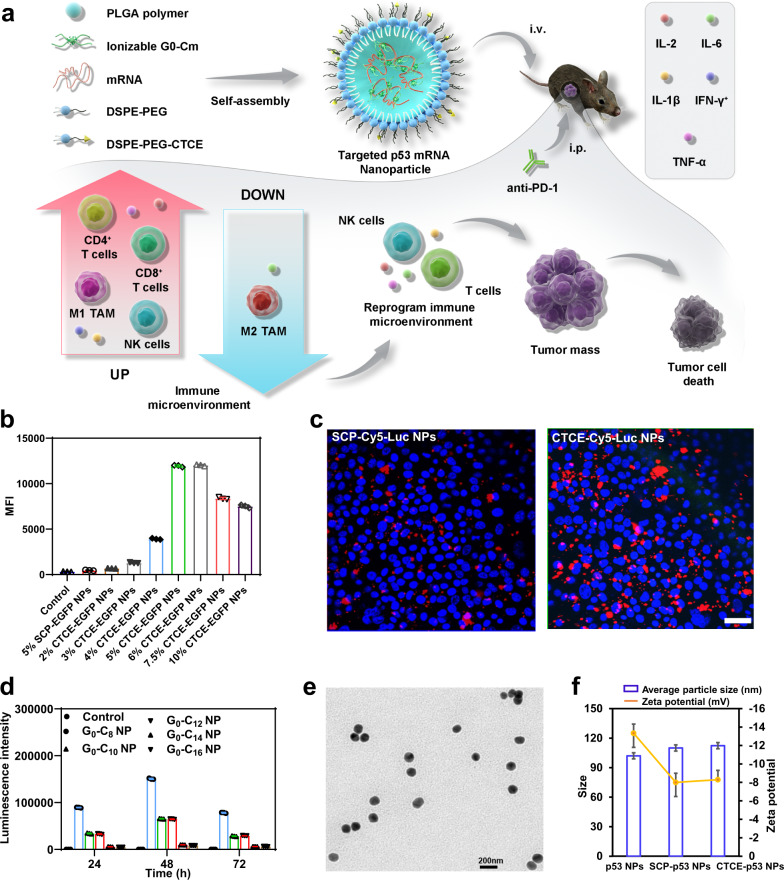
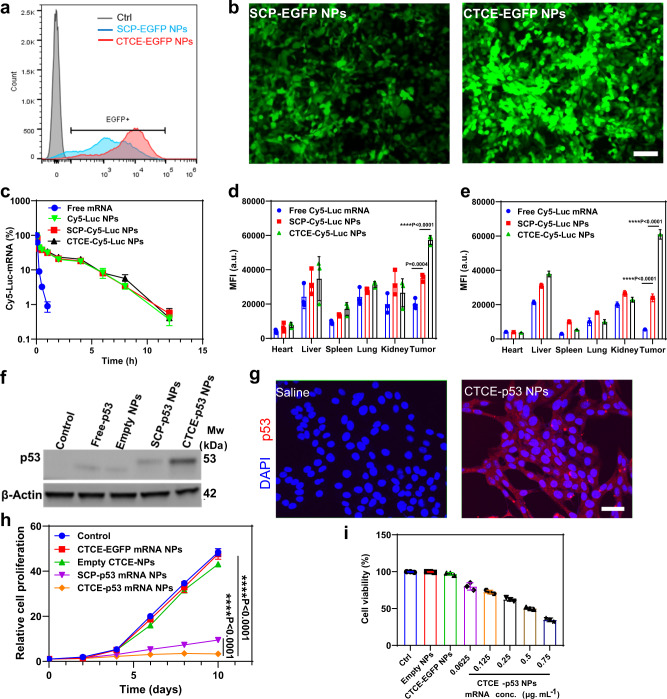
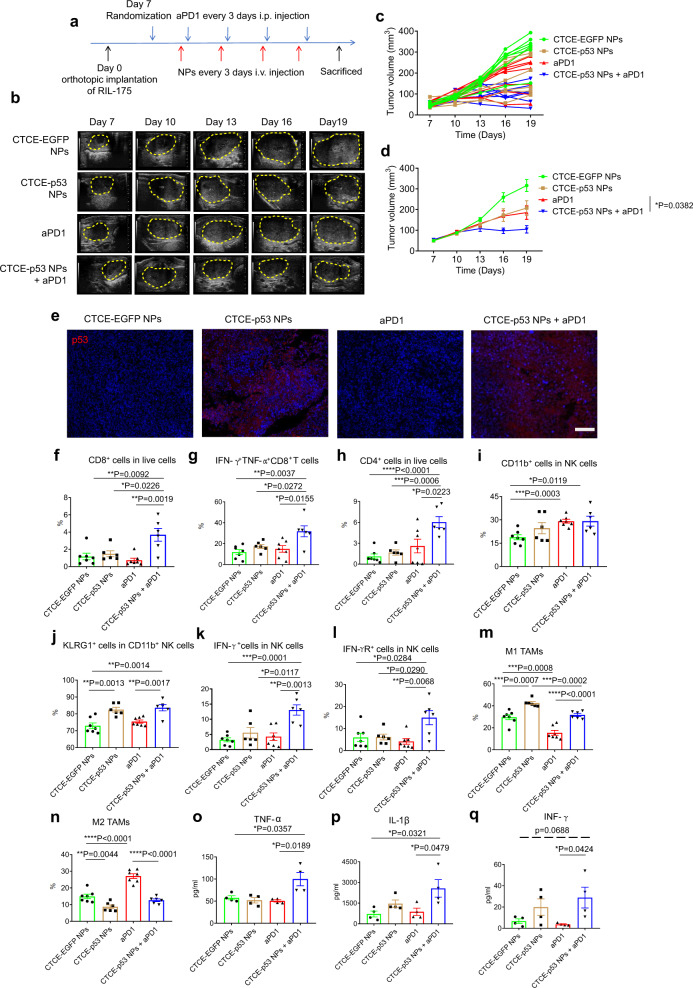
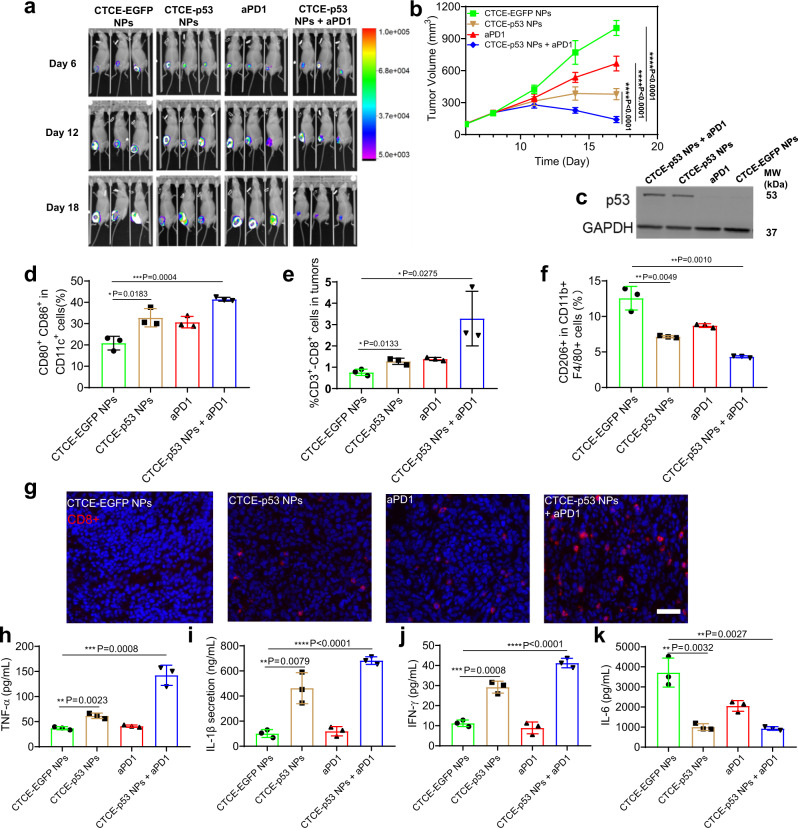
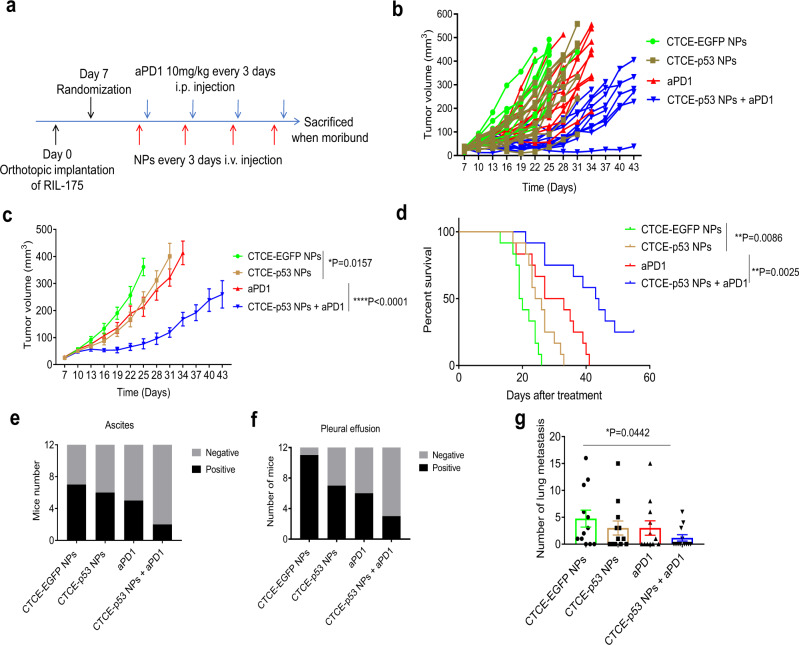
Immunotherapy with immune checkpoint blockade (ICB) has shown limited benefits in hepatocellular carcinoma (HCC) and other cancers, mediated in part by the immunosuppressive tumor microenvironment (TME). As p53 loss of function may play a role in immunosuppression, we herein examine the effects of restoring p53 expression on the immune TME and ICB efficacy. We develop and optimize a CXCR4-targeted mRNA nanoparticle platform to effectively induce p53 expression in HCC models. Using p53-null orthotopic and ectopic models of murine HCC, we find that combining CXCR4-targeted p53 mRNA nanoparticles with anti-PD-1 therapy effectively induces global reprogramming of cellular and molecular components of the immune TME. This effect results in improved anti-tumor effects compared to anti-PD-1 therapy or therapeutic p53 expression alone. Thus, our findings demonstrate the reversal of immunosuppression in HCC by a p53 mRNA nanomedicine when combined with ICB and support the implementation of this strategy for cancer treatment.


Conflict of interest statement

D.G.D. received consultant fees from Bayer, BMS, Simcere, Sophia Biosciences, Innocoll and Surface Oncology and has received research grants from Bayer, Merrimack, Exelixis, Surface Oncology and BMS. No reagents or support from these companies was used for this study. No potential conflicts of interest were disclosed by other authors.

Figures

Fig. 1
Fig. 1. CXCR4-targeted nanoparticles (NPs) for p53 mRNA delivery to hepatocellular carcinoma (HCC).
a Schematic of CXCR4-targeted p53 mRNA NPs and combinatorial strategy using anti-PD-1 therapy to reprogram the immunosuppressive tumor microenvironment for effective treatment of p53-deficient HCC. The combination of CTCE-p53 NPs and PD-1 blockade effectively and globally reprogrammed the immune TME of HCC, as indicated by activation of CD8+ T cells and NK cells, favorable polarization of TAMs towards the anti-tumor phenotype, and increased expression of anti-tumor cytokines. b Flow cytometric analysis of cellular uptake of CTCE-EGFP mRNA NPs with different CTCE peptide densities versus SCP-EGFP mRNA NPs with 5% SCP density in RIL-175 HCC cells (n = 3 cell samples/group). c Confocal fluorescence imaging of RIL-175 cell uptake of SCP-Cy5-Luciferase (Luc) mRNA NPs versus CTCE-Cy5-Luc mRNA NPs after 4 h treatment. Scale bar: 100 µm. d Effect of different cationic lipid-like materials G0-Cm on the transfection efficacy of Luc-mRNA NPs (mRNA concentration: 0.25 μg/mL, n = 3 samples/group). e TEM image of CTCE-mRNA NPs. Scale bar, 200 nm. f Average particle size and zeta potential of the p53 NPs, SCP-p53 NPs, and CTCE-p53 NPs (n = 3 samples/group). Data in b, d, and f are presented as mean values ± SD. For c and e: a representative image from one of five independent fields of view in a single experiment. Source data are provided as a Source Data file.
Fig. 2
Fig. 2. CXCR4-mediated HCC-targeting of CTCE-mRNA NPs in vitro and in vivo.
a Flow cytometry analysis of in vitro transfection efficiency (%GFP positive cells) of SCP-EGFP NPs vs. CTCE-EGFP NPs in p53-null RIL-175 cells. b Immunofluorescence of RIL-175 cells transfected with SCP-EGFP NPs vs. CTCE-EGFP NPs (magnification, ×50). Cells were treated with SCP-EGFP NPs or CTCE-EGFP NPs for 12 h and further incubated for 24 h with fresh cell culture medium (mRNA concentration: 0.5 μg/mL). Scale bar: 100 µm. c Circulation profile of free Cy5-Luc mRNA, SCP-Cy5-Luc NPs, and CTCE-Cy5-Luc NPs (mRNA dose: 350 μg/kg) after i.v. administration. d, e Quantification of biodistribution of free Cy5-Luciferase mRNA, SCP-Cy5-Luciferase (Luc) NPs, and CTCE-Cy5-Luc NPs in orthotopic (d) and ectopic (e) HCC grafts (n = 3 mice/group;) at 24 h post-i.v. injection (mRNA dose: 350 μg/kg). f Western blot analysis of p53 protein expression after treatments (mRNA concentration: 0.5 μg/mL). β-actin was used as the loading control. g Immunofluorescence for p53 in RIL-175 cells after treatment with saline or CTCE-p53 NPs (p53 mRNA concentration: 0.25 μg/mL). Scale bar: 50 µm. h RIL-175 cell growth rate after treatment with control (saline), CTCE-EGFP NPs, empty NPs, SCP-p53 NPs, or CTCE-p53 NPs (mRNA concentration: 0.5 μg/mL) (n = 3 cell samples/group). i RIL-175 cell viability after treatment with control (saline), empty NPs, control NPs (CTCE-EGFP NPs), or CTCE-p53 NPs with different mRNA concentrations (0.0625–0.75 μg/mL) (n = 3 cell samples/group). Statistical significance was calculated using one-way ANOVA with a Tukey post-hoc test. Data in c, d, e, h, and i are presented as mean values ± SD. **P < 0.01; ***P < 0.001; ****P < 0.0001. For b and g: a representative image from one of five independent fields of view in a single experiment. For f: this experiment was repeated five times independently with similar results. Source data are provided as a Source Data file.
Fig. 3
Fig. 3. PD-1 blockade combined with CXCR4-targeted p53 mRNA NPs reprograms the immune TME and promotes anti-tumor immunity in HCC.
a Timeline of tumor implantation and treatment schedule in the orthotopic HCC model. The mice with orthotopic RIL-175 tumor were treated with CTCE-EGFP mRNA NPs or CTCE-p53 mRNA NPs every 3 days for 4 i.v. injections. Anti-PD-1 (aPD1) was given at 10 mg/kg every 3 days by i.p. injection. b High-frequency ultrasound images of the RIL-175 orthotopic tumor-bearing C57BL/6 mice at Day 7, 10, 13, 16, and 19 (n = 7 mice/group). c, d Tumor growth profile of each indicated treatment group (n = 7 mice/group). e Immunofluorescence staining of p53 expression in RIL-175 tumors (red signals) in different groups. Scale bar: 200 µm. fn Flow cytometry analysis (n = 7 samples for CTCE-EGFP-NPs and aPD1group; n = 6 samples for CTCE-p53 NPs and CTCE-p53 NPs+aPD1 group) of tumor CD8 + cytotoxic T cells (f), IFN-g+TNF-α+ cells among CD8+ T cells (g), CD4+ T cells (h), CD11b+ cells when gating on NK cells (i), KLRG1+ cells when gating on CD11b+ NK cells (j), IFN-g+ cells when gating on NK cells (k), IFN-gR+ cells when gating on NK cells (l), M1-like tumor-associated macrophages (TAMs) (m), and M2-like TAMs (n). oq Increased levels of expression of TNF-α (o), IL-1β (p), and IFN-γ (q) in RIL-175 tumor tissues by protein array measurements after combination treatment (n = 4 tumor samples/group). Statistical significance was calculated via one-way ANOVA with a Tukey post-hoc test. All data are presented as mean ± S.E.M. For e: this experiment was repeated thrice independently with similar results. *P < 0.05; **P < 0.01; ***P < 0.001; ****P < 0.0001. Source data are provided as a Source Data file.
Fig. 4
Fig. 4. Combining CXCR4-targeted p53 mRNA NPs with PD-1 blockade reprograms the immune TME and promotes antitumor immunity in ectopic HCC.
a Bioluminescence images of the luciferase-expressing RIL-175 tumors grafted subcutaneously in C57Bl/6 mice after 6, 12, and 18 days of treatment (n = 3 mice/group). b Tumor growth rate in each treatment group (n = 7 mice/group; ***P < 0.001). c Western blotting analysis on the expression levels of p53 protein in the s.c. RIL-175 tumors after treatment. GAPDH was used as the loading control. df Flow cytometry analysis (n = 3 tumor samples from each group) of lymph node CD80+CD86+ dendritic cells gating on CD11c+ cells (d), and tumor-infiltrating CD8+CD3+ T cells (e) and M2-like CD206+F4/80+CD11b+ macrophages (f). g Representative immunofluorescence for CD8 (in red) to confirm intratumoral T cell infiltration after treatment with CTCE-EGFP NPs, anti-PD-1 (aPD1), CTCE-p53 NPs, or the combination. Scale bar: 200 µm. hk Protein array analysis of differential expression of cytokines in s.c. HCC tissues after treatment (n = 3 samples per group): TNF-α (h), IL-1β (i), IFN-γ (j), and IL-6 (k). Statistical significance was calculated using one-way ANOVA with a Tukey post-hoc test. All data are presented as mean ± S.D. For c and g: this experiment was repeated thrice independently with similar results. *P < 0.05; **P < 0.01; ***P < 0.001; ****P < 0.0001. Source data are provided as a Source Data file.
Fig. 5
Fig. 5. Therapeutic efficacy of the combination of CTCE-p53-mRNA NPs with anti-PD-1 (aPD1) in orthotopic HCC model.
a Timeline of tumor implantation and treatment schedule for survival studies in HCC models. b, c Tumor growth profile of each indicated treatment group (n = 12 mice/group). d Survival data from the RIL-175 orthotopic mouse model (n = 12 mice/group). e, f The combination of CTCE-p53-mRNA NPs with aPD1 reduces ascites (e) and pleural effusion (f). g The combination of CTCE-p53-mRNA NPs with aPD1 reduces lung metastasis (n = 12 mice for each group). Statistical significance was calculated via one-way ANOVA with a Tukey post-hoc test. All data are presented as mean ± S.E.M. *P < 0.05; **P < 0.01. Source data are provided as a Source Data file.
Fig. 6
Fig. 6. In vivo safety of CTCE-p53 NPs and the combination with anti-PD-1 antibody.
ak Serum biochemistry analysis (n = 4 samples for CTCE-EGFP NPs group; n = 5 samples for the left four groups). lr Whole blood panel tests analysis (n = 5 samples for each group). All data are presented as mean ± S.E.M. Source data are provided as a Source Data file.

References

    1. Kastenhuber ER, Lowe SW. Putting p53 in context. Cell. 2017;170:1062–1078. doi: 10.1016/j.cell.2017.08.028. - DOI - PMC - PubMed
    1. Guo G, Yu M, Xiao W, Celis E, Cui Y. Local activation of p53 in the tumor microenvironment overcomes immune suppression and enhances antitumor immunity. Cancer Res. 2017;77:2292. doi: 10.1158/0008-5472.CAN-16-2832. - DOI - PMC - PubMed
    1. Cui, Y. & Guo, G. Immunomodulatory function of the tumor suppressor p53 in host immune response and the tumor microenvironment. Int. J. Mol. Sci.17, 1942 (2016). - PMC - PubMed
    1. Lujambio A, et al. Non-cell-autonomous tumor suppression by p53. Cell. 2013;153:449–460. doi: 10.1016/j.cell.2013.03.020. - DOI - PMC - PubMed
    1. Blagih J, Buck MD, Vousden KH. p53, cancer and the immune response. J. Cell Sci. 2020;133:jcs237453. doi: 10.1242/jcs.237453. - DOI - PubMed

Publication types