. 2022 Feb 9;13(1):779.
doi: 10.1038/s41467-022-28385-7.

Selenophosphate synthetase 1 deficiency exacerbates osteoarthritis by dysregulating redox homeostasis

Affiliations

Selenophosphate synthetase 1 deficiency exacerbates osteoarthritis by dysregulating redox homeostasis

Donghyun Kang et al. Nat Commun. .

Abstract

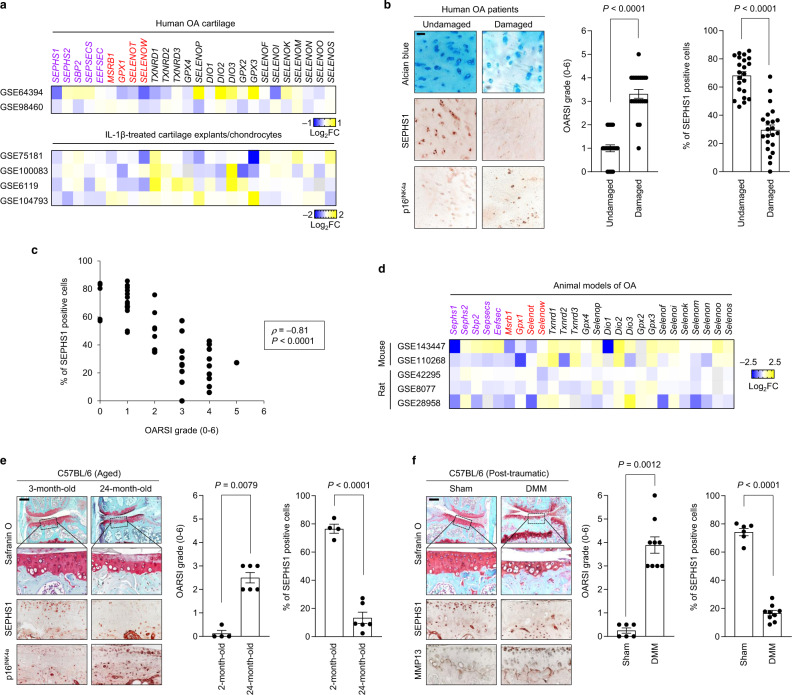
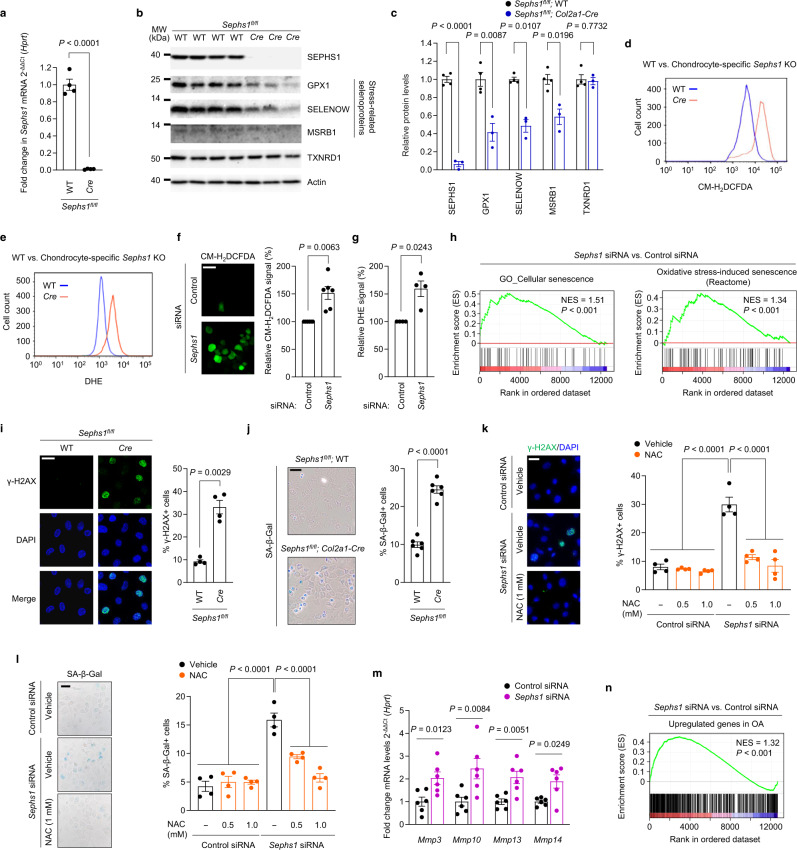
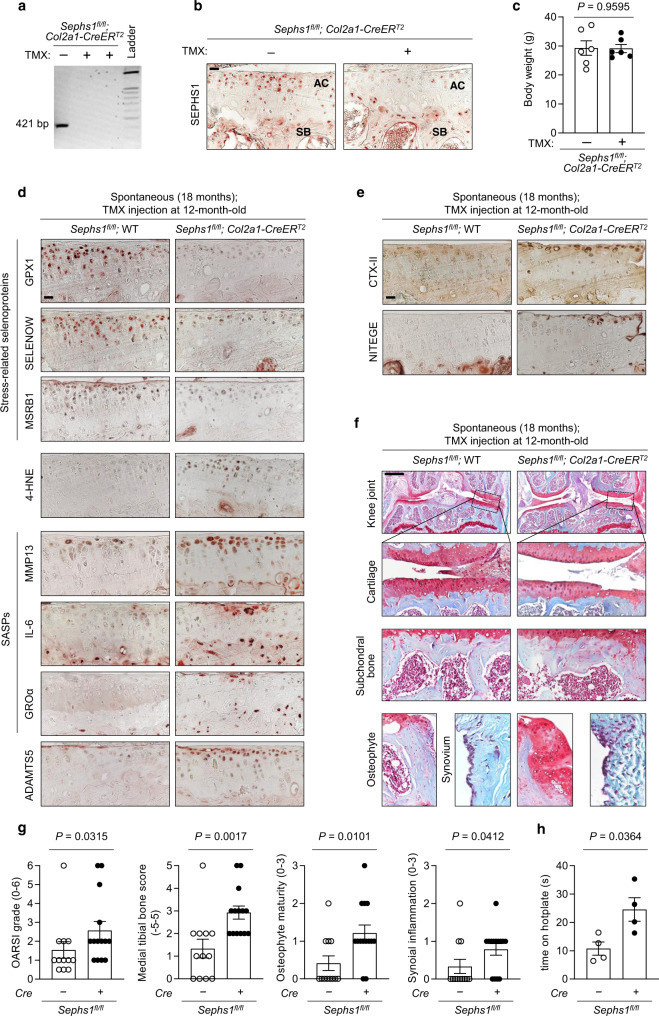
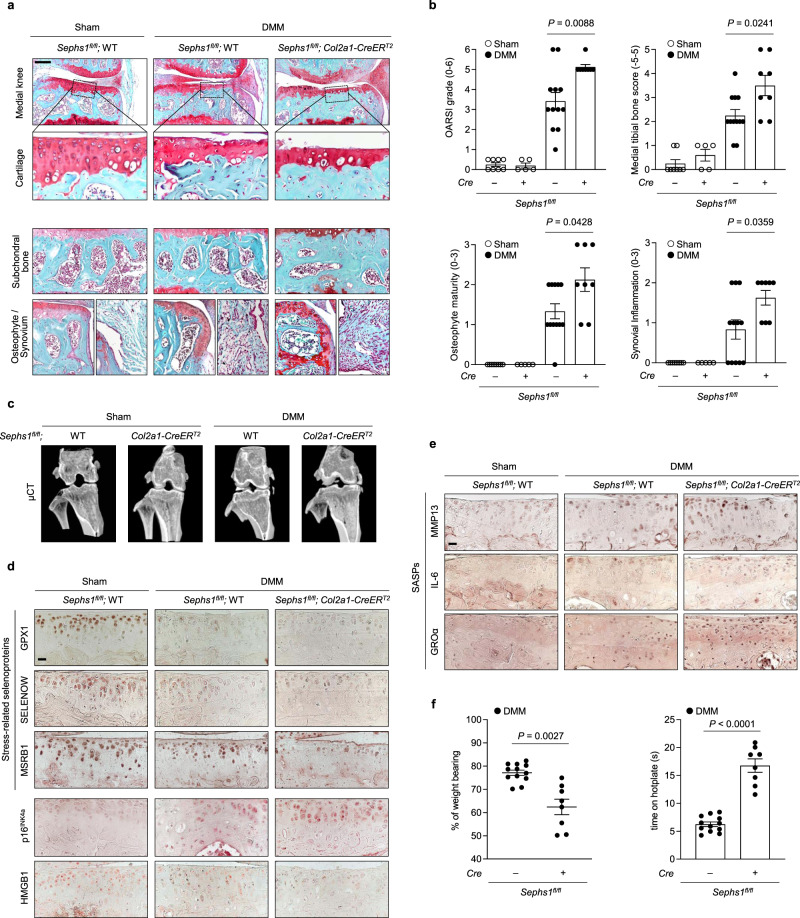
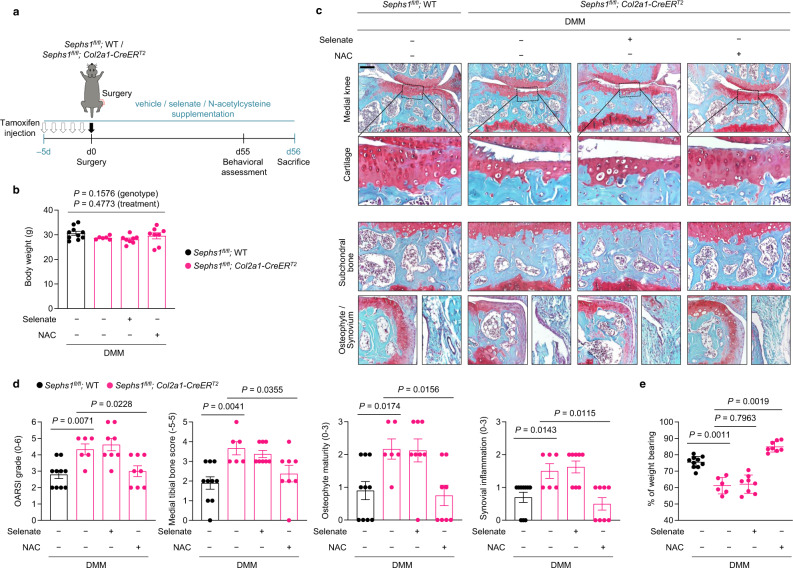
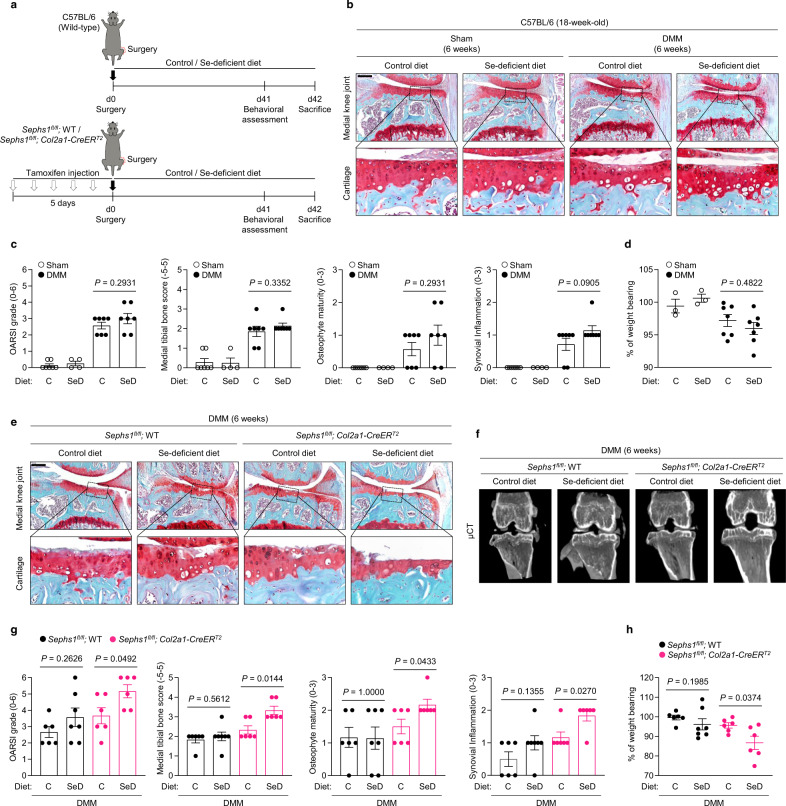
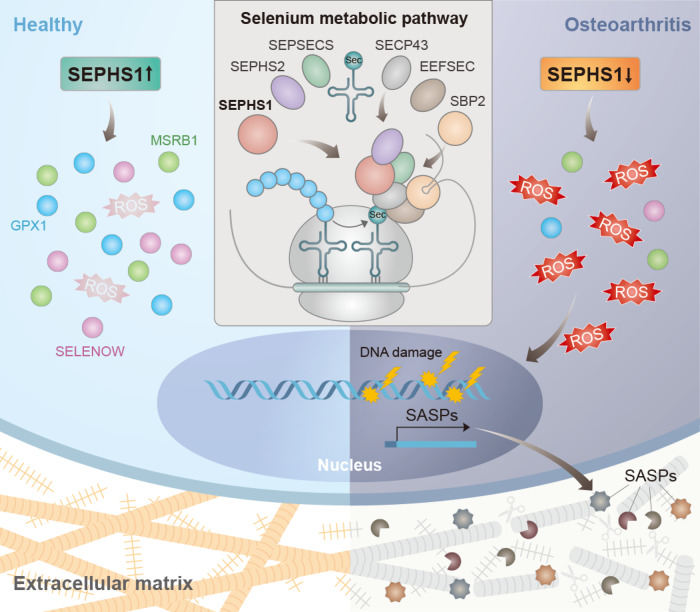
Aging and mechanical overload are prominent risk factors for osteoarthritis (OA), which lead to an imbalance in redox homeostasis. The resulting state of oxidative stress drives the pathological transition of chondrocytes during OA development. However, the specific molecular pathways involved in disrupting chondrocyte redox homeostasis remain unclear. Here, we show that selenophosphate synthetase 1 (SEPHS1) expression is downregulated in human and mouse OA cartilage. SEPHS1 downregulation impairs the cellular capacity to synthesize a class of selenoproteins with oxidoreductase functions in chondrocytes, thereby elevating the level of reactive oxygen species (ROS) and facilitating chondrocyte senescence. Cartilage-specific Sephs1 knockout in adult mice causes aging-associated OA, and augments post-traumatic OA, which is rescued by supplementation of N-acetylcysteine (NAC). Selenium-deficient feeding and Sephs1 knockout have synergistic effects in exacerbating OA pathogenesis in mice. Therefore, we propose that SEPHS1 is an essential regulator of selenium metabolism and redox homeostasis, and its dysregulation governs the progression of OA.


Conflict of interest statement

The authors declare no competing interests.

Figures

Fig. 1
Fig. 1. SEPHS1 expression is downregulated in the human and mouse OA cartilage.
a Fold change (FC) heatmaps of the expression of components of selenium metabolic pathways (purple), stress-related selenoproteins (red), and other selenoproteins (black) in human OA and OA-relevant conditions. Public transcriptome datasets generated from human OA cartilage (GSE64394 and GSE98460), IL-1β-treated cartilage explant (GSE100083), and IL-1β-treated chondrocytes (GSE75181, GSE6119, and GSE104793) were analyzed. b Cartilage sections from the undamaged or damaged region of human OA cartilage were stained with Alcian blue and immunostained against SEPHS1 and p16INK4a. The extent of cartilage destruction was evaluated by the OARSI grading system and SEPHS1-positive cells were quantified (n = 22). c Spearman’s rank correlation between OARSI grade and SEPHS1 positivity using human knee cartilage samples from (b). d FC heatmaps of the expression of the indicated genes in the cartilage of OA animal models. Public transcriptome datasets generated from OA models of mice (GSE143447 and GSE110268) and rats (GSE42295, GSE8077, and GSE28958) were analyzed. e Safranin O staining of cartilage sections and immunohistochemistry of SEPHS1 and p16INK4a from 3- and 24-month-old mice. The extent of cartilage destruction was evaluated by the OARSI grading system and SEPHS1-positive cells were quantified (n = 4, 6 respectively). The inset in the images is shown as magnified images in the bottom row. f Safranin O staining of cartilage sections and immunohistochemistry of SEPHS1 and MMP13 from control (sham) and post-traumatic OA cartilage (8 weeks after DMM) of mice. The extent of cartilage destruction was evaluated by the OARSI grading system and SEPHS1-positive cells were quantified (n = 6, 9 respectively). The inset in the images is shown as magnified images in the bottom row. Scale bars: b 50 μm, e, f 200 μm. b, e, f Data represent means ± s.e.m. P values are from two-tailed Mann–Whitney U test (b, e, f; middle panel), two-tailed t test (b, e, f; right panel), or two-tailed Spearman’s rank correlation test (c). Cohen’s d effect sizes are provided in Supplementary Table 8.
Fig. 2
Fig. 2. Downregulation of SEPHS1 in OA cartilage leads to oxidative stress-induced cellular senescence in chondrocytes.
a Relative mRNA expression level of Sephs1 in primary cultured chondrocytes isolated from Sephs1fl/fl or Sephs1fl/fl; Col2a1-Cre mice (n = 4). b Western blot analysis of selenoproteins in primary cultured chondrocytes isolated from Sephs1fl/fl (n = 4) and Sephs1fl/fl; Col2a1-Cre mice (n = 3). c Quantification of protein levels in (b) (n = 4, 3 respectively). d, e Fluorescence-activated cell sorting (FACS) analysis of d CM-H2DCFDA and e DHE fluorescence in primary cultured chondrocytes isolated from Sephs1fl/fl and Sephs1fl/fl; Col2a1-Cre mice. f, g Immunofluorescence staining and quantification of f CM-H2DCFDA (n = 6) and g DHE (n = 4) fluorescence in chondrocytes transfected with negative control siRNA or siRNA targeting Sephs1. h GSEA of ‘Cellular senescence’ and ‘Oxidative stress-induced senescence’ gene sets in chondrocytes transfected with negative control siRNA or siRNA targeting Sephs1. i Immunofluorescence staining of γ-H2AX and quantification of γ-H2AX positivity in primary cultured chondrocytes isolated from Sephs1fl/fl and Sephs1fl/fl; Col2a1-Cre mice (n = 4). j SA-β-Gal staining and quantification of SA-β-Gal positivity in primary cultured chondrocytes isolated from Sephs1fl/fl and Sephs1fl/fl; Col2a1-Cre mice (n = 6). k, l Quantification of k immunofluorescence positivity of γ-H2AX and l SA-β-Gal positivity in primary cultured chondrocytes transfected with negative control siRNA or siRNA targeting Sephs1 followed by NAC treatment at the indicated doses (n = 4). m Relative mRNA expression of SASP factors in chondrocytes transfected with negative control siRNA or siRNA targeting Sephs1 (n = 6). n GSEA of the ‘Upregulated genes in OA’ gene set in chondrocytes transfected with negative control siRNA or siRNA targeting Sephs1. Scale bars: f, i, k 25 μm, j, l 50 μm. a, c, f, g, i Data represent means ± s.e.m. P values are from two-tailed t test (a, c, f, g, i, j, m) or two-way ANOVA followed by Dunnett’s post-hoc test (k, l). For GSEA plots in h, n, enrichment plots are displayed with the determined nominal P value and normalized enrichment score (NES). Unprocessed immunoblot images are provided in Supplementary Fig. 10.
Fig. 3
Fig. 3. Chondrocyte-specific Sephs1 knockout in adult mice accelerates aging-associated OA development in knee joints.
a PCR verification of Sephs1 inducible conditional knockout (iCKO) after five intraperitoneal injections of tamoxifen (TMX) in 12-week-old Sephs1fl/fl; Col2a1-CreERT2 mice. b Immunostaining of SEPHS1 in knee joint sections displaying the articular cartilage (AC) and subchondral bone (SB) of 21-week-old WT and Sephs1-iCKO littermates. c Body weight measurements at 8 weeks after five times injections of vehicle or TMX in 12-week-old Sephs1fl/fl; Col2a1-CreERT2 mice (n = 6). d, e Sephs1fl/fl or Sephs1fl/fl; Col2a1-CreERT2 mice were injected with TMX at 12 months of age, and the appearance of aging-associated OA phenotypes was analyzed at 18 months. d Stress-related selenoproteins (GPX1, SELENOW, and MSRB1), 4-HNE, SASPs (MMP13, IL-6, and GROα), ADAMTS5, and e cartilage matrix neoepitopes (telopeptides of type II collagen, CTX-II and aggrecan neoepitope, NITEGE) were detected by immunohistochemistry in cartilage sections. f Joint sections were stained with safranin O, fast green, and hematoxylin. The inset in the images is shown as magnified images in the bottom row. g Scores of OA manifestations, including cartilage destruction, subchondral bone sclerosis, osteophyte formation, and synovial inflammation (n = 12 for Sephs1fl/fl; n = 14 for Sephs1fl/fl; Col2a1-CreERT2). h Hotplate pain assay in 18-month-old WT and Sephs1-iCKO mice (n = 4). Scale bars: b, d, e 25 μm, f 500 μm. c, g, h Data represent means ± s.e.m. P values are from two-tailed t test (c, h) or two-tailed Mann–Whitney U test (g). Cohen’s d effect sizes are provided in Supplementary Table 8. Mankin scores and SBP thickness measurements are provided in Supplementary Figs. 11 and 12.
Fig. 4
Fig. 4. Chondrocyte-specific temporal Sephs1 knockout exacerbates post-traumatic OA in mice.
a Sephs1fl/fl or Sephs1fl/fl; Col2a1-CreERT2 12-week-old mice were injected with TMX five times and subjected to sham operation or DMM surgery. Joint sections were stained with safranin O, fast green, and hematoxylin. The inset in the images is shown as magnified images in the bottom row. b Cartilage destruction, subchondral bone sclerosis, osteophyte formation, and synovial inflammation determined by safranin O/hematoxylin staining and scored (n = 8 for sham-operated WT; n = 5 for sham-operated Sephs1-iCKO; n = 12 for DMM-operated WT; n = 8 for DMM-operated Sephs1-iCKO). c Representative microcomputed tomography (μCT) images of sham- or DMM-operated WT and Sephs1-iCKO mice. d Stress-related selenoproteins (GPX1, SELENOW, and MSRB1), p16INK4a, HMGB1, and e SASPs (MMP13, IL-6, and GROα) were detected by immunohistochemistry in cartilage sections. f Hotplate pain assays in DMM-operated WT and Sephs1-iCKO mice (left panel, n = 12 for WT; n = 8 for Sephs1-iCKO). The percentage of weight placed on the sham- or DMM-operated limb versus the contralateral limb of WT and Sephs1-iCKO mice (right panel, n = 12 for WT; n = 8 for Sephs1-iCKO). Scale bars: a 200 μm, d, e 25 μm. b, f Data represent means ± s.e.m. P values are from Kruskal–Wallis test followed by Mann–Whitney U test (b) or two-tailed t test (f). Cohen’s d effect sizes are provided in Supplementary Table 8. Mankin scores and SBP thickness measurements are provided in Supplementary Figs. 11 and 12.
Fig. 5
Fig. 5. NAC treatment rescues the exacerbated OA phenotypes in Sephs1-iCKO mice.
a Schematic illustration of NAC or dietary selenate supplementation in the post-traumatic OA model of Sephs1-iCKO mice. b Body weight of 21-week-old DMM-operated mice after completion of the supplementation scheme (n = 10 for DMM-operated WT mice treated with vehicle; n = 6 for DMM-operated Sephs1-iCKO mice treated with vehicle; n = 8 for DMM-operated Sephs1-iCKO mice supplemented with selenate; n = 8 for DMM-operated Sephs1-iCKO mice treated with NAC). c Joint sections were stained with safranin O, fast green, and hematoxylin. The inset in the images is shown as magnified images in the bottom row. d Cartilage destruction, subchondral bone sclerosis, osteophyte formation, and synovial inflammation determined by safranin O/hematoxylin staining and scored (n = 10, 6, 8, 8 respectively). e The percentage of weight placed on the DMM-operated limb versus the contralateral limb of WT and Sephs1-iCKO mice treated with or without NAC or selenate determined using a static weight bearing test (n = 10, 6, 8, 8 respectively). Scale bar: c 200 μm. b, d, e Data represent means ± s.e.m. P values are from two-way ANOVA followed by Tukey’s post hoc test (b) or S–R–H test followed by Mann–Whitney U test (d, e). Cohen’s d effect sizes are provided in Supplementary Table 8. Mankin scores and SBP thickness measurements are provided in Supplementary Figs. 11 and 12.
Fig. 6
Fig. 6. Dietary selenium deficiency augments the progression of OA in Sephs1-iCKO mice.
a Schematic illustration of dietary selenium depletion in the post-traumatic OA model of C57BL/6 mice (top) or Sephs1-iCKO mice (bottom). b Twelve-week-old C57BL/6 mice received sham operation or DMM surgery. Joint sections were stained with safranin O, fast green, and hematoxylin. The inset in the images is shown as magnified images in the bottom row. c Cartilage destruction, subchondral bone sclerosis, osteophyte formation, and synovial inflammation determined by safranin O/hematoxylin staining and scored (n = 7 for sham-operated mice fed with control (C) diet; n = 4 for sham-operated mice fed with selenium-deficient (SeD) diet; n = 7 for DMM-operated mice fed with control diet; n = 7 for DMM-operated mice fed with selenium-deficient diet). d Percentage of weight placed on the sham- or DMM-operated limb versus the contralateral limb over 15 min analyzed using a dynamic weight bearing test (n = 7, 4, 7, 7 respectively). e Twelve-week-old WT and Sephs1-iCKO mice were operated with sham or DMM surgery. Joint sections were stained with safranin O, fast green, and hematoxylin. The inset in the images is shown as magnified images in the bottom row. f Representative μCT images of sham- or DMM-operated WT and Sephs1-iCKO mice fed with the indicated diets. g Cartilage destruction, subchondral bone sclerosis, osteophyte formation, and synovial inflammation determined by safranin O/hematoxylin staining and scored (n = 6 for DMM-operated WT mice fed the control diet; n = 7 for DMM-operated WT mice fed the selenium-deficient diet; n = 6 for DMM-operated Sephs1-iCKO mice fed the control diet; n = 6 for DMM-operated Sephs1-iCKO mice fed the selenium-deficient diet). h Percentage of weight placed on the DMM-operated limb versus the contralateral limb over 15 min analyzed by a dynamic weight bearing test (n = 6, 7, 6, 6 respectively). Scale bars: b, e 200 μm. c, d, g, h Data represent means ± s.e.m. P values are from Kruskal–Wallis test followed by Mann–Whitney U test (c, d) or S–R–H test followed by Mann–Whitney U test (g, h). Cohen’s d effect sizes are provided in Supplementary Table 8. Mankin scores and SBP thickness measurements are provided in Supplementary Figs. 11 and 12.
Fig. 7
Fig. 7. Schematic diagram representing the molecular pathway by which SEPHS1 deficiency exacerbates OA development.
SEPHS1 expression is downregulated in OA chondrocytes. SEPHS1 deficiency impairs cellular capacity to synthesize stress-related selenoproteins with oxidoreductase functions in chondrocytes, elevating ROS levels. This event, in turn, enhances DNA damage, cellular senescence, and SASPs expression, causing the catabolic degeneration of the cartilage matrix by fostering chronic inflammation in the joint environments.

Similar articles

Cited by

References

    1. Loeser RF, Goldring SR, Scanzello CR, Goldring MB. Osteoarthritis: A disease of the joint as an organ. Arthritis Rheumatism. 2012;64:1697–1707. - PMC - PubMed
    1. Brandt KD, Radin EL, Dieppe PA, van de Putte L. Yet more evidence that osteoarthritis is not a cartilage disease. Ann. Rheum. Dis. 2006;65:1261–1264. - PMC - PubMed
    1. Little CB, Hunter DJ. Post-traumatic osteoarthritis: from mouse models to clinical trials. Nat. Rev. Rheumatol. 2013;9:485–497. - PubMed
    1. Muir H. The chondrocyte, architect of cartilage. Biomechanics, structure, function, and molecular biology of cartilage matrix macromolecules. Bioessays. 1995;17:1039–1048. - PubMed
    1. Mobasheri A, et al. The role of metabolism in the pathogenesis of osteoarthritis. Nat. Rev. Rheumatol. 2017;13:302–311. - PubMed

Publication types