. 2022 Feb 9;13(1):770.
doi: 10.1038/s41467-022-28240-9.

Caffeine blocks SREBP2-induced hepatic PCSK9 expression to enhance LDLR-mediated cholesterol clearance

Affiliations

Caffeine blocks SREBP2-induced hepatic PCSK9 expression to enhance LDLR-mediated cholesterol clearance

Paul F Lebeau et al. Nat Commun. .

Abstract

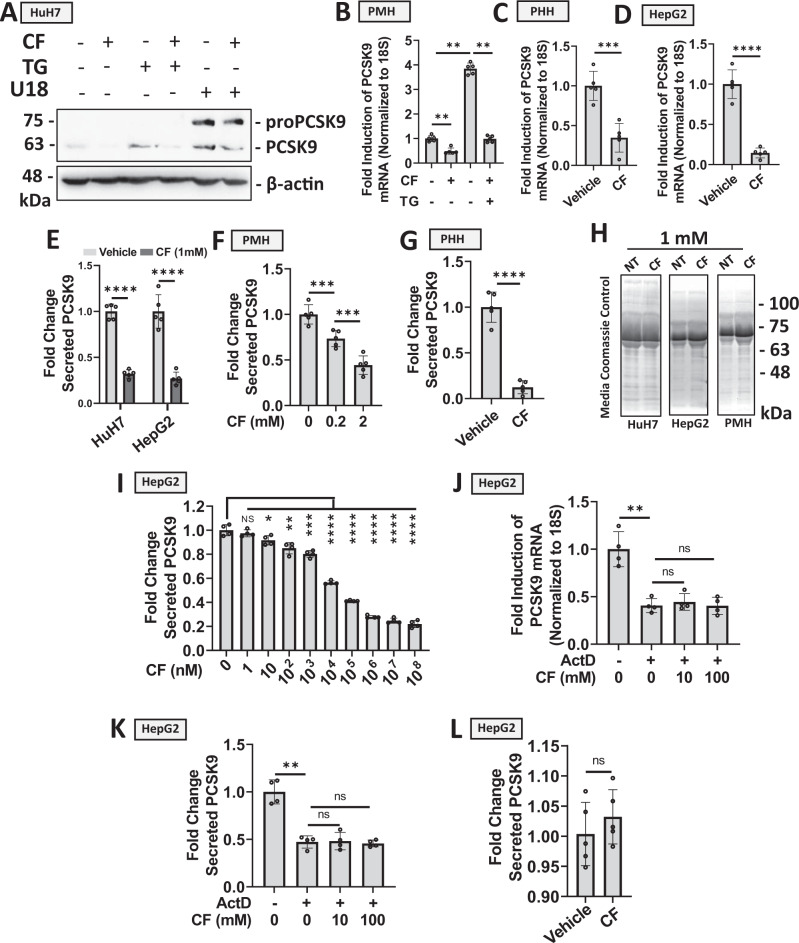
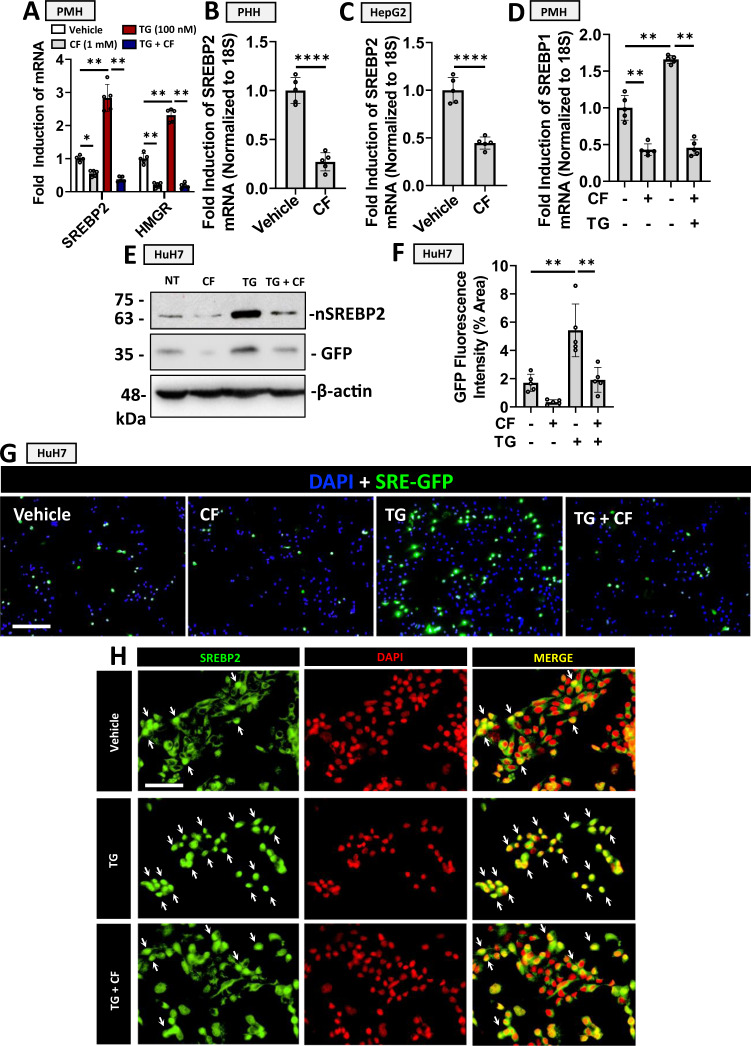
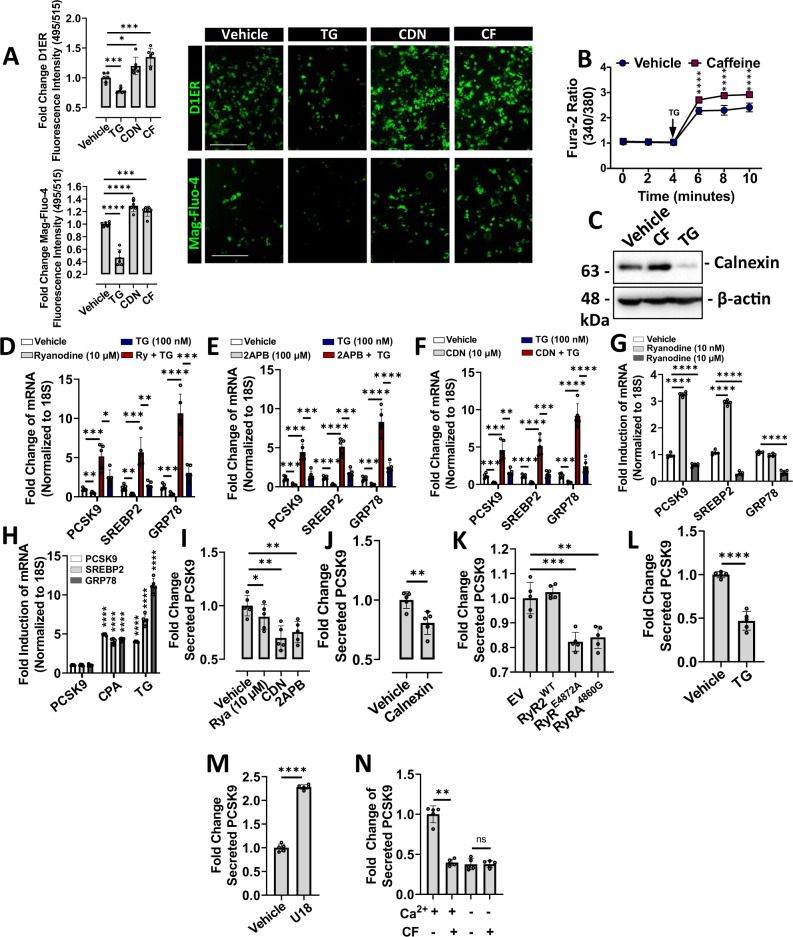
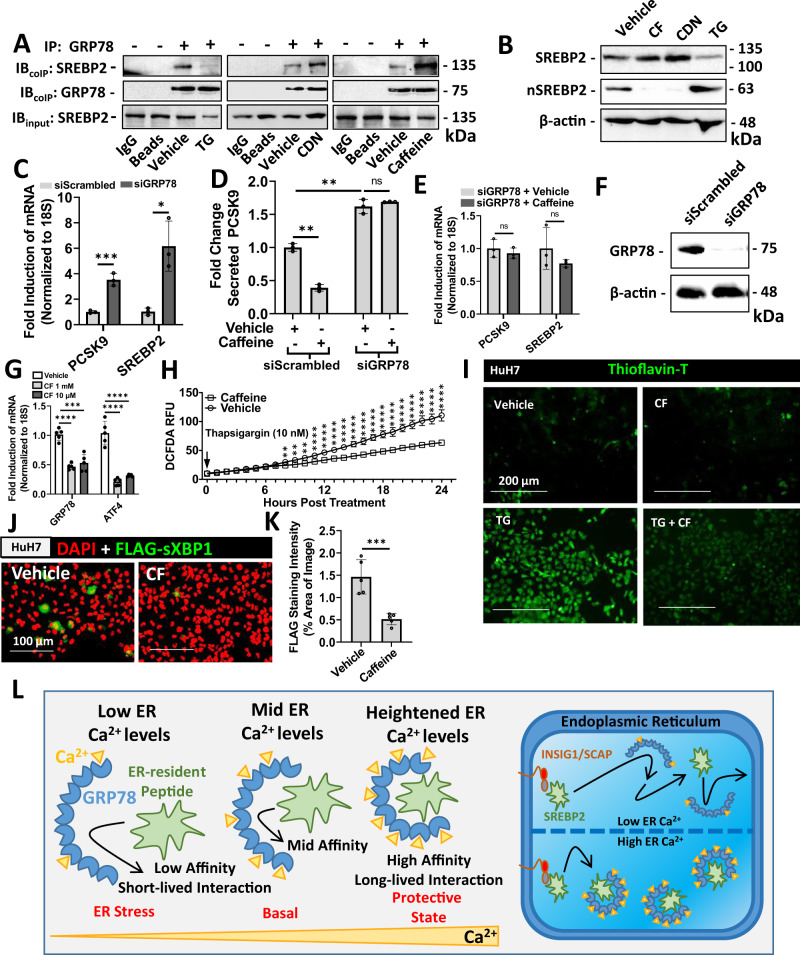
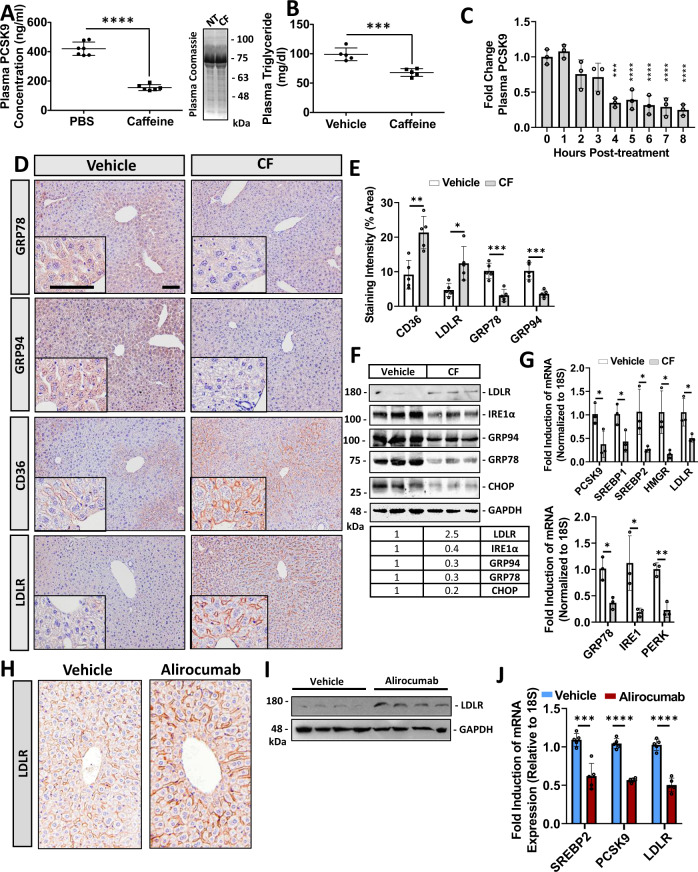
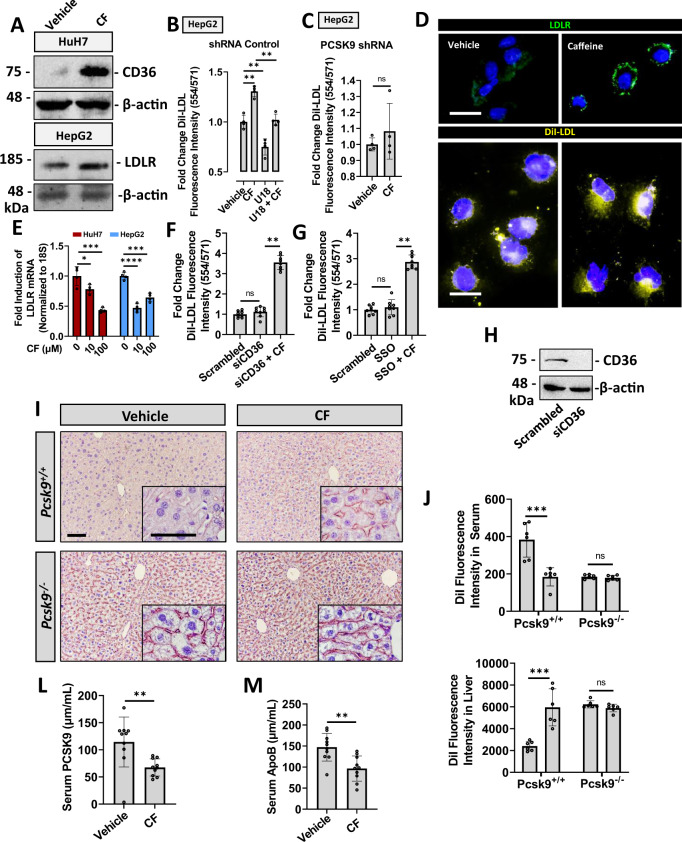
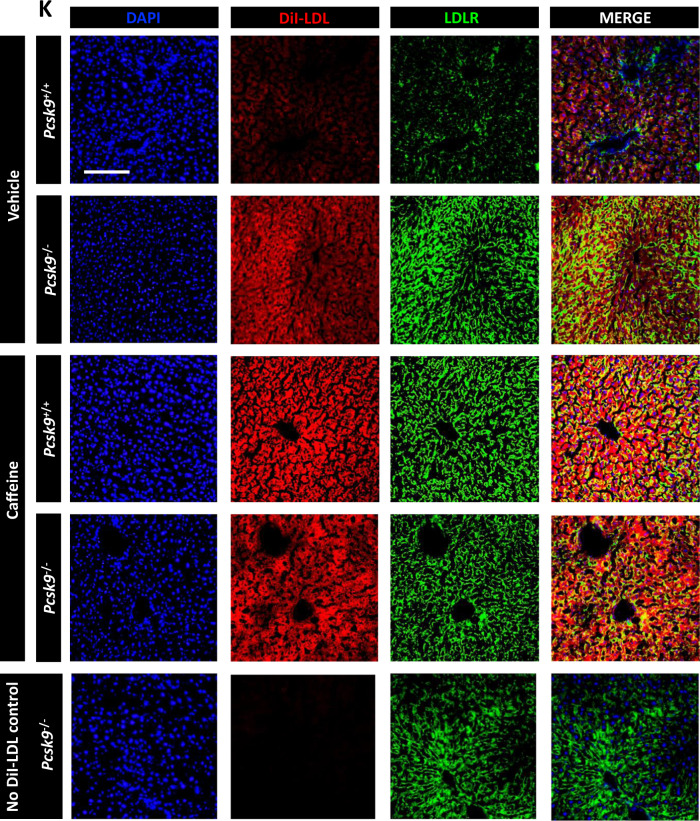
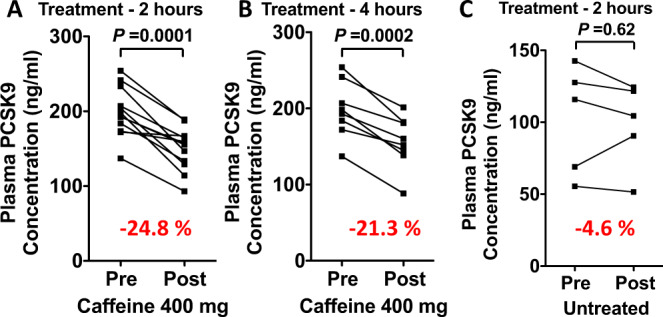
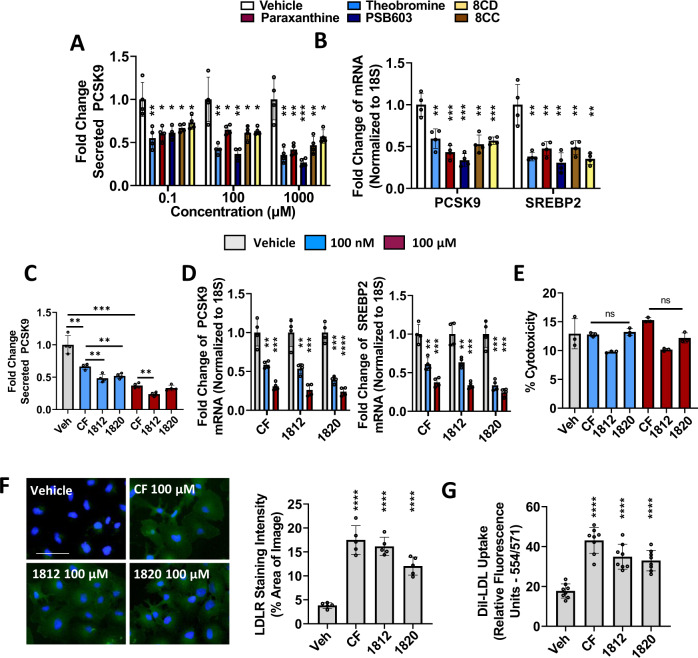
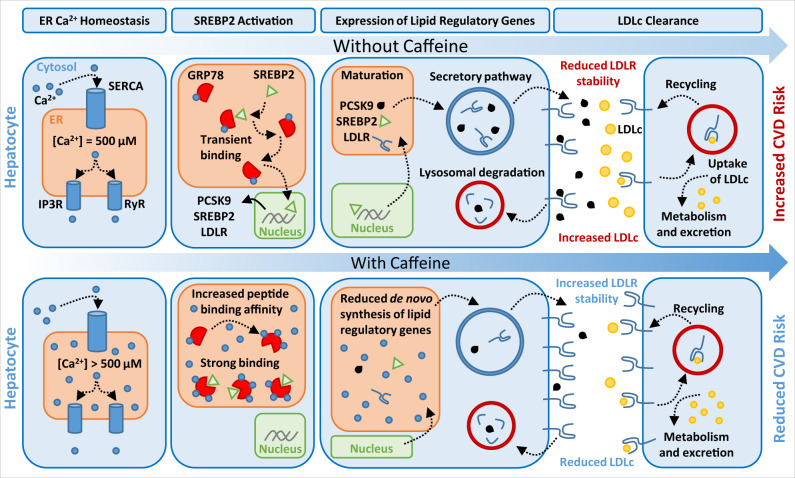
Evidence suggests that caffeine (CF) reduces cardiovascular disease (CVD) risk. However, the mechanism by which this occurs has not yet been uncovered. Here, we investigated the effect of CF on the expression of two bona fide regulators of circulating low-density lipoprotein cholesterol (LDLc) levels; the proprotein convertase subtilisin/kexin type 9 (PCSK9) and the low-density lipoprotein receptor (LDLR). Following the observation that CF reduced circulating PCSK9 levels and increased hepatic LDLR expression, additional CF-derived analogs with increased potency for PCSK9 inhibition compared to CF itself were developed. The PCSK9-lowering effect of CF was subsequently confirmed in a cohort of healthy volunteers. Mechanistically, we demonstrate that CF increases hepatic endoplasmic reticulum (ER) Ca2+ levels to block transcriptional activation of the sterol regulatory element-binding protein 2 (SREBP2) responsible for the regulation of PCSK9, thereby increasing the expression of the LDLR and clearance of LDLc. Our findings highlight ER Ca2+ as a master regulator of cholesterol metabolism and identify a mechanism by which CF may protect against CVD.


Conflict of interest statement

The authors declare the following competing interests: P.F.L., J.H.B, P.S., M.S., J.M., and R.C.A. have filed an institution-owned patent, entitled: “Compounds for Reducing Cholesterol and Treating Liver and Kidney Disease” (18-069_USProv) that relates to the development of caffeine and methylxanthine derivatives to lower cholesterol. R.C.A, J.M., G.P., and M.A.T. have an equity stake in Systemic Therapeutics. G.P. has received honoraria from Amgen and Sanofi. G.R.S. is a co-founder and shareholder of Espervita Therapeutics, a company developing new medications for liver cancer. McMaster University has received funding from Espervita Therapeutics, Esperion Therapeutics, Poxel Pharmaceuticals and Novo Nordisk for research conducted in the laboratory of G.R.S. G.R.S. has received consulting/speaking fees from Astra Zeneca, Eli Lilly, Esperion Therapeutics, Merck, Poxel Pharmaceuticals and Takeda. M.A.T. is the CEO of Exerkine Corporation and Stayabove Nutrition and is actively evaluating and marketing multi-nutrient supplements for the treatment of aging, obesity, muscular dystrophy and mitochondrial disease. No other authors declare any competing interests.

Figures

Fig. 1
Fig. 1. Caffeine blocks PCSK9 expression and secretion in hepatocytes.
A HuH7 cells were treated with established inducers of PCSK9 expression, thapsigargin (TG; 100 nM) or U18 (10 µM), in the presence or absence of caffeine (CF; 200 µM) for 24 h. PCSK9 expression was assessed via immunoblot analysis. BD PCSK9 expression was also assessed in primary mouse hepatocytes (PMH) and primary human hepatocytes (PHH), as well as in HepG2 cells treated with CF and TG via real-time PCR (n = 5 biologically independent samples per group; data presented are mean ± s.d.). EG PCSK9 ELISAs were assayed on the medium harvested from CF-treated HuH7, HepG2, PMHs, and PHHs (n = 5 biologically independent samples per group). H Coomassie blue staining of electrophoretically resolved medium harvested from CF-treated cells served to examine the effect of CF on total secreted protein levels. I Secreted PCSK9 levels from HepG2 cells treated with an increasing dose of CF (n = 4 biologically independent samples per group; data presented are mean ± s.d). JK PCSK9 expression and secretion were assessed in HepG2 cells treated in the presence and absence of CF and a blocker of transcription, ActD (10 µM) (n = 4 biologically independent samples per group; data presented are mean ± s.d). L Finally, ELISAs were also used to measure secreted PCSK9 levels in CF-treated HepG2 cells (1 mM) transfected with a CMV-driven PCSK9 vector (n = 5 biologically independent samples per group; data presented are mean ± s.d). Statistical comparisons between two groups were conducted using unpaired two-tailed Student’s t-tests, while comparisons between multiple groups were compared using one-way ANOVAs with the Tukey HSD post-hoc test (*p < 0.05; **p < 0.01; ***p < 0.001; ****p < 0.0001). Source data are provided as a Source Data file.
Fig. 2
Fig. 2. Caffeine blocks SREBP2 activation in hepatocytes.
A The effect of caffeine (CF; 200 µM) on SREBP2 and SREBP1 mRNA expression was examined in primary mouse hepatocytes (PMH) in the presence and absence of thapsigargin (TG; 100 nM), an established activator of SREBPs. The downstream product of SREBP2 transcriptional activity, HMGR, was also examined. B, C The inhibitory effect of CF on SREBP2 was also examined in primary human hepatocytes (PHH) and HepG2 cells. D CF-mediated SREBP1 inhibition was also examined in PMH (*p < 0.05). EG HuH7 cells were transfected with a reporter construct encoding a sterol-regulatory element-driven green fluorescent protein (SRE-GFP; green color). Cells were subsequently treated with CF (200 µM) and/or TG (100 nM) 24 h later. GFP and nuclear (n)SREBP2 expression were examined via immunoblot analysis. GFP expression was also assessed via immunofluorescent staining, which was quantified using ImageJ. H The cellular localization of SREBP2 (green color) in CF- and TG-treated HuH7 cells was also examined via immunofluorescent staining. Nuclei containing activated SREBP2 are indicated by white arrows. For all data in this figure, n = 5 biologically independent samples per group; data presented are mean ± s.d). Scale bars; G 100 µm; H 20 µm. Statistical comparisons between two groups were conducted using unpaired two-tailed Student’s t-tests, while comparisons between multiple groups were compared using one-way ANOVAs with the Tukey HSD post-hoc test (*p < 0.05; **p < 0.01; ***p < 0.001; ****p < 0.0001). Source data are provided as a Source Data file.
Fig. 3
Fig. 3. Endoplasmic reticulum Ca2+ modulates PCSK9 expression and secretion.
A HuH7 cells were either transfected with a FRET-based ER-resident Ca2+ sensor, D1ER, or pre-loaded with the low-affinity Ca2+ indicator, Mag-Fluo-4 (green color). Cells were subsequently treated with either thapsigargin (TG; 100 nM), CDN (100 µM) or caffeine (CF; 200 µM) for 24 h. Fluorescence intensity was measured using a fluorescent spectrophotometer and visualized using a fluorescent microscope (n = 6 biologically independent samples per group; data presented are mean ± s.d.). B HuH7 cells were pre-treated with either CF or vehicle for 24 h and loaded with the high-affinity Ca2+ dye, Fura-2-AM. Exposure of cells to a high dose of TG (1 mM) induced a spontaneous depletion of endoplasmic reticulum (ER) Ca2+ (*, p < 0.05 vs. vehicle-treated). C The expression of an ER-resident Ca2+ binding protein, calnexin, was examined in CF- and TG-treated HuH7 cells using immunoblots. DG PCSK9, SREBP2, and GRP78 mRNA expression was assessed in HuH7 cells treated with a variety of ER Ca2+ modulators including: ryanodine receptor agonist (ryanodine, 10 nM), ryanodine receptor antagonist (ryanodine, 10 µM), SERCA pump activator CDN (100 µM) and IP3R antagonist 2APB (50 µm), in the presence and absence of TG (100 nM) for 24 h. H mRNA transcript levels were also examined in HuH7 cells treated with SERCA pump inhibitors, TG (100 nM), and CPA (10 µM). IK The effect of pharmacologic agents and plasmid-derived CMV-driven proteins, known to affect ER Ca2+ levels, on secreted PCSK9 levels was then examined using ELISAs. L, M Secreted PCSK9 levels were also examined in TG- and U18-treated cells. N The effect of CF on secreted PCSK9 levels was also examined in cells incubated in Ca2+-deficient medium. For panels DN: n = 5 biologically independent samples per group; data presented are mean ± s.d. Scale bars; 200 µm. Statistical comparisons between two groups were conducted using unpaired two-tailed Student’s t-tests, while multiple groups were compared using one-way ANOVAs with the Tukey HSD post hoc test (*p < 0.05; **p < 0.01; ***p < 0.001; ****p < 0.0001). Source data are provided as a Source Data file.
Fig. 4
Fig. 4. Endoplasmic reticulum Ca2+ regulates the interaction between GRP78 and SREBP2.
A HuH7 cells were treated with control agents thapsigargin (TG; 100 nM), which causes ER Ca2+ depletion, or CDN (100 µM), a compound known to increase endoplasmic reticulum (ER) Ca2+ levels. The effect of caffeine (CF; 200 µM) was also assessed. Following 24 h treatment, a co-immunoprecipitation (IP) for GRP78 was carried out. Protein loading was normalized to GRP78 and relative co-immunoprecipitated SREBP2 was examined via immunoblots (IB). B The effect of CF, CDN, and TG on the retention of ER-resident pre-mature SREBP2, and on the activated nuclear SREBP2 (nSREBP2), was also assessed via IB. (C-E) To confirm the role of GRP78 in CF-mediated PCSK9 inhibition, mRNA transcript and secreted protein levels were examined in HepG2 cells exposed to siRNA targeted against GRP78 (siGRP78) (n = 3 biologically independent samples per group; data presented are mean ± s.d.). F Knockdown of GRP78 was confirmed via IB. G ER stress markers were assessed in primary human hepatocytes (PHH) treated with CF (200 µM) and CDN (10 µM) via real-time PCR (n = 5 biologically independent samples per group; data presented are mean ± s.d.). H The effect of CF on reactive oxygen species production, resulting from the treatment of TG (100 nM), was also assessed in HuH7 cells (n = 3 biologically independent samples per group; data presented are mean ± s.d.). I ER stress-induced amyloid deposition was examined using the fluorescent stain, Thioflavin-T (green color). J, K HuH7 cells were transfected with the ER activated indicator plasmid encoding an ER stress-inducible FLAG-sXBP1 (green color; n = 5 biologically independent samples per group; data presented are mean ± s.d.). Staining intensity was quantified using ImageJ software. L Model in which Ca2+ promotes the GRP78-mediated sequestration of SREBP2 in the ER. Statistical comparisons between two groups were conducted using unpaired two-tailed Student’s t-tests, while multiple groups were compared using one-way ANOVAs with the Tukey HSD post hoc test (*p < 0.05; **p < 0.01; ***p < 0.001; ****p < 0.0001). Source data are provided as a Source Data file.
Fig. 5
Fig. 5. Caffeine reduces chaperone expression and blocks hepatic PCSK9 expression in mice.
12-week-old male C57BL/6J mice were treated with caffeine (CF; 50 mg/kg) and fasted for 8 h prior to sacrifice (n = 6). A, B Plasma PCSK9 and triglyceride levels were measured using an ELISA and colorimetric assays, respectively (n = 6 biologically independent samples per group; data presented are mean ± s.d.). C The time-dependence of CF on plasma PCSK9 levels was also determined using an ELISA (n = 5 biologically independent samples per group; data presented are mean ± s.d.). D The livers of these mice were assessed for cell-surface expression of LDLR and CD36, as well as the ER stress markers GRP78 and GRP94 via immunohistochemical staining (n = 5). E Staining was quantified using ImageJ software (n = 5 biologically independent samples per group; data presented are mean ± s.d.). F, G The expression of ER stress markers (GRP78, PERK, and IRE1α) as well as cholesterol-regulatory genes (LDLR, PCSK9, HMGR, SREBP1 and SREBP2) were also examined using immunoblots and real-time PCR (n = 5 biologically independent samples per group; data presented are mean ± s.d.). HI 12-week-old male C57BL/6J mice were treated with a single subcutaneous injection of the anti-PCSK9 neutralizing antibody, alirocumab (30 mg/kg), for 10 days (n = 10). LDLR expression was assessed using immunohistochemistry and immunoblots. J The mRNA expression of SREBP2, PCSK9, and the LDLR was assessed via real-time PCR (n = 5 biologically independent samples per group; data presented are mean ± s.d.). Bars; 50 µm. Statistical comparisons between two groups were conducted using unpaired two-tailed Student’s t-tests, while multiple groups were compared using one-way ANOVAs with the Tukey HSD post hoc test (*p < 0.05; **p < 0.01; ***p < 0.001; ****p < 0.0001). Source data are provided as a Source Data file.
Fig. 6
Fig. 6. Caffeine increases hepatic LDL uptake in a PCSK9-dependent manner.
A The expression of PCSK9-regulated receptors, LDLR and CD36, was examined in caffeine (CF)-treated cultured hepatocytes (200 µM). B The uptake and intracellular accumulation of fluorescently labeled DiI-LDL was examined in cells treated with CF in the presence or absence of the PCSK9-inducer, U18, using a fluorescent spectrophotometer (n = 4 biologically independent samples per group; data presented are mean ± s.d.). C The effect of CF treatment (200 µM) on DiI-labeled LDL uptake was also examined in PCSK9 shRNA knockdown cells (n = 4 biologically independent samples per group; data presented are mean ± s.d.). D Immunofluorescent staining of cell-surface LDLR was carried out in live CF pre-treated HepG2 cells (200 µM). Cellular DiI-LDL accumulation was also visualized in CF-treated HepG2 cells using a fluorescent microscope. E Expression of the LDLR in CF-treated HuH7 and HepG2 cells was measured via real-time PCR (n = 4 biologically independent samples per group; data presented are mean ± s.d.). FG The uptake of DiI-LDL was quantified in HepG2 cells transfected with siRNA targeted against CD36 and a pharmacologic inhibitor of CD36 (SSO) (10 µM) (n = 8 biologically independent samples per group; data presented are mean ± s.d.). H Knockdown was confirmed via immunoblotting. Pcsk9+/+ and Pcsk9−/− mice were treated with either PBS-vehicle or CF, as well as fluorescently labeled DiI-LDL (1 µg/kg). IK Hepatic cell-surface LDLR expression was assessed via immunohistochemistry (DAPI: blue; LDLR: green; DiI-LDL: red). J Hepatic and serum DiI-LDL fluorescence intensity was quantified using a fluorescent spectrophotometer and visualized using a fluorescent microscope (n = 6 biologically independent samples per group; data presented are mean ±  s.d.). L, M Native LDLc was also examined in 18-week-old male C57BL/6J mice treated with CF (30 mg/kg) every 24 h for 14 days via ELISA of the surrogate marker ApoB; serum PCSK9 levels were also assessed via ELISA (n = 10 biologically independent samples per group; data presented are mean ±  s.d.). Scale bars; D 10 µm; I 50 µm; K 100 µm. Statistical comparisons between two groups were conducted using unpaired two-tailed Student’s t-tests, while multiple groups were compared using one-way ANOVAs with the Tukey HSD post hoc test (*p < 0.05; **p < 0.01; ***p < 0.001; ****p < 0.0001). Source data are provided as a Source Data file.
Fig. 7
Fig. 7. Caffeine reduces plasma PCSK9 levels in healthy volunteers.
A, B Healthy subjects between the ages of 22 and 45 years were administered 400 mg (~ 5 mg/kg) of caffeine (CF) following a 12 h fasting period. Plasma PCSK9 levels were measured before administration, as well as 2- and 4 -h following administration (n = 12 and n = 5, respectively). C PCSK9 levels were also measured in a group of individuals (n = 5) that were not administered CF to control for the additional 2 h of fasting time during the experiment. Differences between groups were determined using a paired two-tailed Student’s t-test.
Fig. 8
Fig. 8. Characterization of xanthine-derived compounds as PCSK9 inhibitors.
A, B HepG2 cells were treated with increasing doses of caffeine (CF) metabolites, paraxanthine, and theobromine, as well as xanthine derivatives PSB603, 8CD, and 8CC. Secreted PCSK9 levels were assessed using ELISAs and mRNA transcript via real-time PCR. C, D Cells were treated with CF, as well as MLRA-1812 and MLRA-1820. Secreted PCSK9, as well as PCSK9 mRNA and SREBP2 mRNA were assessed in these cells. E The cytotoxicity of these agents was examined using an LDH assay. F HepG2 cells were treated with CF, MLRA-1812 (100 µM), and MLRA-1820 (100 µM) and assessed for cell-surface LDLR expression via immunofluorescent staining (green color); staining intensities were quantified using ImageJ software. G The uptake of DiI-LDL was also quantified in these cells using a spectrophotometer. *p < 0.05 vs. vehicle; Statistical comparisons between two groups were conducted using unpaired two-tailed Student’s t-tests, while multiple groups were compared using one-way ANOVAs with the Tukey HSD post-hoc test (*p < 0.05; **p < 0.01; ***p < 0.001; ****p < 0.0001). Source data are provided as a Source Data file.
Fig. 9
Fig. 9. Caffeine blocks PCSK9 expression and increases LDLc clearance in hepatocytes.
The treatment of liver hepatocytes with caffeine increases the concentration of ER Ca2+. Excess ER Ca2+ leads to an increase in the peptide binding capacity and chaperone activity of ER-resident GRP78. The result is an ER-resident GRP78-SREBP2 complex with enhanced stability. The failure of SREBP2 to quickly exit the ER leads to a net reduction in expression of lipid regulatory genes, including PCSK9, SREBP2 and PCSK9. With reduced outflow of de novo PCSK9, cell-surface LDLR exhibits increased half-life and abundance, leading in a net increase in LDLc clearance.

References

    1. Horton JD, et al. Combined analysis of oligonucleotide microarray data from transgenic and knockout mice identifies direct SREBP target genes. Proc. Natl Acad. Sci. USA. 2003;100:12027–12032. - PMC - PubMed
    1. Abifadel M, et al. Mutations in PCSK9 cause autosomal dominant hypercholesterolemia. Nat. Genet. 2003;34:154–156. - PubMed
    1. Seidah NG, et al. The secretory proprotein convertase neural apoptosis-regulated convertase 1 (NARC-1): liver regeneration and neuronal differentiation. Proc. Natl Acad. Sci. USA. 2003;100:928–933. - PMC - PubMed
    1. Benjannet S, et al. NARC-1/PCSK9 and its natural mutants: zymogen cleavage and effects on the low density lipoprotein (LDL) receptor and LDL cholesterol. J. Biol. Chem. 2004;279:48865–48875. - PubMed
    1. Maxwell KN, Breslow JL. Adenoviral-mediated expression of Pcsk9 in mice results in a low-density lipoprotein receptor knockout phenotype. Proc. Natl Acad. Sci. USA. 2004;101:7100–7105. - PMC - PubMed

Publication types