. 2022 Feb 9;13(1):775.
doi: 10.1038/s41467-022-28120-2.

Lymphocyte infiltration and thyrocyte destruction are driven by stromal and immune cell components in Hashimoto's thyroiditis

Affiliations

Lymphocyte infiltration and thyrocyte destruction are driven by stromal and immune cell components in Hashimoto's thyroiditis

Qian-Yue Zhang et al. Nat Commun. .

Abstract

Hashimoto's thyroiditis (HT) is the most common autoimmune disease characterized by lymphocytic infiltration and thyrocyte destruction. Dissection of the interaction between the thyroidal stromal microenvironment and the infiltrating immune cells might lead to a better understanding of HT pathogenesis. Here we show, using single-cell RNA-sequencing, that three thyroidal stromal cell subsets, ACKR1+ endothelial cells and CCL21+ myofibroblasts and CCL21+ fibroblasts, contribute to the thyroidal tissue microenvironment in HT. These cell types occupy distinct histological locations within the thyroid gland. Our experiments suggest that they might facilitate lymphocyte trafficking from the blood to thyroid tissues, and T cell zone CCL21+ fibroblasts may also promote the formation of tertiary lymphoid organs characteristic to HT. Our study also demonstrates the presence of inflammatory macrophages and dendritic cells expressing high levels of IL-1β in the thyroid, which may contribute to thyrocyte destruction in HT patients. Our findings thus provide a deeper insight into the cellular interactions that might prompt the pathogenesis of HT.


Conflict of interest statement

The authors declare no competing interests.

Figures

Fig. 1
Fig. 1. Single-cell RNA sequencing and clustering of cells from the thyroid of HT patients.
a Schematic showing sample workflow from operating room to sequencing. b UMAP of total cells from the thyroid tissues of HT patients after quality control, colored by cluster identity. c Violin plots showing the expression levels of representative marker genes across the clusters. The y axis shows the normalized read count. d UMAP of cells from the thyroid tissues of HT patients, colored by subgroup identity. e Single-cell expression heatmap displaying selected top marker genes of per cell cluster based on differential expression testing. TCs T cells, BCs B cells, PrCs proliferative cells, PCs plasma cells, MCs myeloid cells, TFCs thyroid follicular cells, ECs endothelial cells, LECs lymphocytic vessels endothelial cells, F fibroblasts, AC ACTA2+ cells, DC dendritic cells, Mac macrophages. NaB naive B cells, GCB germinal center B cells.
Fig. 2
Fig. 2. Inflammatory stromal cell subgroups and ACKR1+ HEV endothelial cells were identified in the thyroids of HT patients.
Marker gene expression of ACTA2+ cell subgroups (a), fibroblast subgroups (b), and endothelial cell subgroups (c) overlaid on the UMAP visualization.
Fig. 3
Fig. 3. Extensive cell interactions that may facilitate immune cell trafficking exist between stromal cells and immune cells.
a Overview of selected ligand–receptor interactions between the thyroidal stromal cell subsets and immune cell clusters in thyroid tissues of HT patients. Circle size denotes corresponding p value of one-sided permutation test with 10,000 permutations. The means of the average expression level of interacting molecule 1 in cluster 1 and interacting molecule 2 in cluster 2 are indicated by color. b Diagram of the main receptors and ligands expressed on the thyroidal stromal cells and immune cells that are involved in adhesion and cellular recruitment.
Fig. 4
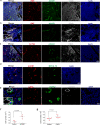
Fig. 4. Polychromatic immunofluorescence staining showing the distribution of myofibroblasts, ACKR1+ venules, and HEVs in thyroid tissues of HT patients.
a Immunostaining for ACKR1, pan-lymphocyte marker CD45, and endothelial cell marker VWF showing the distribution of ACKR1+ cells in the thyroids of HT patients. Large numbers of ACKR1+ vessels were observed in areas with numerous immune cell infiltrations. ACKR1 was not expressed by capillaries that had a diameter <10 μm (blue arrows) in the thyroid tissues of HT patients. b Immunostaining for ACKR1, CD45, and VWF suggesting lymphocyte migration through the vascular wall (white arrows). ACKR1 was not expressed by capillaries (blue arrows). c Immunostaining for ACKR1, pan-lymphocyte marker CD45, and smooth muscle cell marker ACTA2 shows ACKR1 is expressed in venules with compressed lumen structure but not arteries with thick smooth muscle layers (blue arrows). d Immunostaining for ACKR1 and MECA-79 (a specifical antibody to mark the HEVs) shows most ACKR1+ venules are MECA-79+ HEVs. Blue arrow indicates MECA-79 negative venule, which also expressed the ACKR1. e Immunostaining for CD36, ACTA2, and VWF showing the existence of myofibroblasts (CD36 and ACTA2 colocalization) in the vascular structures of thyroid tissues from HT patients. Myofibroblasts were observed merely in ACKR1+ venules with thick endothelial and compressed lumen structure (yellow arrows) but not arteries with thick smooth muscle layers. f The HUEVC overexpressed ACKR1 cultured in the upper chamber promoted trans-endothelial migration of PBMCs under CCL2 and CCL5 chemotaxis (10 ng/ml) in lower chamber. Migrated PBMCs in the lower chamber were counted 20 h after seeding. two-sided Student’s t test, data are representative of three independent experiments. Each dot represents the number of cells in one well of the plate. The error bars indicate SD. g Transwell migration assay shows myofibrocytes transfected with mouse ccl21 significantly promoted the migration of T8.1 T cells at 20 h after cell seeding. two-sided Student’s t test, data are representative of three independent experiments. Each dot represents the number of cells in one well of the plate. The error bars indicate SD.
Fig. 5
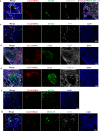
Fig. 5. Distribution of CCL21+ stromal cells in thyroid tissues of HT patients suggests the critical role of CCL21+ fibroblasts in tertiary lymphoid organ organization.
a RNAscope in situ hybridization combined with polychromatic immunofluorescence staining showing the distribution of ACTA2+CCL21+ myofibroblasts in the adventitia of HEVs. The colocalization of CCL21 and ACTA2 (yellow arrows) indicate CCL21+ myofibroblasts in the adventitia of MECA-79+ HEVs. b Adjacent slice of a shows MECA-79+ HEVs are surrounded by many lymphocytes. c The distribution of CCL21+ lymphatic vessels endothelial cells. CCL21 signal shows a lumen structure negative of VWF and ACTA2. df Large numbers of CCL21+ fibroblasts are distributed in the T cell zone of the TLOs. CD20 indicates B cells and CD3E indicates T cells. Section in f is the adjacent slice of (e). CCL21+ cells are positive for COL1A1 but negative for ACTA2. g In areas with less lymphocytic infiltration, all CCL21+ fibroblasts are around lymphocytes.
Fig. 6
Fig. 6. ACKR1+ endothelial cells and CCL21+ fibroblasts or myofibroblasts are few in thyroid tissues of non-HT controls compared with HT patients.
ad CCL21+ fibroblasts or myofibroblasts are significantly increased in thyroid tissues of HT patients compared with non-HT controls. In situ hybridization combined with polychromatic immunofluorescence staining shows FSP1+CCL21+ fibroblasts or myofibroblasts are easily observed in germinal centers (a), area of lymphocyte aggregates (c) or adventitia of vessels (c, white arrows), as well as the area of intact thyroid follicular structures with few lymphocytic infiltration (b) of the thyroid tissues of HT patients. While in thyroid tissues of non-HT controls, fibroblasts are rarely and CCL21+ cells are barely not observed (d). FSP1 is the name for fibroblast-specific protein 1. Panel b is magnified image of the area of rectangular box in (a). e-f HEVs are not observed and ACKR1+ vessels are significantly decreased in thyroid tissues of non-HT controls. Total number of vessels and ACKR1+ vessels (g), and the rate of ACKR1+ vessels (h) in thyroid tissues of non-HT controls are significantly less than that of in HT patients. 4 vs 4, 3–5 regions in each of the 3 different slices for each sample are stained and quantified. Two-sided Student’s t test. The error bars indicate SD.
Fig. 7
Fig. 7. Clustering and cell proportion analysis of merged immune cells from the thyroid and PBMCs of HT patients.
a UMAP of immune cells from the thyroid and PBMC of HT patients, colored by cluster identity. b Total immune cells subgroup proportions in PBMCs and thyroid tissues of HT patients. c UMAP of merged T cells, colored by source of PBMCs or thyroids (left) and cluster identity (right). d Total T cell subgroup proportions in PBMCs and thyroid tissues of HT patients. e UMAP of merged B/plasma cells, colored by source of PBMCs or thyroids (left) and cluster identity (right). f Total B/plasma cell subgroup proportions in PBMCs and thyroid tissues of HT patients. g Violin plots showing the expression levels of representative marker genes across the clusters of B/plasma cells. The y axis shows the normalized read count.
Fig. 8
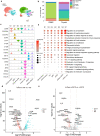
Fig. 8. Comparative analysis revealed possible pathogenic roles of thyroid-specific DC and macrophage subgroups in HT patients.
a UMAP of merged myeloid cells, colored by source of PBMC or thyroid tissues of HT patients (left) and cluster identity (right). b Total myeloid cell subgroup proportions in PBMCs and thyroid tissues of HT patients. c Violin plots showing the expression levels of representative marker genes across myeloid cells clusters. The y axis shows the normalized read count. d Volcano plot showing the differentially expressed genes between subgroup M4 and M7. Hypothesis tests for linear mixed effect models were two-sided with the Bonferroni correction. The x axis indicates log2 (FoldChange) of gene expression in M4 (macrophages) compared to M7 (inflammatory macrophages). Genes with |log2FC| ≥ 0.5 and −log10 (q value) > 2 were colored as red (upregulated in M7) or blue (downregulated in M7). NS: no significance e Volcano plot showing the differential expressed genes between subgroups M5 and M6. Hypothesis tests for linear mixed effect models were two-sided with the Bonferroni correction. The x axis indicates log2 (FoldChange) of gene expression in M5 (cDC2) compared to M6 (inflammatory cDC2). Genes with |log2FC| ≥ 0.5 and −log10(q value) ≥2 were colored as red (upregulated in M6) or blue (downregulated in M6). NS no significance. f Selected Gene Ontology (GO) terms and KEGG Pathways of myeloid cell subgroups. The statistical significance was tested by two-sided hypergeometric test and adjusted by Benjamini–Hochberg correction. Bubble color represents q values, and bubble size represents the enriched gene counts for the term. Mono monocytes, mø macrophages, inflam inflammatory.
Fig. 9
Fig. 9. Hypothesized model of the roles stromal cells play in immune infiltration in HT.
In the thyroid tissues of HT patients, blood immune cells migrate through HEVs under the chemotaxis of CCL19 or CCL21 secreted by CCL21+ myofibroblasts and CCL21+ fibroblasts distributed in the adventitia of HEVs and around HEVs, respectively. Meanwhile, ACKR1+ endothelial cells facilitate the migration by translocating CCL2 and CCL5 secreted by CCL21+ myofibroblast/fibroblasts and immune cells to the lumen of HEVs. Then these infiltrated immune cells are attracted to the sites with scattered CCL21+ fibroblasts. In some regions of the thyroid, where TLOs with germinal centers are generated, CCL21+ fibroblasts are distributed in T cell zones and may play a role in structure organization and T cell signaling.

References

    1. Antonelli A, Ferrari SM, Corrado A, Di Domenicantonio A, Fallahi P. Autoimmune thyroid disorders. Autoimmun. Rev. 2015;14:174–180. - PubMed
    1. Vanderpump MP, et al. The incidence of thyroid disorders in the community: a twenty-year follow-up of the Whickham Survey. Clin. Endocrinol. 1995;43:55–68. - PubMed
    1. Jacobson DL, Gange SJ, Rose NR, Graham NM. Epidemiology and estimated population burden of selected autoimmune diseases in the United States. Clin. Immunol. Immunopathol. 1997;84:223–243. - PubMed
    1. Fiore E, et al. Hashimoto’s thyroiditis is associated with papillary thyroid carcinoma: role of TSH and of treatment with L-thyroxine. Endocr. Relat. Cancer. 2011;18:429–437. - PubMed
    1. Pan X-F, Gu J-Q, Shan Z-Y. Increased risk of thyroid autoimmunity in rheumatoid arthritis: a systematic review and meta-analysis. Endocrine. 2015;50:79–86. - PubMed

Publication types