. 2022 Feb 9;13(1):767.
doi: 10.1038/s41467-022-28372-y.

Single-cell analysis of human glioma and immune cells identifies S100A4 as an immunotherapy target

Affiliations

Single-cell analysis of human glioma and immune cells identifies S100A4 as an immunotherapy target

Nourhan Abdelfattah et al. Nat Commun. .

Abstract

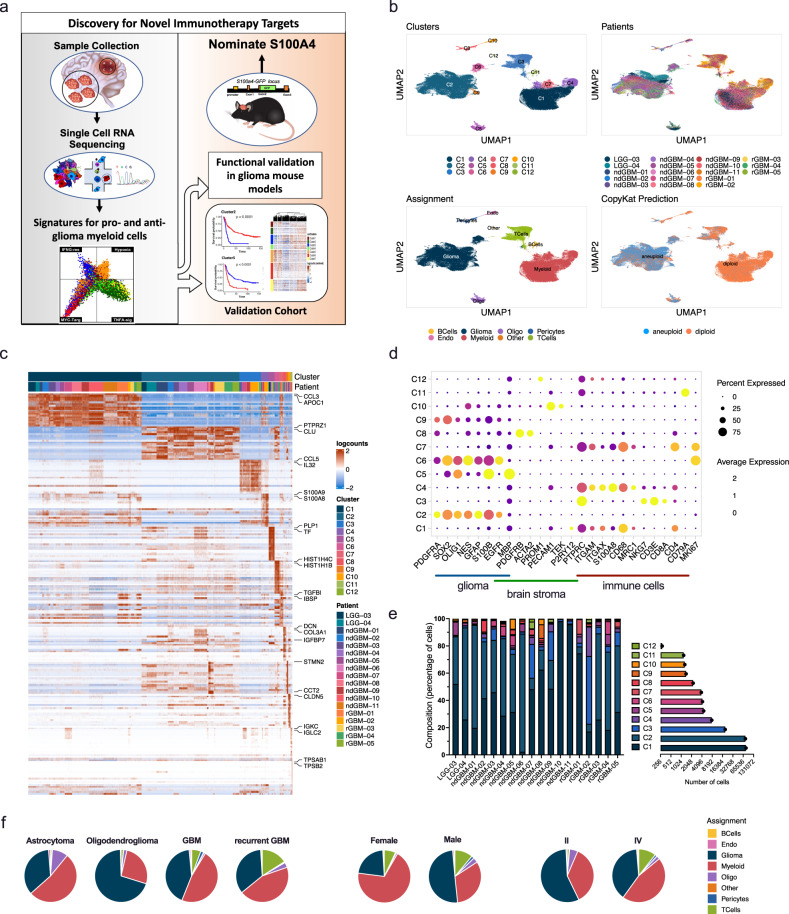
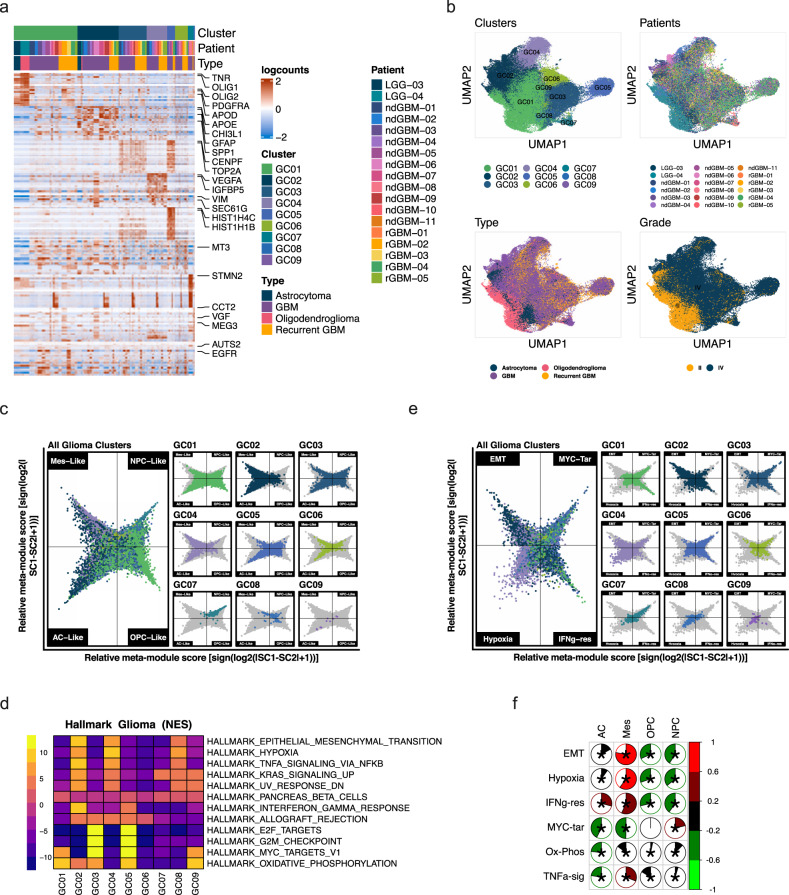
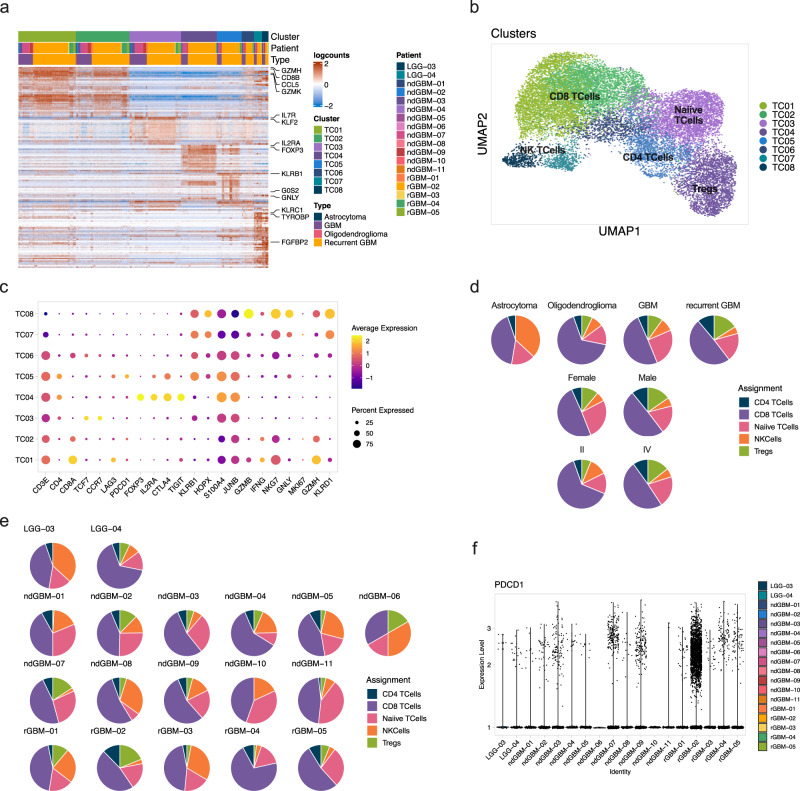
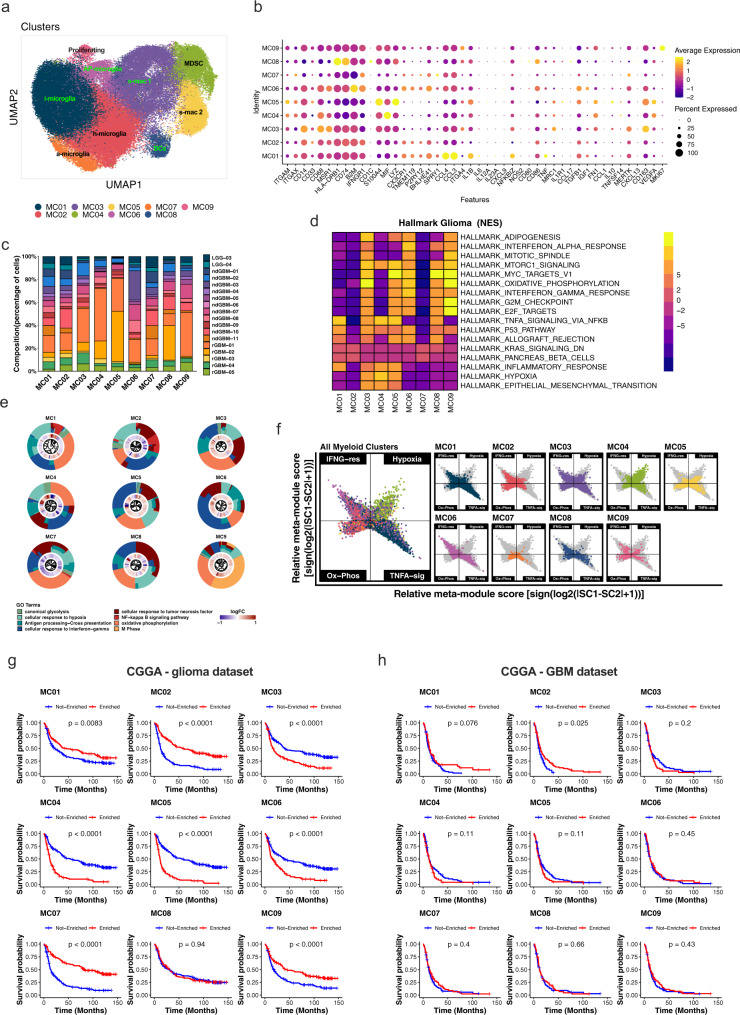
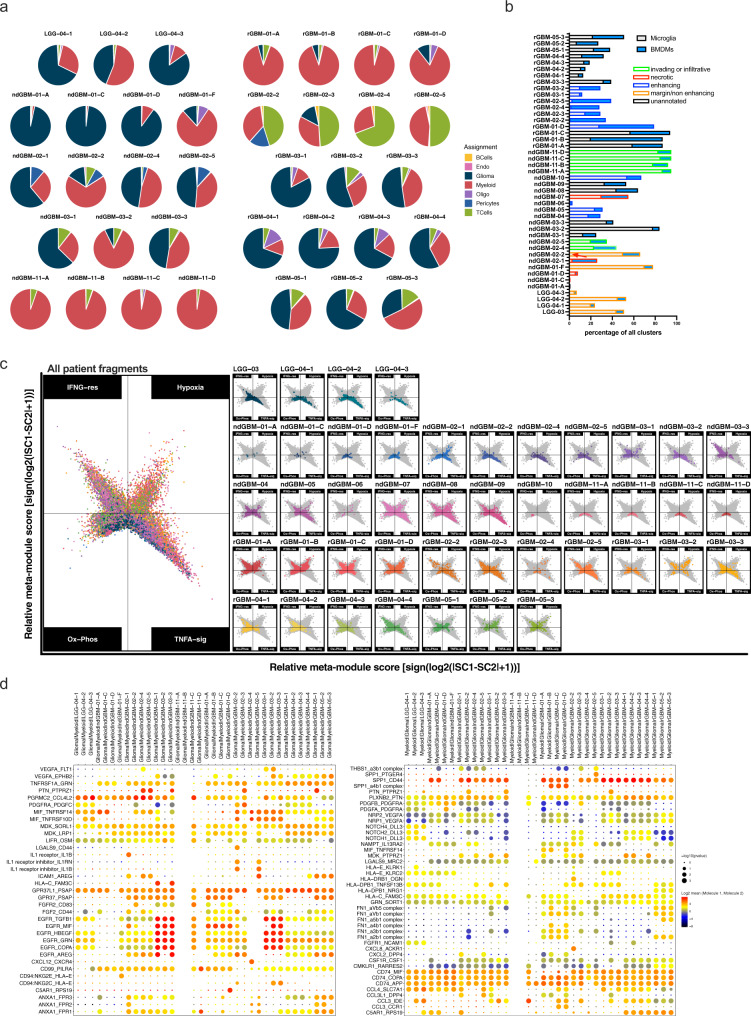
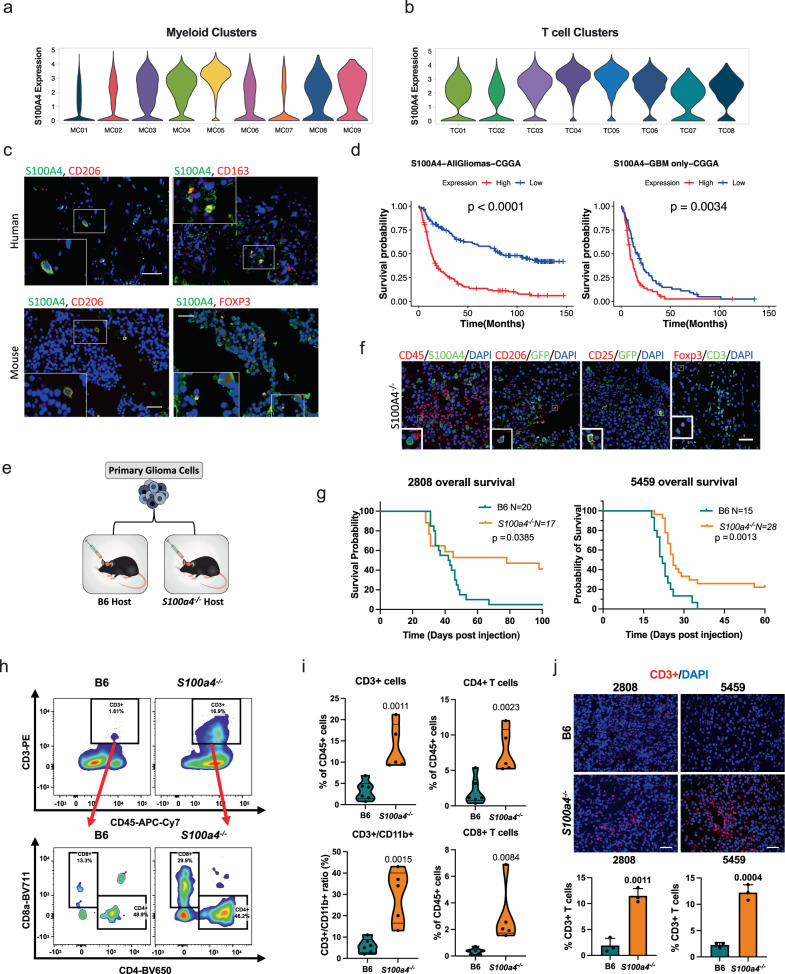
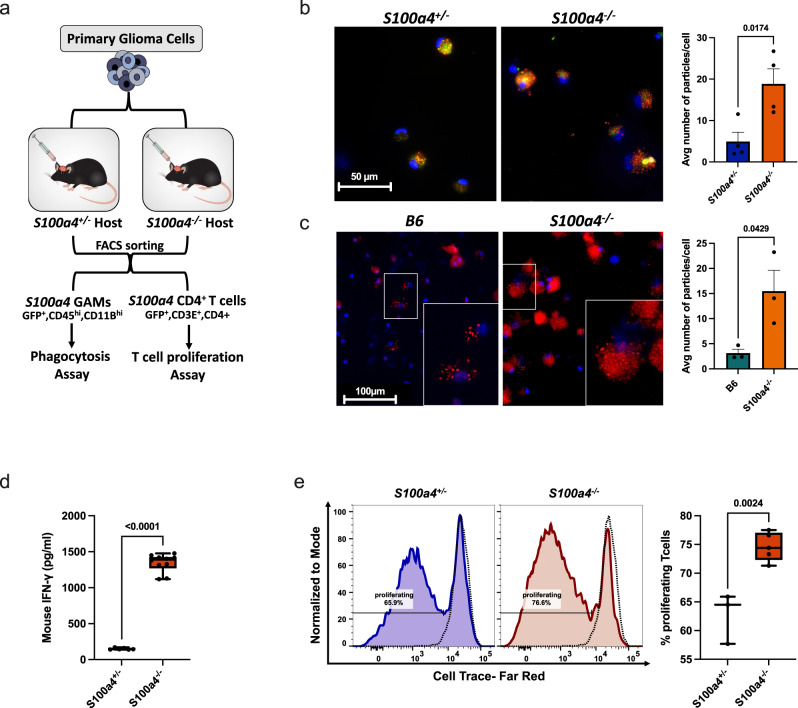
A major rate-limiting step in developing more effective immunotherapies for GBM is our inadequate understanding of the cellular complexity and the molecular heterogeneity of immune infiltrates in gliomas. Here, we report an integrated analysis of 201,986 human glioma, immune, and other stromal cells at the single cell level. In doing so, we discover extensive spatial and molecular heterogeneity in immune infiltrates. We identify molecular signatures for nine distinct myeloid cell subtypes, of which five are independent prognostic indicators of glioma patient survival. Furthermore, we identify S100A4 as a regulator of immune suppressive T and myeloid cells in GBM and demonstrate that deleting S100a4 in non-cancer cells is sufficient to reprogram the immune landscape and significantly improve survival. This study provides insights into spatial, molecular, and functional heterogeneity of glioma and glioma-associated immune cells and demonstrates the utility of this dataset for discovering therapeutic targets for this poorly immunogenic cancer.


Conflict of interest statement

K.Y. is a co-founder of EMPIRI, Inc. The remaining authors declare no competing interests.

Figures

Fig. 1
Fig. 1. Single-cell transcriptome analysis of human glioma and immune cells.
a A schematic summary of the study design. b UMAP projections of 201,986 aggregate single cells from 18 patients showing the composition of different cell types in human gliomas. UMAP projections are shown by cluster numbers, by the patient, by cluster assignment, and by diploid(normal)/aneuploid(malignant) status determined by CopyKat analysis (see Supplementary Fig. 2a). c Top 20 differentially expressed genes in clusters, ranked by FDR, are shown in the heatmap. Gene expression values were centered, scaled, and transformed to a scale from −2 to 2. Select signature genes are highlighted on the right. d Dot plot showing marker gene expression for different cell types (gliomas, brain stroma (pericytes and oligodendrocytes), and immune cells). Dot sizes indicate the percentage of cells in each cluster expressing the gene, and colors indicate average expression levels. e Fraction of cells (y-axis) from each patient sample (x-axis) color-coded for cluster IDs as in (b, c). The numbers of cells in each cluster from all patients are also indicated in the horizontal bar graph on the right. (Also see to Supplementary Data 2). f Pie charts representing the percentage of cells per assignment by tumor type, sex, and tumor grade color-coded for cell type assignment. Source data for e and f are provided as a Source Data file.
Fig. 2
Fig. 2. Molecular characteristics of glioma cells.
Glioma cells in clusters 2, 6, and 9 from Fig. 1b were extracted and analyzed through de novo clustering. a A heatmap showing the top 20 differentially expressed genes in the glioma nine clusters, ranked by FDR. Gene expression values were centered, scaled, and transformed to a scale from −2 to 2. b UMAP projections of glioma cells only, color-coded by cluster number, patient ID, tumor type, and grade. c Two-dimensional butterfly plot visualization of molecular subtype signature scores per Neftel et al. Each quadrant corresponds to one subtype (mesenchymal-like (Mes-like), neural-progenitor-like (NPC-like), astrocyte-like (AC-like) and oligodendrocyte-progenitor-like (OPC-like)), and the position of each cell reflects its relative signature scores. Colors represent different clusters. d A heatmap representation of GSEA Hallmark Pathway gene sets showing the highest and lowest two enriched pathways in each cluster, ranked by normalized enrichment scores (NES). Adjusted p-value cutoff=0.05. Genes were pre-ranked using the Wilcoxon rank-sum test and auROC. Color bar represents NES. e Two-dimensional butterfly plot visualization of the top Hallmark Pathways (EPITHELIAL_MESENCHYMAL_TRANSITION, MYC_TARGETS_V1, HYPOXIA, and INTERFERON_GAMMA_RESPONSE) in different clusters, representing signature scores as relative meta-module scores. Each quadrant corresponds to one Hallmark pathway; the exact position of each cell reflects its relative signature scores in all four pathways. Colors represent different clusters shown in (a). Details on signature score calculation and plot generation are in the Supplementary Methods. f Correlogram showing Pearson correlation coefficients (r) between the top differentially enriched pathways (from d) and glioma molecular subtypes (Neftel et al.). Asterisks represent statistically significant comparisons (p-value < 0.05). Scale bars represent Pearson correlation (r) (red = positive correlation, green = negative correlation).
Fig. 3
Fig. 3. Heterogeneity of glioma-associated T and NK cells.
18,483T and NK cells from cluster 3 in Fig. 1 were extracted and used for de novo clustering. a A heatmap showing the top 20 differentially expressed genes ranked by FDR in 8 clusters. Top genes are highlighted on the right. b UMAP projection showing de novo clustered T and NK cells. Cells are color-coded by identified clusters as in (a). Clusters are labeled with assigned cell types based on marker gene expression. c Dot plot showing the average expression of marker genes across all cells within each cluster. The size of the dot shows the percentage of cells expressing a particular gene while color shows the average gene expression levels (navy is low and yellow is high). d Pie charts representing the percentage of different cells types (by tumor type, patient sex, and tumor grade), color-coded for cell type assignment. e Pie charts representing the percentage of different cell types by the patient, color-coded for cell type assignment. f A violin plot showing low expression of PDCD1 in T cells by the patient. Source data for d and e are provided as a Source Data file.
Fig. 4
Fig. 4. Nine myeloid cell subtype signatures are predictive of patient survival.
Totally, 83,479 cells from clusters 1, 4, and 7 in Fig. 1b corresponding to myeloid cells were extracted and used for de novo clustering, identifying 9 myeloid clusters (MCs). a A UMAP projection of de novo clustered myeloid cells. Cells are color-coded by cluster numbers. Clusters are labeled with presumed activation states: i = inflammatory, a = activated, h = homeostatic, s = suppressive, AP = antigen presenting. b A dot plot showing the average expression of highlighted lineage marker genes across all myeloid clusters. c Fraction of cells from each cluster (x-axis) color-coded by patients. d A heatmap showing top and bottom two enriched GSEA Hallmark Pathways in each cluster (adj. p-value cutoff = 0.05). Genes were pre-ranked using the Wilcoxon rank-sum test and auROC. e Gene Ontology (GO) enrichment analysis with top differentially expressed genes (DEGs) among clusters. Plots show circular dendrograms of DEGs clustered by default Euclidean distance and average linkage. The inner ring displays logFC (blue is low, red is high). The outer ring represents assigned terms. Top terms were selected based on z scores and p-values for each cluster. f Two-dimensional butterfly plot visualizations of top Hallmark Pathways in different clusters (TNFA SIGNALING VIA NFKB, INTERFERON GAMMA RESPONSE, HYPOXIA, and OXIDATIVE PHOSPHORYLATION), representing signature scores as relative meta-module scores. Colors represent different clusters shown in (a). g, h Kaplan–Meier survival curves generated with each of MC signature genes using the Chinese Glioma Genome Atlas (CGGA) dataset. g All glioma patients (n = 325) or h GBM patients only (n = 139) were stratified by positive (Enriched) or negative (Not Enriched) signature scores for each MC. Zero cell score values were used as cutoffs for positive or negative designations. P-values on graphs from univariate log-rank Mantel–Cox test (exact p-value for (g) (all glioma) MC2 = 1.3e−12, MC3 = 4.3e−06, MC4 = 2.04e−14, MC5 = 2e−16, MC6 = 8.62e−07, MC7 = 5.51e−15, MC9 = 3.79e−05). Also see Supplementary Data 10 for multivariate Cox regression analysis p-values for: all gliomas (MC2 = 0.04, MC3 = 0.04, MC4 = 0.0007, MC5 = 0.0003, and MC7 = 0.002) and for GBM only (MC2 = 0.02, MC3 = 0.049, and MC07 = 0.03). Source data for c, g, and h are provided as Source Data files.
Fig. 5
Fig. 5. Presence of spatially heterogeneous glioma and immune cell types results in the unique cell:cell interactions in the local microenvironment.
Multi-regional samples from ten glioma patients were analyzed separately by fragment. a Pie charts representing the percentage of cells per assignment by patient fragment was color-coded for cell type assignment. b bar graph showing the percentage of microglia and BMDMs in different fragments. Patient fragments are highlighted with borders: red = necrotic, blue = enhancing, orange = margin or non-enhancing and green = invading or infiltrative. c Two-dimensional butterfly plot visualization of top Hallmark pathways in myeloid cells (TNFA SIGNALING VIA NFKB, INTERFERON GAMMA RESPONSE, HYPOXIA, and OXIDATIVE PHOSPHORYLATION) in different fragments, representing signature scores as relative meta-module scores. Colors represent different fragments. d Cell–cell communication analysis using CellphoneDB. Depicted are the dot plots of ligand-receptor pairs for Glioma-Myeloid (left) and Myeloid-Glioma (right) signaling across all glioma patients. Each dot size shows the −log10 p-value and color indicates the log2 mean of expression values for the listed LR pairs (y-axis) in the respective interacting cell types (x-axis, top). Dot colors represent log2 mean interaction. Only significant LR pairs, with cutoffs of p-value ≦ 0.05 and log2 mean expression value >2, are shown. The p-values were generated by CellphoneDB which uses a one-sided permutation-test to compute significant interactions. Source data for a and b are provided as a Source Data file.
Fig. 6
Fig. 6. S100A4 promotes immune suppression and glioma growth.
a, b Violin plots showing S100A4 expression levels in human glioma-associated myeloid cells (a) with high expression in immune-suppressive MCs (MC3–MC5) and glioma-associated TCs (b) with highest expression in TC04 and TC05, Treg and exhausted CD4 T cells. Violin plots are color-coded by corresponding myeloid and T cell clusters in Figs. 3 and 4). c Representative double immunofluorescence images showing co-expression of CD206, CD163, or FOXP3 (red) with S100A4 (green) in human GBMs (top) and mouse glioma (bottom). n = 6 patients, n = 3 B6 mice. Scale bar: 50 µm. d Kaplan–Meyer survival curve with differential S100A4 expression levels in all glioma patients (left: n = 325, 163 high and 162 low) and GBM patients only (right: n = 139, 67 high and 72 low) from the CGGA dataset, stratified by median S100A4 expression level. P-values from Log-rank Mantel–Cox test. e Functional validation experimental design: mouse primary glioma tumorspheres isolated from spontaneous S100ß-vErbB;p53 glioma models (5459 or 2808) were intracranially injected into sex- and age-matched B6 or S100a4−/ host mice. f Representative doubles IF images showing co-expression of CD45, CD25, or CD206 with S100A4/GFP in mouse tumors from S100a4−/ hosts. n = 3 each. Scale bar: 50 µm. g Kaplan–Meier survival curves showing significant survival extension of S100a4−/− host mice, compared to B6 hosts, intracranially injected with the same primary glioma tumorsphere cells: 5459 (B6 n = 15, S100a4−/− n = 28) or 2808 (B6 n = 20, S100a4−/− n = 17). P-values from Log-rank Mantel–Cox test. h Representative dot plots from flow cytometry analysis of tumor-infiltrating T-cells in B6 vs. S100a4−/− host mice. i Flow cytometry analysis n = 6 (B6) and n = 5 (S100a4−/−) mice. All pairwise analyses were performed using two-tailed t-tests. j Representative Immunofluorescence images of CD3+ T cells in B6 control and S100a4−/− host gliomas. CD3+ (red) and DAPI (all nuclei in blue) were counted from three fields/sample and three samples/type. Error bars represent SD. P-values represent two-tailed t-tests. Scale bar: 100 µm. Source data for d, g, i, and j are provided as a Source Data file.
Fig. 7
Fig. 7. S100a4 deletion enhances phagocytosis in myeloid cells and increases T cell activation.
a A schematic summary of experimental design. S100a4 expressing GAMs (CD45hiCD11bhi) and CD4+ TILs (CD45+CD3+CD4+) were FACS sorted by GFP expression, and used in in vitro functional assays. b Fluorescence images showing phagocytosis of pHrodo labeled (red) nanoparticles in FACS-sorted GFP+CD45hiCD11bhi GAMs from S100a4 heterozygous or homozygous hosts. An average number of particles/cell were calculated (n = 4 tumors each). P-value from two-tailed student t test. Error bars represent SEM. Scale bar: 50 µm. c Fluorescence images showing phagocytosis of pHrodo™ labeled (red) nanoparticles in FACS sorted CD45hi CD11bhi tumor-infiltrating GAMs from B6 or S100a4−/− hosts. An average number of particles/cell were calculated (n = 3 tumors each). P-value from two-tailed student t test. Error bars represent SEM. Scale bar: 100 µm. d Box and whiskers plot showing IFN-γ levels measured by ELISA in FACS-sorted GFP+ CD45+CD3+CD4+ tumor-infiltrating T cells from S100a4 heterozygous or homozygous hosts. P-value represents two-tailed student’s t test (exact p-value = 1.8124E−12). Whiskers represent minimum and maximum values, the line inside the box represents the mean and the box extends from the 25th to 75th percentiles. n = 3 (heterozygous) and n = 5 (homozygous) gliomas, two experimental replicates from each tumor. e T cell proliferation assay using dye dilution. T cells were isolated from B6 spleens, labeled, and stimulated with CD3/Cd28 dynabeads then cocultured with FACS sorted GFP+CD45+CD3+CD4+ tumor-infiltrating T cells for 4-days. Dotted lines represent unstimulated T cells. P-value from two-tailed student t test. Whiskers represent minimum and maximum values, the line inside the box represents the mean and the box extends from the 25th to 75th percentiles. n = 3 (heterozygous) and n = 5 (homozygous) gliomas. Source data for be are provided as a Source Data file.

References

    1. Wen PY, et al. Glioblastoma in adults: a Society for Neuro-Oncology (SNO) and European Society of Neuro-Oncology (EANO) consensus review on current management and future directions. Neuro Oncol. 2020;22:1073–1113. - PMC - PubMed
    1. Stupp R, et al. Maintenance therapy with tumor-treating fields plus temozolomide vs temozolomide alone for glioblastoma: a randomized clinical trial. J. Am. Med. Assoc. 2015;314:2535–2543. - PubMed
    1. Kruger S, et al. Advances in cancer immunotherapy 2019—latest trends. J. Exp. Clin. Cancer Res. 2019;38:268. - PMC - PubMed
    1. Wolchok JD, et al. Nivolumab plus ipilimumab in advanced melanoma. N. Engl. J. Med. 2013;369:122–133. - PMC - PubMed
    1. Burki TK. Pembrolizumab for patients with advanced melanoma. Lancet Oncol. 2015;16:e264. - PubMed

Publication types

Substances