. 2022 Feb 9;13(1):762.
doi: 10.1038/s41467-022-28454-x.

Translocated Legionella pneumophila small RNAs mimic eukaryotic microRNAs targeting the host immune response

Affiliations

Translocated Legionella pneumophila small RNAs mimic eukaryotic microRNAs targeting the host immune response

Tobias Sahr et al. Nat Commun. .

Abstract

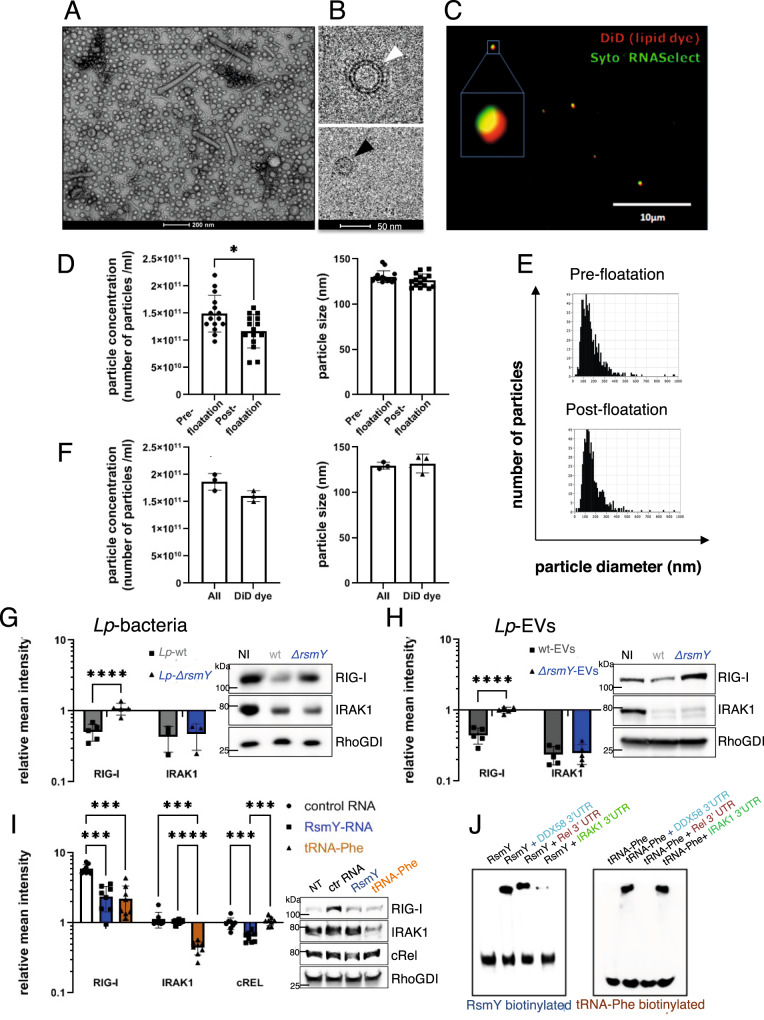
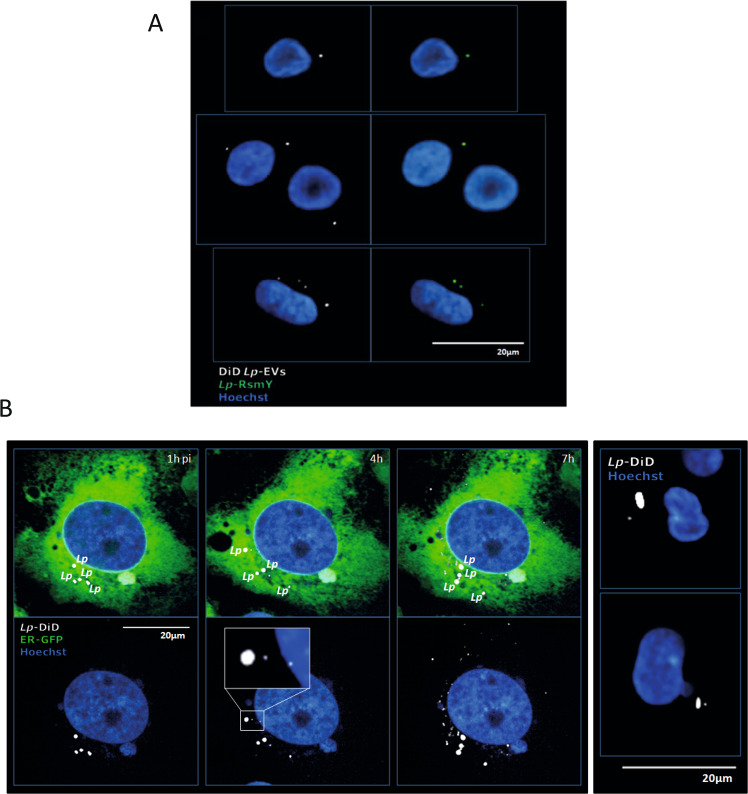
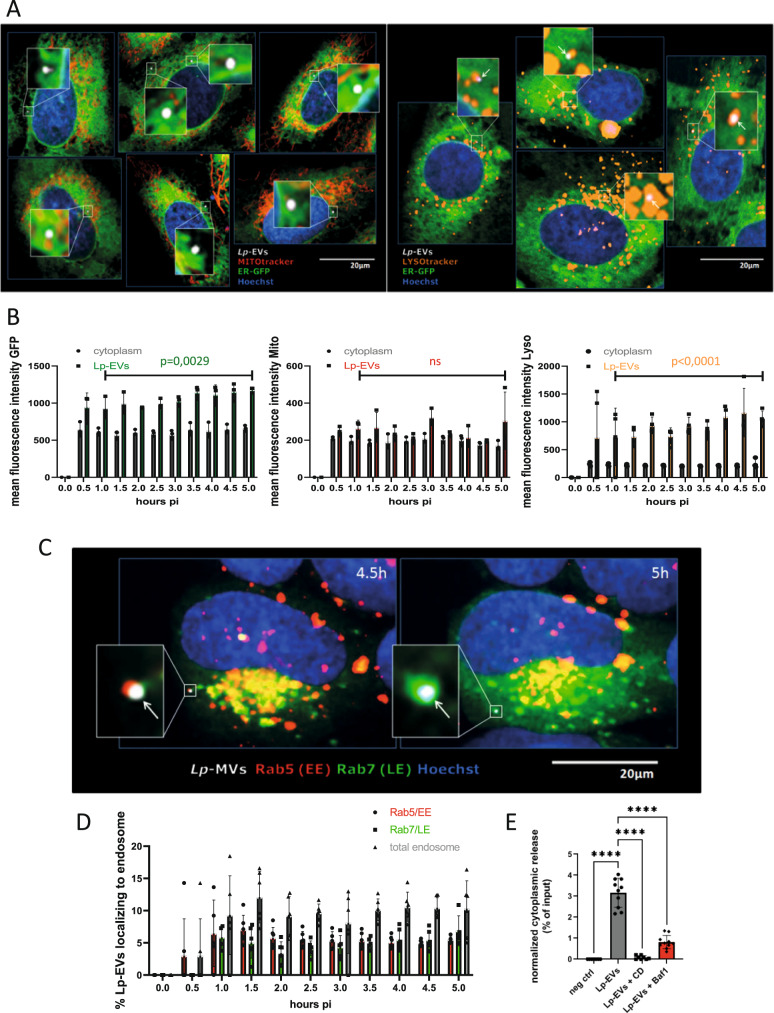
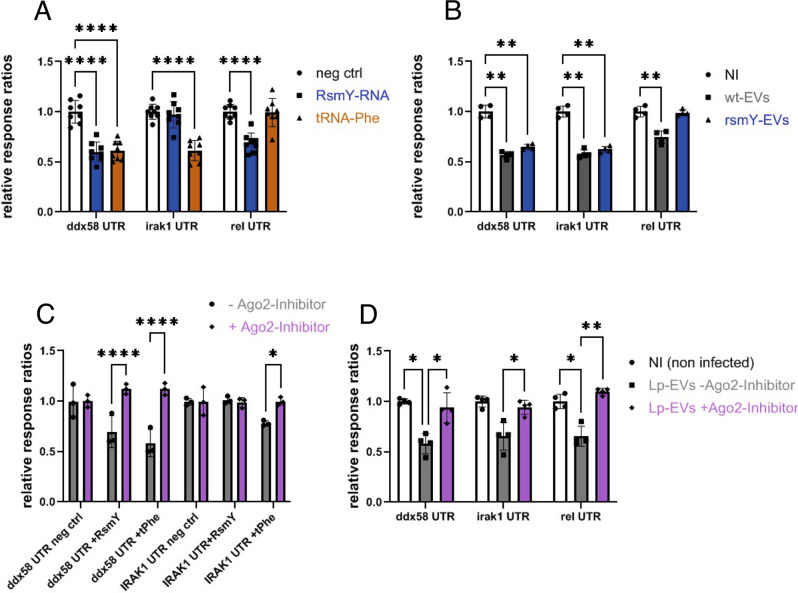
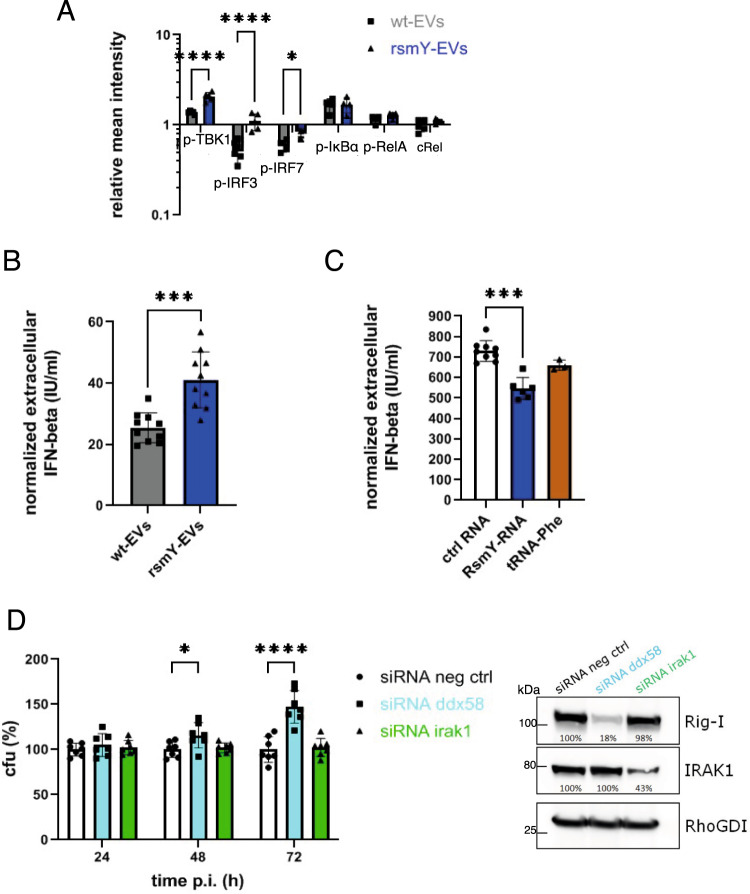
Legionella pneumophila is an intracellular bacterial pathogen that can cause a severe form of pneumonia in humans, a phenotype evolved through interactions with aquatic protozoa in the environment. Here, we show that L. pneumophila uses extracellular vesicles to translocate bacterial small RNAs (sRNAs) into host cells that act on host defence signalling pathways. The bacterial sRNA RsmY binds to the UTR of ddx58 (RIG-I encoding gene) and cRel, while tRNA-Phe binds ddx58 and irak1 collectively reducing expression of RIG-I, IRAK1 and cRel, with subsequent downregulation of IFN-β. Thus, RsmY and tRNA-Phe are bacterial trans-kingdom regulatory RNAs downregulating selected sensor and regulator proteins of the host cell innate immune response. This miRNA-like regulation of the expression of key sensors and regulators of immunity is a feature of L. pneumophila host-pathogen communication and likely represents a general mechanism employed by bacteria that interact with eukaryotic hosts.


Conflict of interest statement

The authors declare no competing interests.

Figures

Fig. 1
Fig. 1. Lp-EVs are a population of single and double membrane vesicles that contain small RNAs modulating RIG-I and IRAK protein levels.
A Negative staining transmission electron microscopy of Lp-EVs (n = 1). B Cryogenic transmission electron microscopy (n = 1), unilamellar EVs (black arrow), two lipid bilayer EVs (white arrow). C Fluorescence microscopy, DiD (red) and Syto-RNAselect (green) labelled Lp-EVs, (n = 5). D Absolute particle concentration (left) and median size (right) of purified Lp-EVs determined by ZetaView. Each dot represents a single measurement performed in triplicates and the (mean) SD of n = 5. Statistical analysis performed using unpaired t-test (two-tailed, p < 0.05 significant). Red Square, representative size distribution of particles for each sample. *p = 0.0112 (Wilcoxon). ns: p > 0.05 (Wilcoxon). Source data provided as Source data file. E Size distribution pre- and post-floatation was unchanged. F Absolute particle concentration (left) and median size (right) measured through light scatter (All) and fluorescence (DiD) mode. Each dot is one measurement and the (mean) SD of n = 3, ns: p > 0.05 (Wilcoxon). Source data provided as Source data file. G THP-1 cells infected for 8 h with L. pneumophila wt or ∆rsmY. Data are presented as (mean) SD of n ≥ 3 independent, biological replicates (p < 0.0001) H) THP-1 incubated 3 h with wt or ∆rsmY Lp-EVs. Data are presented as (mean) SD of n = 5 independent biological replicates. (p < 0.0001). (G + H) Protein quantities of RIG-I and IRAK analyzed by western blot, intensities relative to the non-infected control (NI) and RhoGDI loading control. A two-way ANOVA for statistical analysis was performed. Right, representative western blots. Source data provided as Source data file. I Quantification of RIG-I, IRAK1 and cRel protein levels after transfection of THP-1 with RsmY and tRNA-Phe. Relative mean intensities normalized to non-transfected cells (NT) and RhoGDI loading control. Control RNA (ctrlRNA) average of random L. pneumophila DNA, anti-sense of RsmY or tRNA-Phe. Left, representative blot. Data are presented as (mean) SD of n = 8 independent biological replicates. For statistical analysis a two-way ANOVA was performed with p < 0.05 significant (*), p < 0.01 very significant (**), p < 0.001 extremely significant (***). Source data provided as Source data file. J Representative EMSA (n = 3) of in vitro transcribed RNA.
Fig. 2
Fig. 2. Lp-EVs are shed during infection and contain RsmY.
A Representative images of three independent experiments from FISH analyses using probes specific for RsmY. hMDM cells incubated with purified DiD-labelled Lp-EVs. Internalized, DiD-labelled Lp-EVs (white) 5 h post-infection. Blue, nucleus fluorescently stained using Hoechst 33342. B Human bone osteosarcoma epithelial cells stably expressing Sec61β-GFP for ER labelling (U2OS- Secβ61β cells; first three panels) and human monocyte-derived macrophages (hMDM) (right panel) were infected with DiD-labelled L. pneumophila grown until post-exponential phase (OD4.2). Images of living infected U2OS- Secβ61β cells after 1, 4, and 7 h of infection at 37 °C (5% CO2) taken with an automated confocal microscope (Opera) are shown. Upper panel shows the cells with the green florescence labelling of the ER, lower panel shows the same cells without the green channel. Representative images of three independent experiments. White: DiD-labelled L. pneumophila and DiD-labelled Lp-EVs shed during infection; Green: ER; Blue: Nucleus (Hoechst 33342). Right panel shows fixed hMDM cells, 5 h post-infection, analyzed by confocal microscopy. White: L. pneumophila and Lp-EVs; Blue: Nucleus (Hoechst 33342).
Fig. 3
Fig. 3. Internalized Lp-EVs follow the endosomal pathway.
A U2OS-Sec61β cells incubated with DiD-labelled Lp-EVs. Live cell image shows co-localization of Lp-EVs with ER and mitochondria (left and magnifications) and with acidic organelles (right and magnifications). Representative images of n = 3. White: DiD-labelled Lp-EVs; Green: ER; Blue: Nucleus; Red: Mitochondria; Orange: acidic organelles. B Quantification of co-localization events over time. Live cell image acquisition of multiple fields per well of infected U2OS-Sec61β cells was performed on an automated confocal microscope and the mean fluorescence intensity (MFI) of GFP, Mitotracker and Lysotracker, and Lp-EVs was analyzed, suggesting that they co-localize with ER and lysosomes. Data are presented as (mean) SD with each dot representing the mean of up to 600 independently analyzed cells. For statistical analysis an unpaired t-test was performed (two-tailed; p < 0.05 significant). Source data provided as Source data file. C U2OS cells labelled with Rab5 and Rab7 CellLight incubated with DiD-labelled Lp-EVs. Co-localization of Lp-EVs with Rab5+ early endosomes (EE) 4.5 h post-infection and with Rab7+ late endosomes (LE) 5 h post-infection. Live cell image acquisition of multiple fields per well of infected U2OS cells was performed over the time at 37 °C (5% CO2) on an automated confocal microscope. Representative images of five independent experiments. White: DiD-labelled Lp-EVs; Blue: Nucleus; Red: Rab5; Green: Rab7. D Quantification of Lp-EVs co-localizing with EE and LE were determined during 5 h of infection. Data are presented as (mean) SD with each dot representing the mean of around 500 independently analyzed cells. Source data provided as Source data file. E Quantification of purified HiBiT-GroEL EV content delivery within LgBiT-THP-1 acceptor cells, +/− Bafilomycin A1 (BA1) or Cytochalasin D (CD) treatment. Negative control, LgBiT-THP-1 cells incubated with purified Lp-EVs (no HiBiT). The luminescence in the negative control was defined as 0%. Bafilomycin A1 (loss of endosomal acidification) and Cytochalasin D (inhibition of actin polymerization) significantly reduces the content delivery into the host cell. Error bars represent the (mean) SD of at least n = 8 biological repeats. For statistical analysis, a two-way ANOVA analysis was performed with p < 0.0001 (****). Source data provided as Source data file.
Fig. 4
Fig. 4. RsmY base pairs with the UTR of RIG-I and RsmY activity is modulated by Ago2 inhibition.
A Dual luciferase reporter assay showing luciferase activities of THP-1 cells transfected with random short Lp-RNA (ctrlRNA), RsmY, or tRNA-Phe. Results are shown as relative luciferase activity (ratio Firefly/Renilla activity), where luciferase activity of ctrlRNA is defined as 100%. Bars indicate the (mean) SD of eight independent experiments. For statistical analysis, a two-way ANOVA was performed with p < 0.0001 (****). Source data provided as Source data file. B Dual luciferase reporter assay showing luciferase activities of THP-1 cells in absence (NI) or presence of wt or a ∆rsmY Lp-EVs. Lp-EVs affect protein expression depending on the presence of the un-translated regions (UTR) of ddx58 (RIG-I), irak1, or rel (cRel). Results are shown as relative luciferase activity (ratio Firefly/Renilla activity), luciferase activity of THP-1 cells (NI) was defined as 100%. Bars show the (mean) SD of n = 7 independent experiments. Statistical analysis, a two-way ANOVA with p < 0.05 significant (*), p < 0.01 very significant (**) and p < 0.001 extremely significant (***) was performed. Source data provided as Source data file. C Relative luciferase activities of THP-1 cells transfected with RsmY or tRNA-Phe. RsmY and tRNA-Phe affect protein expression significantly less in presence of an Ago2-Inhibitor. The bars indicate the (mean) SD of three independent experiments. Statistical analysis, a two-way ANOVA analysis was performed with p < 0.0001 (****). Source data provided as Source data file. D Dual luciferase reporter assay showing the relative luciferase activities (ratio Firefly/Renilla activity) of THP-1 cells incubated with Lp-EVs+/− Ago2-Inhibitor. When inhibiting Ago2, the suppressing effect of Lp-EVs on relative luciferase activity depending on the presence of the un-translated regions (UTR) of ddx58 (RIG-I), irak1 or rel (cRel) is significantly reduced. The bars show the (mean) SD of n = 4 independent experiments. Statistical analysis, a two-way ANOVA with values of p < 0.05 significant (*), p < 0.01 very significant (**) and p < 0.001 extremely significant (***) and p < 0.0001 (****) was performed. Source data provided as Source data file.
Fig. 5
Fig. 5. RsmY transfection impacts RIG-I expression or when contained in Lp-EVs and decreases IFN-ß.
A Quantitative analyses of the protein and phosphorylation levels of key proteins of the RLR and TLR signalling pathway analyzed after 3 h of-incubation of THP-1 cells with wt or the ΔrsmY Lp-EVs. wt (grey), ∆rsmY (blue). Mean intensities of the proteins, normalized against the value of non-infected cells and the RhoGDI loading control. Bars show the (mean) SD of n = 4 independent experiments. For statistical analysis, a two-way ANOVA with values of p < 0.05 significant (*), p < 0.01 (**), p < 0.001 (***) and p < 0.0001 (****) was performed. Source data provided as Source data file. B Extracellular IFN-β concentration of THP-1 cells incubated for 3 h with wt or ΔrsmY Lp-EVs. The bars indicate the (mean) SD of n = 10 independent experiments using an unpaired t-test for statistical analysis with two-tailed values of of p < 0.05 significant (p = 0.0002). C THP-1 cells were transfected with in vitro transcribed RsmY, tRNA-Phe RNA, or non-specific control RNA (ctrlRNA). The value for the ctrlRNA comprises the results of two control RNAs, a random short L. pneumophila DNA and the anti-sense sequences of RsmY (as-RsmY). Bars show the (mean) SD of n = 3 independent experiments using an unpaired t-test for statistical analysis (two-tailed), p < 0.05 significant (p = 0.0007). In B and C the IFN-ß concentration of the supernatant was quantified and normalized against the values of the corresponding non-infected/non-transfected experiments. D THP-1 cells were transfected with siRNA targeting Rig-I (ddx58), IRAK1 (irak1), or a scramble control (neg ctrl). The protein expressions of RIG-I and IRAK1 were analyzed at time point T0, before infection with L. pneumophila. The graph shows the percentage of colony forming units (% cfu) at 24, 48, and 72 h post-infection relative to the scramble siRNA (neg ctrl). Bars show the (mean) SD of at least n = 7 independent experiments. For statistical analysis, a two-way ANOVA with values of p < 0.05 significant (*), p < 0.01 very significant (**), p < 0.001 extremely significant (***) and p < 0.0001 (****) was performed. Source data provided as Source data file.

References

    1. Christie PJ. The rich tapestry of bacterial protein translocation systems. Protein J. 2019;38:389–408. - PMC - PubMed
    1. Mondino S, et al. Legionnaires’ disease: State of the art knowledge of pathogenesis mechanisms of Legionella. Annu. Rev. Pathol. 2020;15:439–466. - PubMed
    1. Isberg RR, O’Connor TJ, Heidtman M. The Legionella pneumophila replication vacuole: Making a cosy niche inside host cells. Nat. Rev. Microbiol. 2009;7:13–24. - PMC - PubMed
    1. Escoll P, Rolando M, Gomez-Valero L, Buchrieser C. From amoeba to macrophages: Exploring the molecular mechanisms of Legionella pneumophila Infection in both hosts. Curr. Top. Microbiol. Immunol. 2013;376:1–34. - PubMed
    1. Cazalet C, et al. Evidence in the Legionella pneumophila genome for exploitation of host cell functions and high genome plasticity. Nat. Genet. 2004;36:1165–1173. - PubMed

Publication types