. 2022 Feb 9;13(1):759.
doi: 10.1038/s41467-022-28407-4.

The induction of peripheral trained immunity in the pancreas incites anti-tumor activity to control pancreatic cancer progression

Affiliations

The induction of peripheral trained immunity in the pancreas incites anti-tumor activity to control pancreatic cancer progression

Anne E Geller et al. Nat Commun. .

Abstract

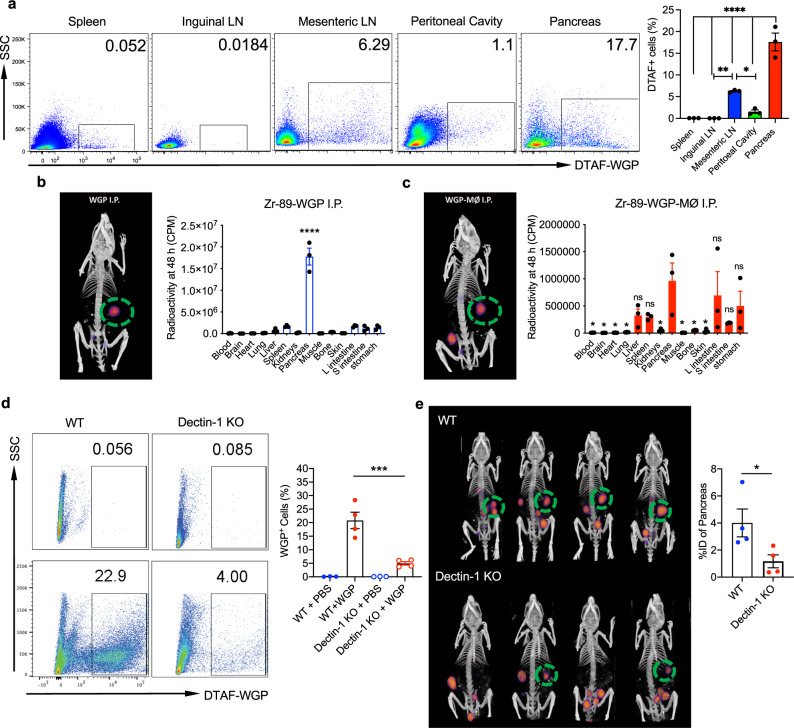
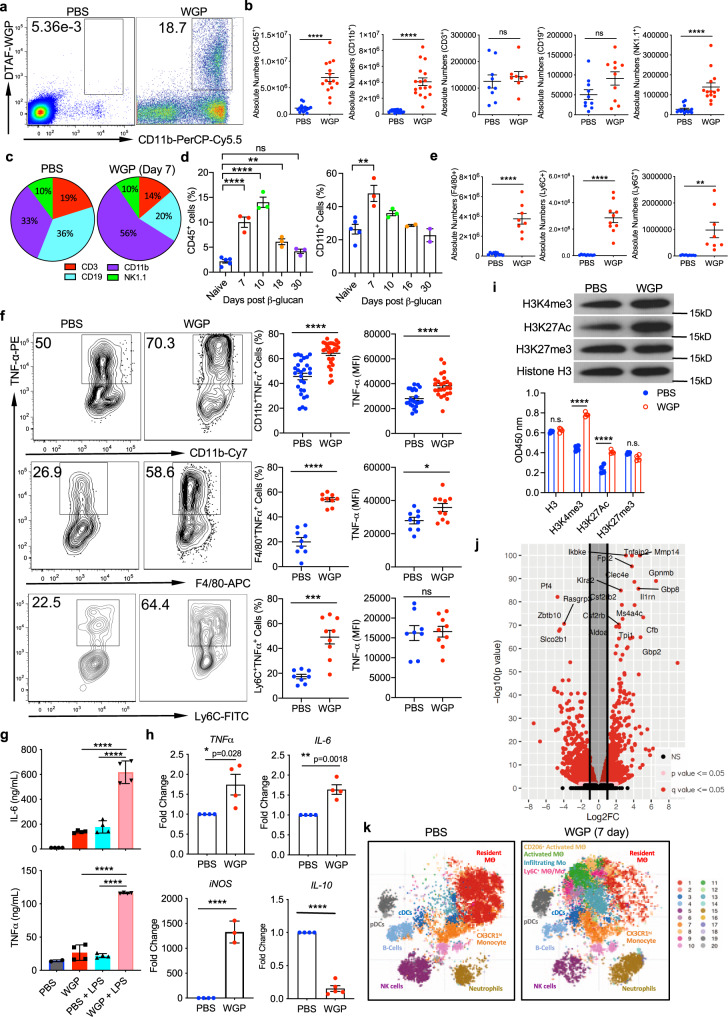
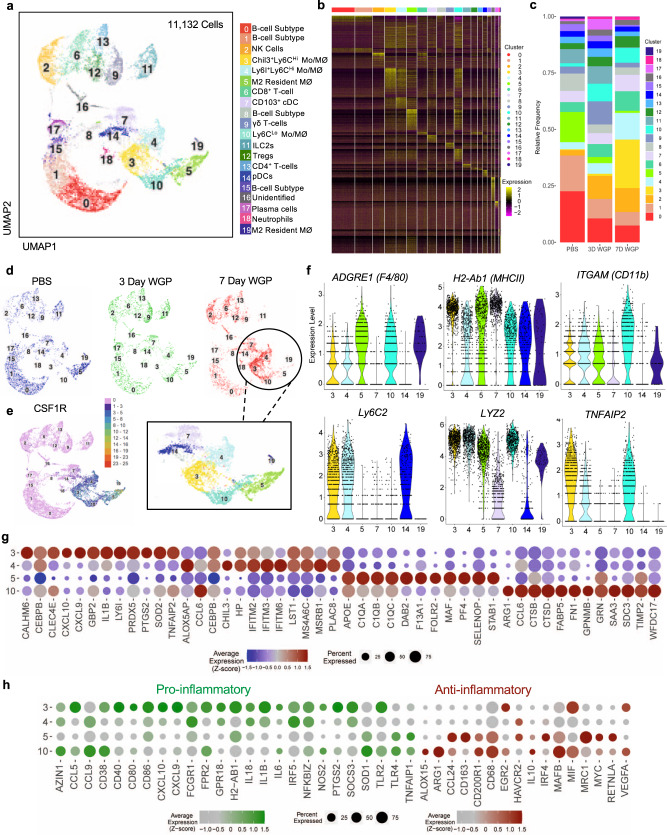
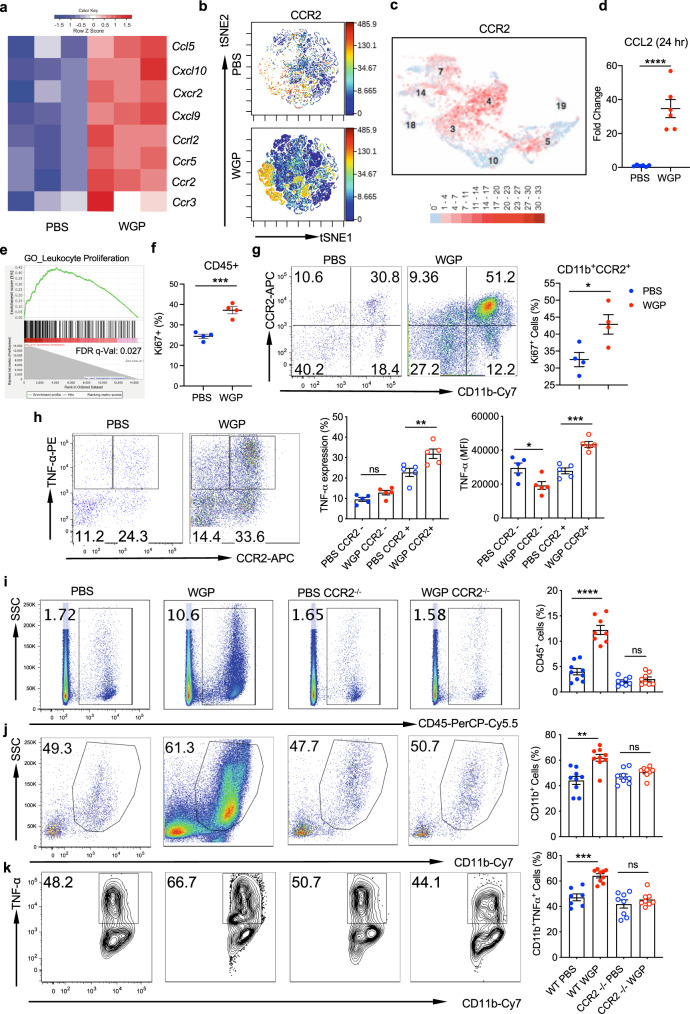
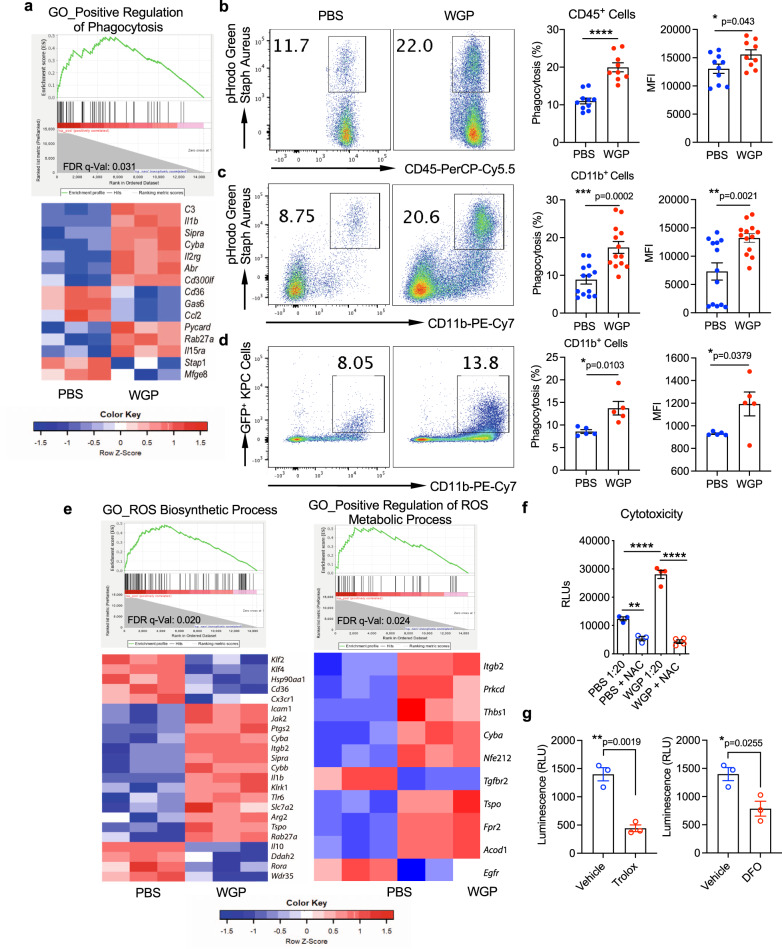
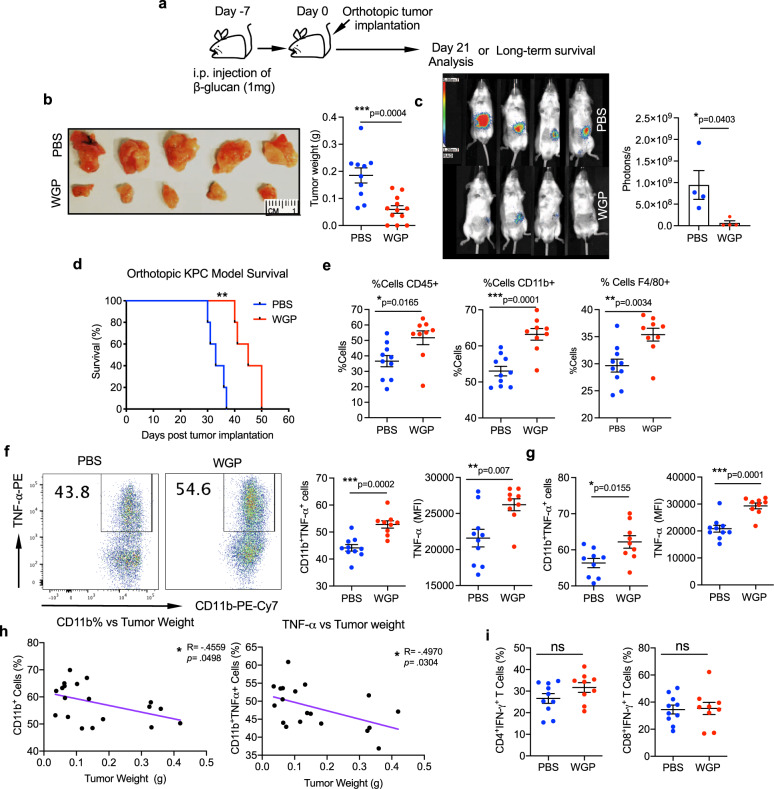
Despite the remarkable success of immunotherapy in many types of cancer, pancreatic ductal adenocarcinoma has yet to benefit. Innate immune cells are critical to anti-tumor immunosurveillance and recent studies have revealed that these populations possess a form of memory, termed trained innate immunity, which occurs through transcriptomic, epigenetic, and metabolic reprograming. Here we demonstrate that yeast-derived particulate β-glucan, an inducer of trained immunity, traffics to the pancreas, which causes a CCR2-dependent influx of monocytes/macrophages to the pancreas that display features of trained immunity. These cells can be activated upon exposure to tumor cells and tumor-derived factors, and show enhanced cytotoxicity against pancreatic tumor cells. In orthotopic models of pancreatic ductal adenocarcinoma, β-glucan treated mice show significantly reduced tumor burden and prolonged survival, which is further enhanced when combined with immunotherapy. These findings characterize the dynamic mechanisms and localization of peripheral trained immunity and identify an application of trained immunity to cancer.


Conflict of interest statement

The authors declare no competing interests.

Figures

Fig. 1
Fig. 1. Particulate β-glucan traffics to the pancreas in a dectin-1 dependent manner.
a DTAF-WGP was injected I.P. and 3 days later different tissues (n = 3) were harvested and assessed for the presence of the DTAF-WGP by flow cytometry. Representative dot plots and summarized data are shown. *p = 0.032, **p = 0.0057, ****p < 0.0001. b WGP was labeled with 89Zr-WGP or c peritoneal macrophages were incubated with 89Zr-WGP and washed, followed by I.P. injection. PET/CT imaging displays the trafficking of the 89Zr-WGP after 48 h. Organs were individually assessed for radioactivity following a necroscopy using a gamma counter. In c, significance is reported as compared to the pancreas (n = 3). ****p < 0.0001. d Dectin-1−/− mice or WT mice were injected with DTAF-WGP and the accumulation of DTAF-WGP in the pancreas was assessed by flow cytometry (WT PBS n = 3, WT WGP n = 4, KO + PBS n = 3, KO + WGP n = 4). e Dectin-1−/− mice or WT mice (n = 4) were injected with 89Zr-WGP and 48 h later a PET/CT was used to assess the amount in the pancreas. The signal was quantified by reporting the % of injected dose (%ID) in the pancreas. *p = 0.046. A one-way ANOVA with Tukey’s multiple comparisons was used in ad, and an unpaired, two-tailed student’s t-test was used in e. Data were represented as mean ± SEM. ns not significant; Each sample represents a biologically independent animal obtained over a single independent experiment which was repeated at least twice for verification of results.
Fig. 2
Fig. 2. β-glucan stimulates an influx of trained myeloid cells into the pancreas.
a Percent of CD45+CD11b+DTAF+ cells in the pancreas 3 days after WT mice received I.P. DTAF-WGP. b Seven days after PBS or WGP injection, absolute numbers of CD45+ (n = 15), CD11b+ (n = 18), CD3+ (n = 8), CD19+ (n = 10), and NK1.1+ (n = 14) cells are shown. ****p < 0.0001. c Pie charts representing frequency changes of major immune cell populations after WGP treatment. d WT mice were injected with PBS (n = 5) or WGP (n = 5) and the percent of CD45+ and CD45+CD11b+ cells were measured 7, 10, 18, and 30 days later (n = 3). **p = 0.0034, ****p < 0.0001 (CD45), **p = 0.0023 (CD11b). e Absolute numbers of F4/80+ (n = 10), Ly6C+ (n = 10), and Ly6G+ (n = 8) within the CD11b+ population. **p = 0.003, ****p < 0.0001. f Seven days after IP PBS or WGP the pancreas was restimulated with LPS. TNFα production in CD11b+ (n = 28), CD11b+F4/80+ (n = 9), and CD11b+Ly6C+ (n = 8) cells was measured. *p = 0.024, ***p = 0.0001, ****p < 0.0001. g Seven days after PBS or WGP, the CD45+CD11b+ population was enriched (n = 4). Cells were restimulated with or without LPS for 24 h. TNFα and IL-6 production was measured using ELISA. ****p < 0.0001. h Pancreatic CD11b+ cells from PBS and WGP-trained mice were sorted. RT-qPCR was done to quantify TNFα (n = 4), IL-6 (n = 4), iNOS (PBS n = 4, WGP n = 3), and IL-10 (PBS n = 4, WGP n = 5) mRNA expression levels. *p = 0.028, **p = 0.0018, ****p < 0.0001. i CD11b+ cells from PBS or WGP-injected mice (24 h) were sorted (n = 4). Histones were isolated and subjected to western blot analysis (top) or ELISA (bottom) for H3K4me3, H3K27Ac, H3K27me3, and total H3. ****p < 0.0001. j Seven days after IP WGP or PBS, pancreatic CD45+CD1b+ populations were sorted. RNA-Seq analysis was performed (PBS n = 3, WGP n = 3). The distribution of p values (–log10(p value)) and fold changes (log2 FC) of differentially expressed genes are represented. k t-SNE plots of the CD11b+ population in mice trained with PBS or WGP 7 days prior and analyzed with CyTOF (PBS n = 3, WGP n = 3). Unpaired, two-tailed student’s t-tests were used in b, e, f, and h. A one-way ANOVA with multiple comparisons was used in d, g, and i. Data represented as mean ± SEM. ns not significant. Each sample represents a biologically independent animal obtained over a single independent experiment.
Fig. 3
Fig. 3. Single-cell RNA-seq showing the immune cell phenotype 3 and 7 days following IP WGP.
CD45+ cells from the pancreas of mice treated with PBS or WGP 7 days and 3 days prior were sorted and scRNA-Seq was performed. a Two-dimensional UMAP representation of 11,132 cells aggregated from the three experimental samples with 20 unique clusters resulting from k-nearest neighbors and Louvain algorithms. b Heatmap of expression of aggregated marker genes for all clusters. c Bar graphs showing the relative frequency of cells in each cluster across samples. d UMAP dimension reduction of PBS (blue), 3-day WGP (green), and 7-day WGP (red) samples shown individually. The portion of the UMAP representing myeloid cells is highlighted. e Single-cell gene expression of CSF1R. f Single-cell expression distributions across clusters identified as myeloid cells for select genes related to myeloid phenotyping. g Dot plot of the top 12 enriched genes in clusters 3, 4, 5, and 10 showing the average expression level and percentage of cells expressing select genes. h Dot plots showing the enrichment of selected genes associated with pro-inflammatory (green) and anti-inflammatory (red) immune responses across clusters 3, 4, 5, and 10. In g and h, the average expression level is displayed as z-scores computed across the four clusters for individual genes.
Fig. 4
Fig. 4. CCR2 is required for immune cell trafficking into the pancreas.
a Heatmap of chemokines and cytokines that were upregulated in 7-day WGP-treated CD11b+ cells based on RNA-Seq data. b viSNE plot of the CD11b+ pancreatic population in PBS and 7-day WGP-trained mice, highlighting the expression of CCR2. Images made with CyTOF data. c scRNA-Seq data showing a UMAP of the myeloid clusters expressing CCR2. d CCL2 expression in whole pancreatic lysates 24 h following WGP treatment a measured by RT-PCR (n = 6). ****p = 0.0001. e GSEA generated enrichment plots of genes related to leukocyte proliferation in CD11b+ pancreatic cells from 7-day WGP-trained as compared to PBS mice. PBS was used as the control and compared to WGP. f Summarized data of the percent of CD45+ pancreatic cells that are Ki67+ in PBS and 7-day WGP-trained mice (n = 4). ***p = 0.0007. g Cells were first gated on the CD45 + Ki67+ population. Plots show the percent of the CD45+Ki67+ proliferating pancreatic cells that are CD11b+CCR2+ in PBS and 7-day WGP-trained mice (n = 4). *p = 0.0261. h Pancreatic cells from PBS and 7-day WGP-trained mice (n = 5) were restimulated with LPS and the percent of CCR2 positive and negative cells producing TNFα was measured in each condition. Cells were first gated on the CD45+CD11b+ subset. Representative dot plots and summarized data were shown. *p = 0.022, **p = 0.0073, ***p = 0.0007. ik WT and CCR2−/− mice were treated with PBS or WGP and the percent of i CD45+ cells in the pancreas (****p < 0.0001) and j the percent of CD45+ cells that were CD11b+ was assessed. **p = 0.0013. k The percent of CD45+CD11b+ cells producing TNFα. Representative flow plots and summarized data are shown. Each dot represents data from one mouse. ***p = 0.0002. (ik: WT PBS n = 9, WT WGP n = 9, CCR2−/− PBS n = 8, CCR2−/− WGP n = 8). An unpaired, two-tailed student’s t-test was used in d, f, and g, while a one-way ANOVA with multiple comparisons was used in hk. Data were represented as mean ± SEM. ns not significant. In fk, each sample represents a biologically independent animal obtained over a single independent experiment which was repeated at least twice for verification of results.
Fig. 5
Fig. 5. WGP-trained pancreatic infiltrating myeloid cells show enhanced phagocytosis and ROS-mediated cytotoxicity.
a Enrichment plots (GSEA) and heatmap of genes related to the positive regulation of phagocytosis in CD11b+ cells from 7-day WGP-trained as compared to PBS mice. b The percent of CD45+ pancreatic cells that phagocytosed a pHrodo Green Staph Aureus particle in PBS (n = 10) and 7-day WGP (n = 9) mice along with the MFI of the pHrodo Green Staph Aureus particle. Each dot represents data from one mouse. *p = 0.043, ****p < 0.0001. c The percent of CD11b + myeloid pancreatic cells that phagocytosed a pHrodo Green Staph Aureus particle in PBS (n = 13) and 7-day WGP (n = 13) mice. Cells were first gated on the CD45+ population. The MFI of the pHrodo Green Staph Aureus particle is shown. **p = 0.0021, ***p = 0.0002. d The percent of CD11b+ myeloid pancreatic cells that phagocytosed KPCGFP+ tumor cells in PBS (n = 5) and 7-day WGP (n = 5) mice. *p = 0.0103. Cells were first gated on the CD45+ population. The summarized MFI of the GFP+ signal is also shown. *p = 0.0379. e Enrichment plots (GSEA) and heatmap of genes related to the reactive oxygen species biosynthetic processes and the positive regulation of reactive oxygen species metabolic processes in CD11b+ cells from 7-day WGP-trained as compared to PBS mice. f Summarized results from a cytotoxicity assay where CD11b+ cells from PBS and 7-day WGP-trained mice were sorted and incubated at a ratio of 1:20 KPCLuc+: CD11b+ cells for 24 h. NAC was used to block ROS expression and the tumor cytotoxicity was assessed by luminescence (PBS n = 3, WGP n = 4). g Summarized data from cytotoxicity assays where CD11b+ cells from 7-day WGP-trained mice were sorted and incubated at a ratio of 1:20 KPCLuc+: CD11b+ cells for 24 h. Trolox or DFO or respective vehicle controls were added and tumor cytotoxicity was determined by measuring luminescence (n = 3). *p = 0.0255, **p = 0.0019. An unpaired, two-tailed student’s t-test was used in bd and g and a one-way ANOVA with multiple comparisons was used for f. Data were represented as mean ± SEM. ns not significant. In bg, each sample represents a biologically independent animal obtained over a single independent experiment which was repeated at least twice for verification of results.
Fig. 6
Fig. 6. The induction of trained immunity in the pancreas has anti-tumor effects.
a Experimental schema. b C57BL/6 mice received a single IP injection of WGP or PBS and 7 days mice were implanted orthotopically with KPC pancreatic cancer cells. Representative pictures of tumors and quantitative analysis of tumor weight are shown. Tumor weight was measured at day 21 (PBS n = 10, WGP n = 12). ***p = 0.0004. c C57BL/6 mice (n = 4) received a single i.p. injection of WGP or PBS and 7 days later were implanted orthotopically with KPC+Luc pancreatic cancer cells. On day 21 post tumor implantation, mice were given I.P. luciferin bioluminescent substrate and were placed in a photon imager to measure tumor size in vivo. *p = 0.0403. d Survival of mice in the experimental schema shown in a, using KPC cells (n = 5). **p = 0.0018. e Phenotyping of the tumors showing the percent of viable cells that are CD45+, the percent of the CD45+ population that are CD11b+, and the percent of CD11b+ cells that are F4/80+ (PBS n = 10, WGP n = 9). *p = 0.0165 (CD45), ***p = 0.0001 (CD11b), **p = 0.0034 (F4/80). f TNFα production in CD11b+ cells from PBS and 7-day WGP-trained that were restimulated with LPS. Percent of TNFα+ cells and the MFI of TNFα are shown (PBS n = 10, WGP n = 9). **p = 0.007, ***p = 0.0002. g Summarized data of TNFα production in CD11b+F4/80+ cells from PBS and 7-day WGP-trained that were restimulated with LPS. Percent of TNFα+ cells and the MFI of TNFα are shown (PBS n = 10, WGP n = 9). *p = 0.0155, ***p = 0.0001. h Tumor weight was correlated with the percent of CD45+ immune cells that were CD11b+ (left) and the percent of CD45+CD11b+TNFα+ cells (right). (PBS n = 10, WGP n = 9). i Summarized data of the percent of CD4 + and CD8 + T-cells expressing IFNγ (PBS n = 10, WGP n = 9) Data were represented as mean ± SEM. Pearson correlation coefficients were used to measure the strength of the linear associations and unpaired, two-tailed student’s t-tests were used otherwise. ns not significant. Each sample represents a biologically independent animal obtained over a single independent experiment which was repeated at least twice for verification of results.
Fig. 7
Fig. 7. The anti-tumor effector mechanisms of WGP treatment and clinically relevant models.
a WT and CCR2−/− mice were treated with PBS or WGP and 7 days later were implanted with orthotopic KPC pancreatic tumor cells. Tumor weight at day 21 is reported. (WT PBS n = 5, WT WGP n = 6, CCR2 PBS n = 6, CCR2−/− WGP n = 6). **p = 0.0027 (WT PBS vs WT WGP), *p = 0.0118 (WT WGP vs CCR2−/− PBS), **p = 0.0034 (WT WGP vs CCR2−/− WGP). b Sorted CCR2+ and CCR2 pancreatic CD11b+ cells from WGP-trained mice were admixed with KPC cells and implanted orthotopically. Tumor size was evaluated 21 days later (CCR2+ n = 5, CCR2 n = 5). *p = 0.0247. c t-SNE plots generated by CyTOF analysis of the admix tumors from b. Clusters showing significant differences between groups are indicated by the circles. Total data (left) and representative t-SNE plots of each group are shown. d Summarized percent of CD8+ and CD11b+ cells in admix tumors (PBS n = 4, WGP n = 3). *p = 0.01, **p = 0.007. e The ratio of CD8+:CD11b+ cells in admix tumors (PBS n = 4, WGP n = 3). *p = 0.0474. f Expression of PD-L1 on KPC tumor cells, CD11b+ and F4/80+ cells in a KPC tumor 21 days after implantation (KPC n = 5, CD11b+ n = 6, F4/80+ n = 6). g Experimental schema of WGP and anti-PD-L1 therapy. Mice (n = 5) were treated with PBS or WGP and 7 days later were implanted with orthotopic KPC pancreatic tumors. On days 3, 7, and 11 post-implantation, mice were given anti-PD-L1 mAb or anti-rat IgG2b mAb isotype control. Survival was monitored. **p = 0.0018 (WGP vs PBS or PD-L1), **p = 0.0021 (WGP vs WGP + PD-L1). h Experimental schema of WGP used in the therapeutic setting. Mice were implanted with orthotopic KPC pancreatic tumors and were given WGP once mice had recovered from the surgery at day 4, and 1 week later on day 11. *p = 0.0163. Data were represented as mean ± SEM. A one-way ANOVA with multiple comparisons was used for a and an unpaired, two-tailed student’s t-test was used for b, d, and e. Log-rank test was used for g and h. ns not significant. Each sample represents a biologically independent animal obtained over a single independent experiment which was repeated at least twice for verification of results.

References

    1. ACS. Cancer facts & figures 2020. https://www.cancer.org/content/dam/cancer-org/research/cancer-facts-and-... (2020).
    1. Rahib L, et al. Projecting cancer incidence and deaths to 2030: the unexpected burden of thyroid, liver, and pancreas cancers in the United States. Cancer Res. 2014;74:2913–2921. - PubMed
    1. Kommalapati, A., Tella, S. H., Goyal, G., Ma, W. W. & Mahipal, A. Contemporary management of localized resectable pancreatic cancer. Cancers10, 24 (2018). - PMC - PubMed
    1. Bliss LA, Witkowski ER, Yang CJ, Tseng JF. Outcomes in operative management of pancreatic cancer. J. Surg. Oncol. 2014;110:592–598. - PubMed
    1. Schizas D, et al. Immunotherapy for pancreatic cancer: a 2020 update. Cancer Treat. Rev. 2020;86:102016. - PubMed

Publication types