. 2022 Feb 9;12(1):2155.
doi: 10.1038/s41598-022-05863-y.

Evidence that large vessels do affect near infrared spectroscopy

Affiliations

Evidence that large vessels do affect near infrared spectroscopy

Stefano Seddone et al. Sci Rep. .

Abstract

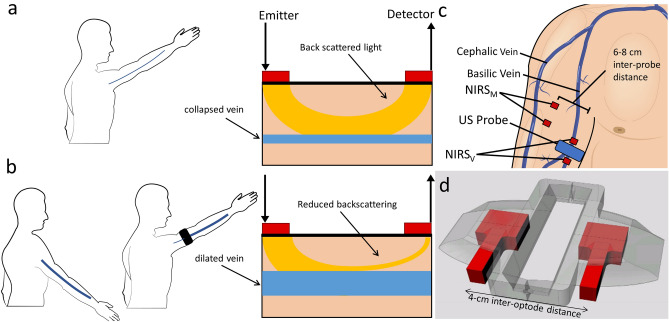
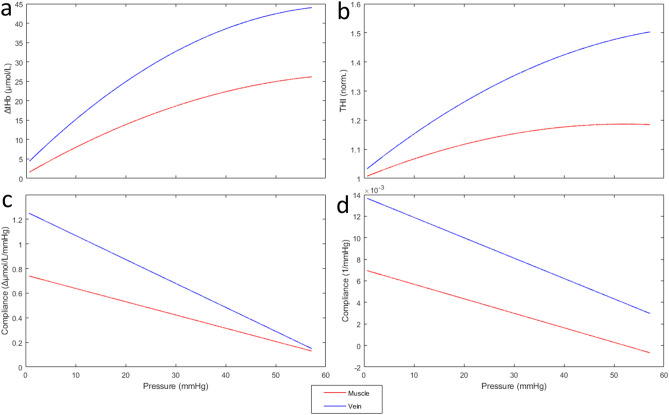
The influence of large vessels on near infrared spectroscopy (NIRS) measurement is generally considered negligible. Aim of this study is to test the hypothesis that changes in the vessel size, by varying the amount of absorbed NIR light, could profoundly affect NIRS blood volume indexes. Changes in haemoglobin concentration (tHb) and in tissue haemoglobin index (THI) were monitored over the basilic vein (BV) and over the biceps muscle belly, in 11 subjects (7 M - 4 F; age 31 ± 8 year) with simultaneous ultrasound monitoring of BV size. The arm was subjected to venous occlusion, according to two pressure profiles: slow (from 0 to 60 mmHg in 135 s) and rapid (0 to 40 mmHg maintained for 30 s). Both tHb and THI detected a larger blood volume increase (1.7 to 4 fold; p < 0.01) and exhibited a faster increase and a greater convexity on the BV than on the muscle. In addition, NIRS signals from BV exhibited higher correlation with changes in BV size than from muscle (r = 0.91 vs 0.55, p < 0.001 for THI). A collection of individual relevant recordings is also included. These results challenge the long-standing belief that the NIRS measurement is unaffected by large vessels and support the concept that large veins may be a major determinant of blood volume changes in multiple experimental conditions.


Conflict of interest statement

The authors declare no competing interests.

Figures

Figure 1
Figure 1
(a) Vein collapse during arm elevation results in little absorption of NIR light by the vein and consequently in high intensity of the light backscattered to the detector. (b) Vein dilation, during, e.g., arm lowering or venous occlusion, increases the absorption and reduces the amount of backscattered light, which produces an increase of NIRS blood volume indexes; (c) location of NIRS probes: one NIRS probe was positioned over the biceps muscle belly (NIRSM) and one over the basilic vein (NIRSV); an ultrasound probe was coupled with NIRSV to monitor size changes in the cross-sectional area of the basilic vein; (d) custom 3D-printed probe holder, designed to embed the linear US-probe (not drawn) in-between NIRS optodes (in red). The figure was created with Adobe Illustrator 2020, v. 24.1.1, www.adobe.com (a,c), MS PowerPoint 2019, v. 2111, www.microsoft.com (b), and Rhino 7 v.7.13, www.rhino3d.com (d).
Figure 2
Figure 2
(a) Average response to slow venous occlusion of the cross-sectional area of the basilic vein (green) and of tHb and THI as detected on the muscle (red) and on the vein (blue). Shaded areas represent the 95% confidence interval of the mean. The black trapezoid depicted in the top graph qualitatively reproduces the cuff pressure during inflation to 60 mmHg, plateau and subsequent deflation to 0 mmHg, while the vertical dashed lines indicate end of inflation (first one) and beginning of deflation (second one). (b) Peak response of blood volume indexes, collected from vein and muscle probes (top), Pearson’s coefficient of the correlation between changes in BV cross-sectional area and in blood volume indices (bottom). *p < 0.05; #p < 0.01.
Figure 3
Figure 3
Volume-pressure curves, obtained by 2° order polynomial fitting of average responses to slow cuff-deflation of Fig. 2a (top), and compliance curves, obtained as the slopes of the corresponding volume-pressure curves (bottom), for tHb (left) and THI (right) collected from vein (blue) and muscle (red). Note the large difference in the compliance estimated from vein and muscle.
Figure 4
Figure 4
Average response to rapid venous occlusion of the cross-sectional area of the basilic vein (green) and of tHb and THI as detected on the muscle (red) and on the vein (blue). Shaded areas represent the 95% confidence interval of the mean. The black trapezoid depicted in the top graph qualitatively reproduces the cuff pressure during inflation to 40 mmHg, plateau and subsequent deflation to 0 mmHg, while the vertical dashed line indicates the beginning of deflation. (b) Peak response of blood volume indexes, collected from vein and muscle probes (top), Pearson’s coefficient of the correlation between changes in BV cross-sectional area and in blood volume indices (bottom). *p < 0.05; #p < 0.01.
Figure 5
Figure 5
Original traces from a single subject showing the responses to two subsequent short lasting venous occlusions (30 and 60 mmHg, respectively). From top to bottom: cuff pressure; Cross-sectional area of brachial vein and basilic vein; tHb signals from the vein (blue) and muscle (red) probes. At the bottom, single frames of US imaging of blood vessels underneath the NIRSV probe (as indicated in Fig. 1b) are displayed, with superimposed coloured shadings indicating the extent of collapse/dilatation of the brachial (BrV) and basilic (BV) veins. The brachial artery (BrA) is also indicated. Note the unusual 2-steps increase in tHbV in response to the second occlusion, which is explained by the delayed dilatation of the basilic vein. The fact that the increase in venous size is delayed, compared to tHbV is due to the NIRS sample volume extending proximally to the US insonation site (during venous occlusion, venous pressure increases earlier at proximal than at distal sites, in the raised arm). Vertical dashed lines indicate start of cuff inflation and deflation.
Figure 6
Figure 6
Original traces from a single subject showing the responses to two subsequent short lasting occluding stimuli (both at 40 mmHg). From top to bottom: cross-sectional area of the basilic vein (green), THI, and tHb signals collected from the vein (blue) and from the muscle (red). Note the presence of an oscillatory component of respiratory origin, synchronously appearing on the vessel cross-sectional area and on the venous NIRS signals only. Vertical dashed lines indicate start of cuff inflation and deflation.
Figure 7
Figure 7
Original traces from the same subject showing tHb and THI responses to 40-mmHg venous occlusions subsequently recorded on the biceps brachii muscle belly at the original site (a) and after lateral displacement of 1 cm (b). Note the different response of THI, attributed to a small vein in the sample volume in (b). Vertical dashed lines indicate start of cuff inflation and deflation.
Figure 8
Figure 8
(a) Effect of postural changes on blood volume indices in a representative recording. From top to bottom, cuff pressure, tHbV and THIV collected from a single NIRS probe placed over the basilic vein (same set-up of Fig. 1b). The arm was moved from below to above (yellow-shaded area) and again returned to below heart level. Proximal venous occlusion (40 mmHg) was also performed for comparison, as indicated by the cuff pressure signal. Note that similar increases in blood volume are produced by venous occlusion (blue double-arrows) and arm lowering (green double-arrows). Much smaller effects are produced by venous occlusion when performed in the dependent arm (orange double-arrows). Vertical dashed lines indicate the beginning of cuff inflation and deflation. (b) Effect of muscle contraction on blood volume indices in a representative recording. Recordings are collected from the calf muscles during isometric plantar flexion of the ankle, the subject laying prone. From top to bottom, the electromyographic signal (EMG, measured over the distal portion of the soleus muscle), the force (measured at the forefoot) and THI signals form two probes, one located over an intramuscular soleus vein (blue) and one over a more distal portion of the same muscle (red). Note the different magnitude of contraction-related changes of THI at the two sites.

References

    1. Ferrari M, Mottola L, Quaresima V. Principles, techniques, and limitations of near infrared spectroscopy. Can. J. Appl. Physiol. 2004;29:463–487. doi: 10.1139/h04-031. - DOI - PubMed
    1. Ferrari M, Muthalib M, Quaresima V. The use of near-infrared spectroscopy in understanding skeletal muscle physiology: Recent developments. Philos. Trans. R. Soc. A. 2011;369:4577–4590. doi: 10.1098/rsta.2011.0230. - DOI - PubMed
    1. Barstow TJ. Understanding near infrared spectroscopy and its application to skeletal muscle research. J. Appl. Physiol. 2019;126:1360–1376. doi: 10.1152/japplphysiol.00166.2018. - DOI - PubMed
    1. Grassi B, Quaresima V. Near-infrared spectroscopy and skeletal muscle oxidative function in vivo in health and disease: A review from an exercise physiology perspective. J. Biomed. Opt. 2016;21:091313. doi: 10.1117/1.JBO.21.9.091313. - DOI - PubMed
    1. Davis ML, Barstow T. Estimated contribution of hemoglobin and myoglobin to near infrared spectroscopy. Respir. Physiol. Neurobiol. 2013;186:180–187. doi: 10.1016/j.resp.2013.01.012. - DOI - PubMed

Publication types