. 2022 Feb;602(7898):623-631.
doi: 10.1038/s41586-022-04403-y. Epub 2022 Feb 9.

Signatures of TOP1 transcription-associated mutagenesis in cancer and germline

Collaborators, Affiliations

Signatures of TOP1 transcription-associated mutagenesis in cancer and germline

Martin A M Reijns et al. Nature. 2022 Feb.

Erratum in

  • Publisher Correction: Signatures of TOP1 transcription-associated mutagenesis in cancer and germline.
    Reijns MAM, Parry DA, Williams TC, Nadeu F, Hindshaw RL, Rios Szwed DO, Nicholson MD, Carroll P, Boyle S, Royo R, Cornish AJ, Xiang H, Ridout K; Genomics England Research Consortium; Colorectal Cancer Domain UK 100,000 Genomes Project; Schuh A, Aden K, Palles C, Campo E, Stankovic T, Taylor MS, Jackson AP. Reijns MAM, et al. Nature. 2022 May;605(7910):E7. doi: 10.1038/s41586-022-04812-z. Nature. 2022. PMID: 35504971 Free PMC article. No abstract available.

Abstract

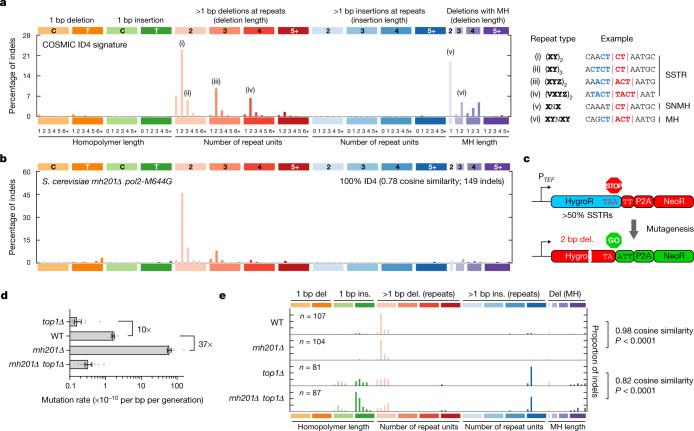
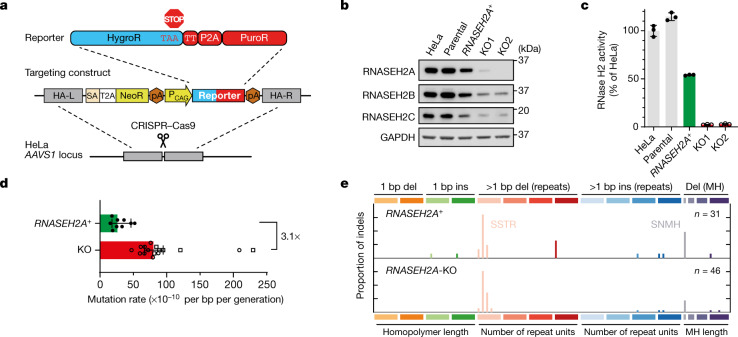
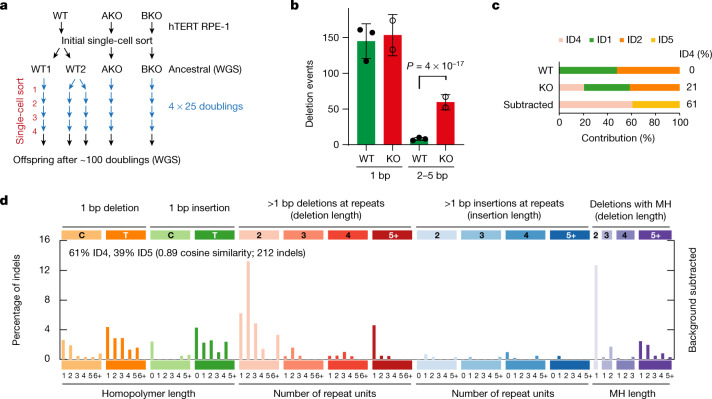
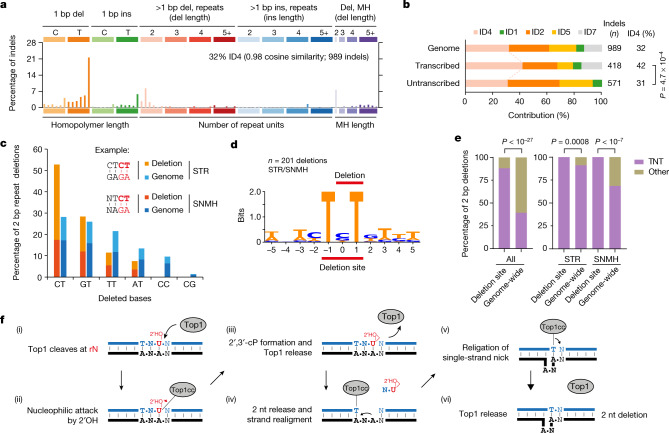
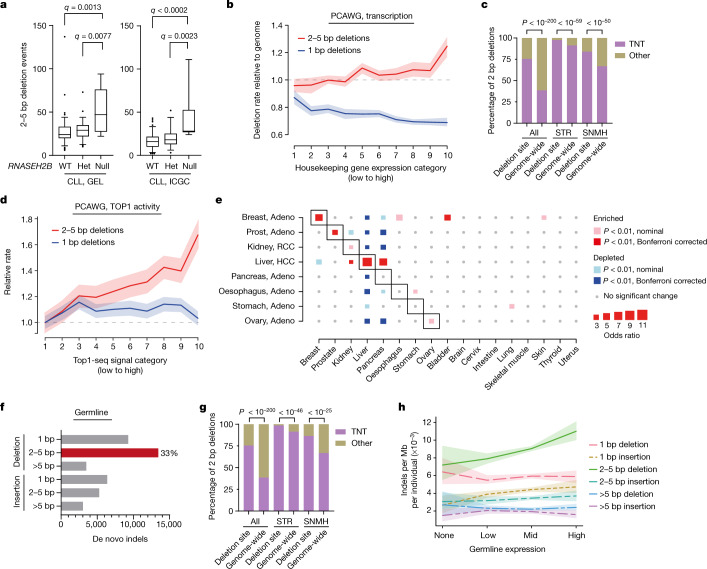
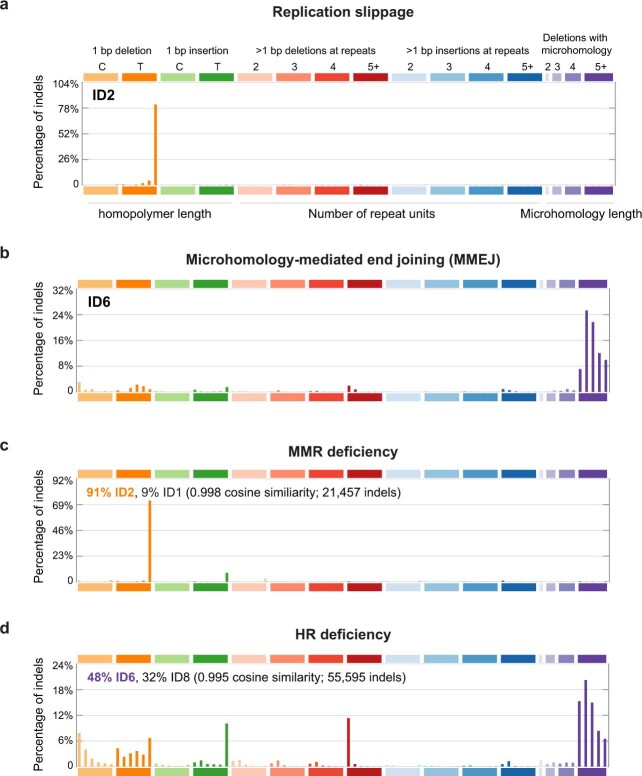
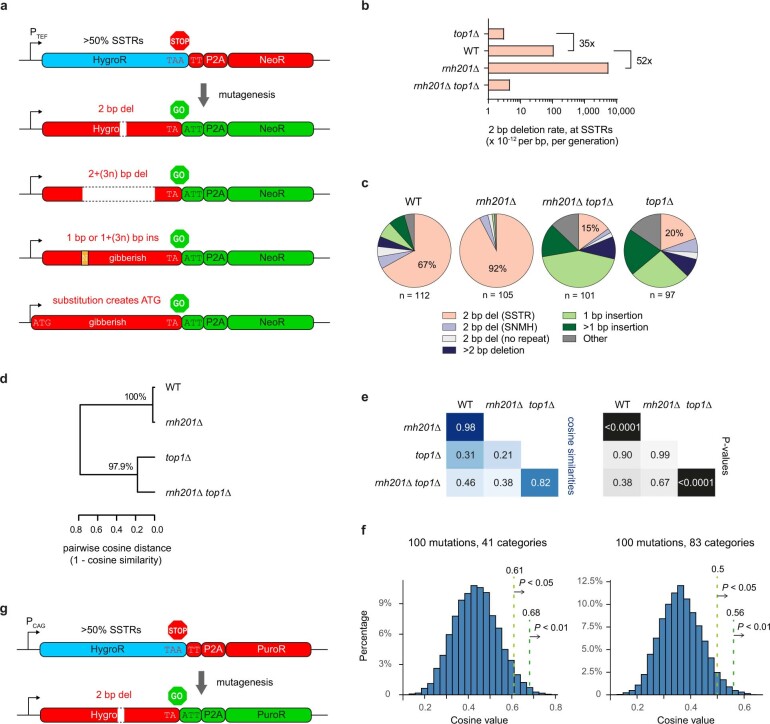
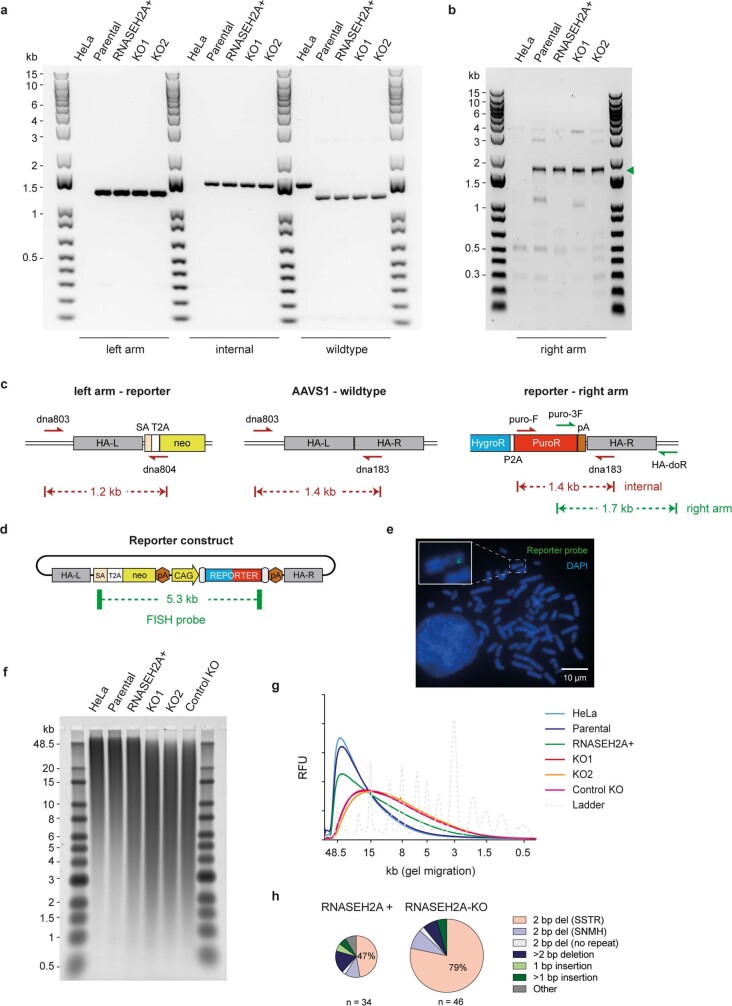
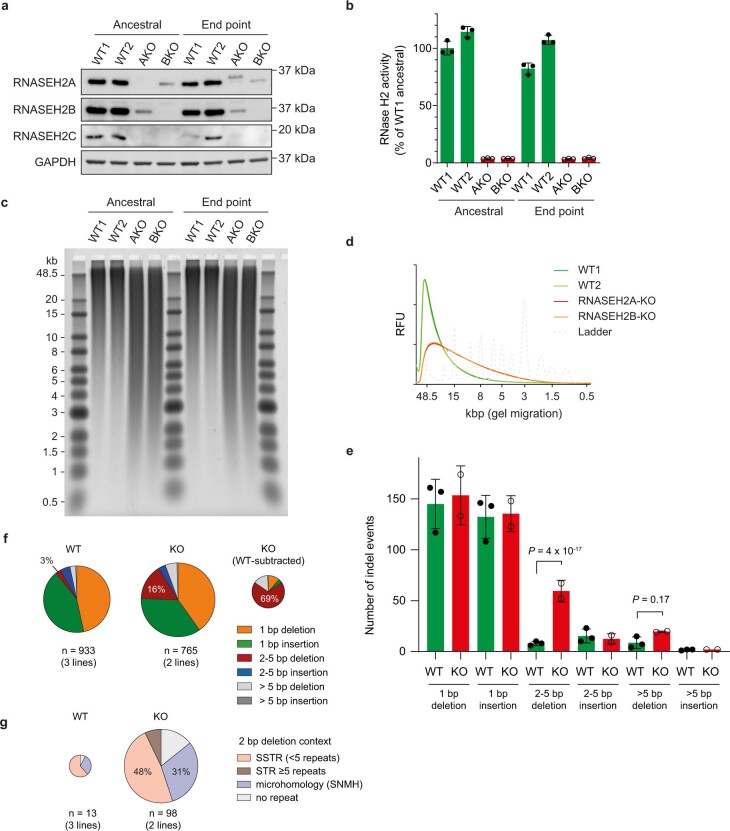
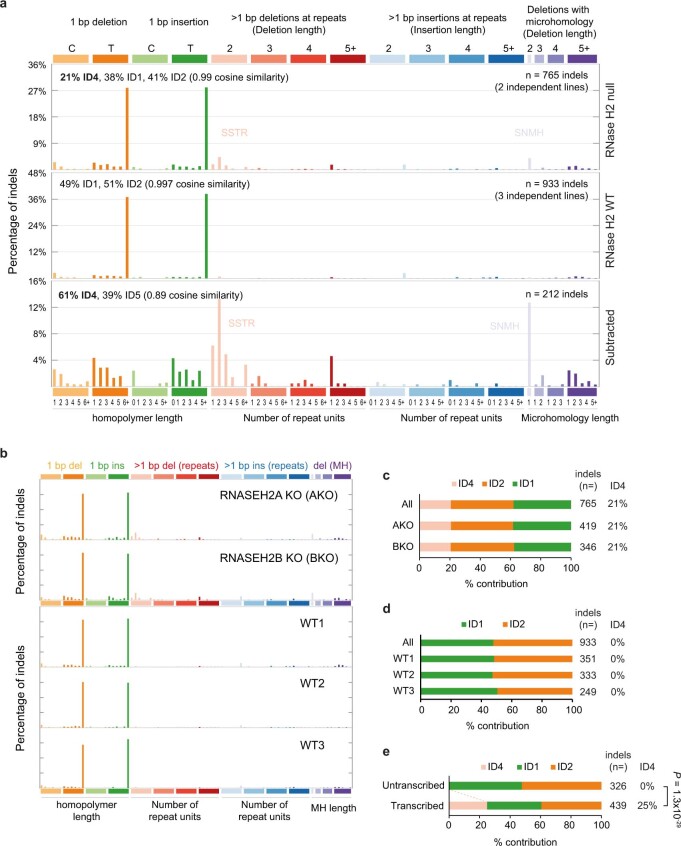
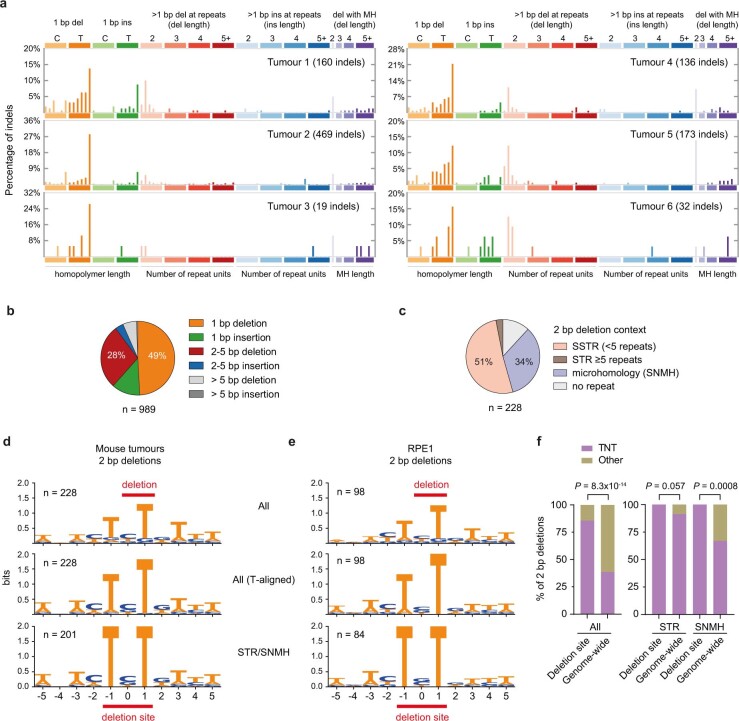
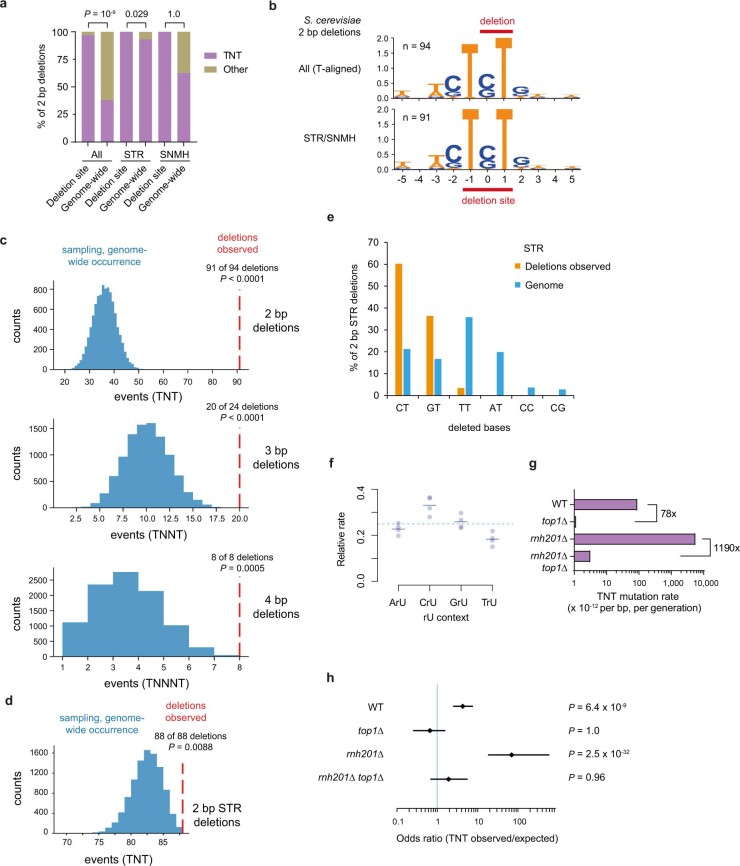
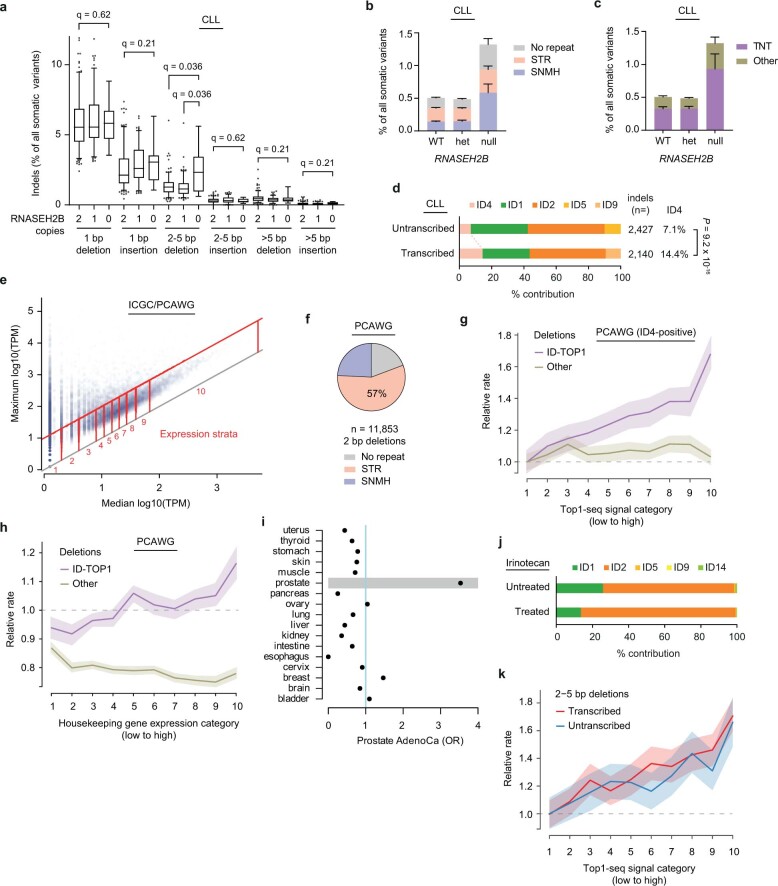
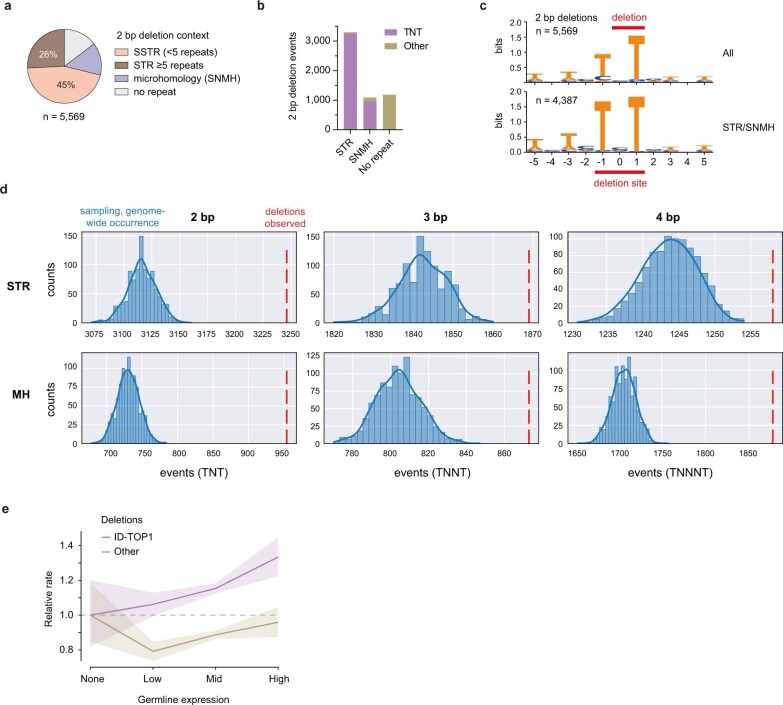
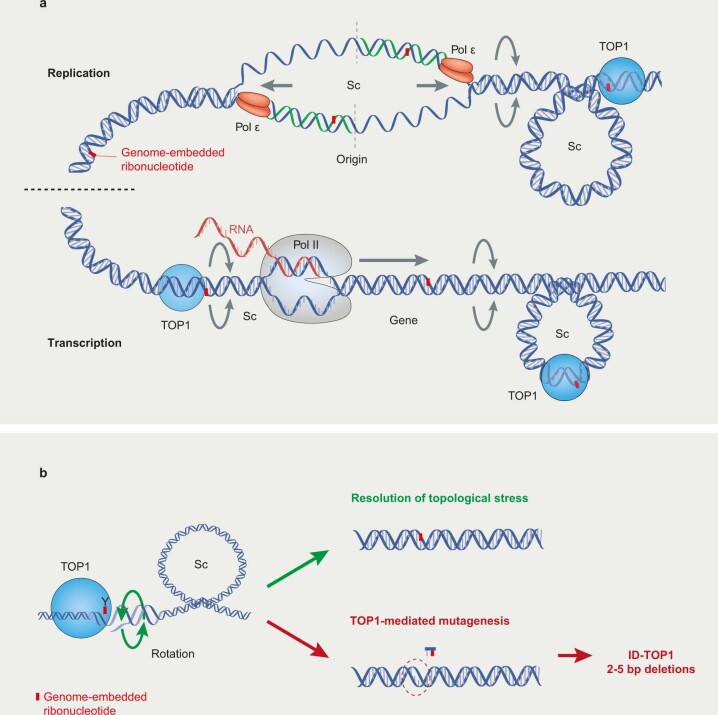
The mutational landscape is shaped by many processes. Genic regions are vulnerable to mutation but are preferentially protected by transcription-coupled repair1. In microorganisms, transcription has been demonstrated to be mutagenic2,3; however, the impact of transcription-associated mutagenesis remains to be established in higher eukaryotes4. Here we show that ID4-a cancer insertion-deletion (indel) mutation signature of unknown aetiology5 characterized by short (2 to 5 base pair) deletions -is due to a transcription-associated mutagenesis process. We demonstrate that defective ribonucleotide excision repair in mammals is associated with the ID4 signature, with mutations occurring at a TNT sequence motif, implicating topoisomerase 1 (TOP1) activity at sites of genome-embedded ribonucleotides as a mechanistic basis. Such TOP1-mediated deletions occur somatically in cancer, and the ID-TOP1 signature is also found in physiological settings, contributing to genic de novo indel mutations in the germline. Thus, although topoisomerases protect against genome instability by relieving topological stress6, their activity may also be an important source of mutations in the human genome.


Conflict of interest statement

The authors declare no competing interests.

Figures

Fig. 1
Fig. 1. Top1-dependent deletions in S. cerevisiae resemble ID4, a cancer mutational signature of unknown aetiology.
a, The ID4 signature comprises small deletions (typically 2, 3 or 4 bp in size) of one repeat unit at SSTR and MH sites. Repeated sequences (i–vi) are shown in bold and colour. Deletions are shown in red. b, Indel mutations similar to those detected in ID4 accumulate genome-wide in yeast with high levels of genome-embedded ribonucleotides. Reanalysis of WGS data for rnh201∆ pol2-M644G yeast. c, Schematic of a frameshift mutation reporter containing many 2 bp SSTRs. Frameshift mutations in HygroR result in neomycin-resistant yeast colonies. PTEF, TEF promoter; P2A, self-cleaving peptide. d, e, Fluctuation assays demonstrated that Top1-mediated 2 bp SSTR mutations occur in wild-type and RNase-H2-deficient (rnh201∆) backgrounds. d, Mutation rates for n = 16 independent cultures per strain. Data are median ± 95% confidence intervals. e, WT and rnh201Δ have similar indel mutation spectra, and differ from top1Δ strains. Spectra of neomycin-resistant colonies. n indicates the number of independent indels detected. Cosine similarity P values were empirically determined (Extended Data Fig. 2e, f). Del, deletion; ins, insertion.
Fig. 2
Fig. 2. SSTR deletions of 2 bp are increased in RNase-H2-null HeLa cells.
a, Schematic of the reporter targeting the AAVS1 safe harbour locus to generate reporter cells (Extended Data Fig. 3). HA, homology arm; L, left; R, right. b, c, Validation of RNASEH2A-KO reporter clones. b, Immunoblot analysis of cell lysates detecting the three RNase H2 subunits. GAPDH was used as the loading control. Gel source data are provided in Supplementary Fig. 1. c, Cellular RNase H2 enzyme activity. Data are mean ± s.d. n = 3 technical replicates. HeLa, no modification; parental, HeLa with reporter (grey); KO1 and KO2, CRISPR-mediated RNASEH2A-KO clones (red); RNASEH2A+, CRISPR-edited reporter clone retaining RNase H2 activity (green). d, Fluctuation assays establish a significantly increased mutation rate in RNase-H2-null (KO) cells (P = 2 × 10⁻⁶). Statistical analysis was performed using a two-sided Mann–Whitney test. Data are median ± 95% confidence intervals. The data points show the rates for independent cultures. n = 9 (RNase H2 proficient, RNASEH2A+); n = 10 (KO1, open circles) and n = 6 (KO2, open squares). e, 2 bp SSTR and SNMH deletions are frequent in both RNASEH2A+ and RNASEH2A-KO cells. Indel mutation spectra. n shows the number of indels identified by sequencing colonies from independent cultures.
Fig. 3
Fig. 3. ID4 SSTR and MH mutations are increased genome-wide in RNase-H2-deficient RPE-1 cells.
a, Schematic of the mutation-accumulation experiment. Long-term culture of hTERT RPE-1 TP53−/− RNase-H2-wildtype (WT) and RNase-H2-null cell lines (RNASEH2A-KO (AKO), RNASEH2B-KO (BKO)) bottlenecked every 25 doublings by single-cell sorting. b, Mutations acquired during long-term culture were significantly enriched for 2–5 bp deletions in RNase-H2-null cells, but the other mutation categories were not (Extended Data Fig. 4e). Data are mean ± s.d. Statistical analysis was performed using two-sided Fisher’s exact tests with Bonferroni correction, comparing wild type (counts pooled from n = 3 independent clones) versus KO (n = 2 independent clones) for 2–5 bp deletions versus all of the other indel types. c, d, ID4 occurs in RNase-H2-null cells (c) and is the major signature after subtracting background mutations that are observed in wild-type cells (d).
Fig. 4
Fig. 4. RER-deficient tumours have an ID4 signature associated with transcription and a TNT sequence motif.
a, ID4 contributes substantially to the mutational spectrum of Rnaseh2b-KO mouse intestinal tumours (WGS, paired tumour–normal samples from n = 6 mice). b, ID4 contribution is greater in transcribed regions of the genome. Statistical analysis was performed using a two-sided Fisher’s exact test, comparing ID4 versus other indels. n = 969 indels from 6 biologically independent tumours. c, 2 bp STR/SNMH deletions have biased sequence composition. Genome, frequency of dinucleotides in STR/SNMH sequences in the mappable genome. Deletions are right aligned and indicated by bold red font. d, e, A TNT sequence motif is present at all 2 bp STR and SNMH deletions. d, Sequence logo: two-bit representation of the sequence context of 2 bp deletions at STR and SNMH sequences. e, Deletion sites are significantly enriched for the TNT sequence motif compared with genome-wide occurrence, for all genome sequences, as well as STR and SNMH sites. Statistical analysis was performed using two-sided Fisher’s exact tests, comparing observed versus expected. n = 228 (all, P = 1.7 × 10−28), n = 124 (STR, P = 0.0008), n = 77 (SNMH, P = 1.4 × 10−8) deletions in 6 biologically independent tumours. f, Model for TOP1-mediated mutations at TNT sequences containing embedded ribonucleotides, in which strand realignment results in a two-nucleotide deletion (see main text). nt, nucleotide.
Fig. 5
Fig. 5. TOP1-mediated deletions in human cancer and germline.
a, Deletions of 2–5 bp are significantly increased in CLL with biallelic RNASEH2B deletions (null). For the box plots, the box limits show from 25% to 75%, the centre line shows the median, the whiskers show from 5% to 95% and the data points show values outside the range. For GEL and ICGC, respectively, n = 116 and n = 85 (wild type); n = 72 and n = 59 (heterozygous (het)); and n = 10 and n = 6 (null) tumours. Multiple-testing-corrected q values were determined using two-sided Mann–Whitney U-tests. bd, ID-TOP1 deletions are frequent somatic mutations in cancer. b, Indels per expression stratum of ubiquitously expressed genes (defined in Extended Data Fig. 8e). The dotted line shows the genome-wide rate. c, Deletions of 2 bp preferentially occur at TNT motifs. Statistical analysis was performed using two-sided Fisher’s exact tests, comparing observed versus expected. n = 11,853 (all; P < 10−200), n = 6,699 (STR; P = 1.9 × 10−60), n = 2,872 (SNMH; P = 1.5 × 10−51) deletions. d, Deletions of 2–5 bp increase with TOP1 cleavage activity in ID4-positive PCAWG tumours. The solid lines show the relative deletion rate. The shading shows the 95% confidence intervals from 100 (b) or 1,000 (d) bootstrap replicates. For bd, n = 11,853 biologically independent tumours. e, Deletions of 2–5 bp are enriched at tissue-specific highly transcribed genes in associated cancers. Heat map of significant odds ratio scores (2–5 bp deletions in top 10% tissue-restricted genes versus 2–5 bp deletions in other genes, relative to expected frequency from all other tissues) for normal-tissue–tumour pairs. Statistical analysis was performed using two-sided Fisher’s exact tests. Adeno, adenocarcinoma; HCC, hepatocellular carcinoma; RCC, renal cell carcinoma. fh, ID-TOP1 deletions are frequent human de novo mutations that are enriched in highly transcribed germ cell genes. f, Deletions of 2–5 bp are the most common indels in the human germline. Gene4Denovo WGS data (n = 40,936 indels). g, TNT sequence motif is significantly enriched in de novo 2 bp deletions. Statistical analysis was performed using two-sided Fisher’s exact tests, comparing observed versus expected. n = 5,569 2 bp deletions (P < 10−200), at STR (n = 3,294; P = 5.2 × 10−47) and SNMH sequences (n = 1,093; P = 2.9 × 10−26). h, The 2–5 bp deletion frequency is correlated with gene transcription level in germ cells. Solid lines, Gene4Denovo indel mutations per individual per Mb. The shading shows the 95% confidence intervals from 100 bootstrap replicates.
Extended Data Fig. 1
Extended Data Fig. 1. ID4 is distinct from small deletion signatures of known aetiology.
a, b, The mechanistic basis for many COSMIC indel signatures is unknown, with only 9 out of 18 having a proposed aetiology. ID2 (a) is attributed to DNA polymerase slippage, and ID6 (b) to microhomology mediated end-joining (MMEJ) activity, associated with HR deficiency,. c, d, Mechanism for these signatures supported by: impaired MMR promoting replication slippage mutagenesis in MLH1−/− colonic organoids resulting in ID2 (and ID1) signatures (c); ID6 contributing substantially (along with ID8) to the indel signature in ovarian cancer, in which HR deficiency is common (d). Analysis of data from in c; data for 73 ovarian adenocarcinomas with ID6 contribution from ICGC, in d.
Extended Data Fig. 2
Extended Data Fig. 2. Yeast and human frameshift mutation reporters detect indels at tandem repeats.
a, Yeast reporter. Synonymous substitutions were made in the hygromycin resistance gene (HygroR), such that it contained many short 2 bp tandem repeats (SSTRs). Expression from the TEF promoter (PTEF) ensures a constitutive high level of transcription. Mutations within HygroR that result in a frameshift simultaneously put the HygroR coding sequence out of frame and the downstream neomycin resistance (NeoR) sequence in frame, allowing antibiotic selection of cells with such mutations. b, Top1-dependent 2 bp SSTR deletions occur in both WT and rnh201Δ (RNase H2 null) yeast, with the highest mutation rate for rnh201Δ (related to Fig. 1d). ce, WT and rnh201∆ have similar spectra, and differ from top1∆ strains. Mutation spectra of neomycin resistant colonies. n, number of independent colonies sequenced. Other: complex indels, missense mutations or mutation not characterised (c). Tree for pairwise clustering with percent bootstrap support to the right of the indicated position, based on cosine scores calculated for mutation spectra (Fig. 1e) of the 41 mutation categories that give productive reporter frameshift mutations (d). Matrix of pairwise cosine similarities and P-values between reporter mutation spectra in different yeast strains. Darker blue indicates greater similarity; darker grey greater significance. Test statistic is the cosine similarity value for 41 mutation categories and the null hypothesis is that that the cosine value will be distributed according to the Dirichlet-multinomial model, as described in Methods. The test is one-sided and no adjustments were made for multiple comparisons (e). f, Null distribution for cosine pairwise vector comparisons for 41 and 83 mutation categories. Plots, cosine values for 10,000 randomly generated pairs of vectors of mutation spectra. Each vector contained 100 randomly assigned mutations (see Methods for further details). Cosine value thresholds indicated for P < 0.05 and P < 0.01. g, The human reporter is expressed from the ubiquitous CAG promoter (PCAG), and NeoR is replaced with the puromycin resistance gene (PuroR) to allow more rapid antibiotic selection in mammalian cell culture.
Extended Data Fig. 3
Extended Data Fig. 3. Validation and characterisation of RNASEH2A+ and KO HeLa reporter cells.
ac, Reporter integration at the AAVS1 locus and retention of a reporter-free locus with a 200 bp deletion at the target site was confirmed by PCR and Sanger sequencing. Green arrow head, specific PCR product. Representative of at least 2 independent experiments. d, e, FISH shows integration of the reporter (d) at a single AAVS1 locus (e). Representative image of approximately one hundred mitotic chromosome spreads in 3 independent experiments. SA, splice acceptor; T2A, self-cleaving peptide; pA, polyadenylation site; also see Fig. 2a. f, g, Alkaline gel electrophoresis of RNase H2 treated genomic DNA (f) shows a small increase in fragmentation for the RNASEH2A+ control clone and a more substantial increase in two independent RNASEH2A-KO clones (representative of 4 independent experiments), indicating the presence of more genome-embedded ribonucleotides compared to HeLa and parental reporter cells (g). “Control KO” cells were reported previously,. RFU, relative fluorescence units. h, 2 bp SSTR deletions are frequent in both RNASEH2A+ and KO cells. Mutation spectra, quantitation of indel type. Relative area of pie charts scaled to mutation rate. n, number of colonies sequenced from independent cultures. Other: complex indels or missense mutations.
Extended Data Fig. 4
Extended Data Fig. 4. RPE1 RNase H2 null cells accumulate embedded ribonucleotides and 2-5 bp deletions across the genome.
a, b, RNASEH2A and RNASEH2B KO cells (AKO, BKO, respectively) have substantially reduced cellular levels of RNase H2 subunits (a) and are deficient for RNase H2 enzyme activity (b) at the outset (ancestral) and at the end of the mutation accumulation experiment (end point). Individual data points, n = 3 technical replicates; mean ± s.d. For gel source data, see Supplementary Fig. 1. c, d, Alkaline gel electrophoresis of RNase H2 treated genomic DNA (c) shows a substantial increase in fragmentation for RNASEH2A and RNASEH2B KO clones (representative of 3 independent experiments), indicating the presence of more genome-embedded ribonucleotides compared to two WT control clones (d). Densitometry plots of c. RFU, relative fluorescence units. As RNase H2 deficiency activates the p53 pathway,, experiments were performed in a TP53 knockout background. e, Only 2–5 bp deletions are significantly increased in RNase H2 null cells. Data points for acquired indel mutations in individual cell lines after 100 population doublings. Individual data points, indel counts per cell line; mean ± s.d.; P-values for two-sided Fisher’s exact test between WT (pooled counts from n = 3 independent clones) and KO (n = 2 independent clones) for one indel type vs all other indel types, after Bonferroni correction. f, Proportions of acquired indels in WT and KO RPE cells. After correction for indels occurring in WT, 69% of indels in RNase H2 null cells are 2–5 bp deletions. n, total indel counts. g, Quantification of 2 bp deletions by context. n, total number of 2 bp deletions. For f, g, chart areas scaled to mutation counts per line.
Extended Data Fig. 5
Extended Data Fig. 5. ID4 occurs in RNase H2 null RPE1 cells, particularly in transcribed regions.
ad, Mutational spectra detected by WGS after 100 population doublings in RPE1 cells demonstrates that SSTR and SNMH/MH deletions are enriched in RNase H2 null cells. Spectra for combined RNase H2 null and wildtype cell lines (a), and individual cell lines (b). Mutational signature analysis confirms ID4 contribution in RNase H2 null (c), but not WT cells (d). e, In RNase H2 null cells, ID4 contributes significantly more to indel mutations in transcribed genomic regions (P = 1.3 x 10⁻²⁹). Two-sided Fisher’s exact test, ID4 indels vs other indels.
Extended Data Fig. 6
Extended Data Fig. 6. ID4 mutations in RNase H2 null mouse tumours and RPE1 cells occur at a TNT motif, defining ID-TOP1.
a, Mutation spectra for individual Rnaseh2b-KO mouse intestinal tumours (WGS, paired tumour–normal samples from 6 mice). b, Indel classes, detected in mouse Rnaseh2b-KO tumours. n, total indel count for 6 tumours. c, Most 2 bp deletions in these tumours occur at SSTRs and sites of single nucleotide microhomology (SNMH). n, number of 2 bp deletions. d, e, A TNT sequence motif is present at all 2 bp STR and SNMH deletions in RNase H2 null mouse tumours (d) and RPE1 cells (e). Related to Fig. 4d and Fig. 3, respectively. Sequence logo: 2-bit representation of the sequence context of 2 bp deletions. Top, all deletions, with those sequences containing a deleted adenosine (except AT/TA) reverse complemented, and deletions right-aligned. Middle, re-aligned on right-hand T. Bottom, aligned on T (STR and SNMH context only). n, number of deletions. f, Deletion sites in RNase H2 null RPE1 cells are significantly enriched for the TNT sequence motif compared to genome-wide occurrence, for all genome sequence, as well as SNMH sites. P-values, two-sided Fisher’s exact, observed vs expected. n = 98 (all; P = 8.3 x 10⁻¹⁴), 54 (STR; P = 0.057), 30 (SNMH; P = 0.0008) deletions.
Extended Data Fig. 7
Extended Data Fig. 7. ID4 deletions in RNase H2 null S. cerevisiae occur at a TNT motif in a Top1-dependent manner.
a, 2 bp deletion sites in rnh201∆ pol2-M644G yeast are significantly enriched for the TNT sequence motif compared to genome-wide occurrence, for all genome sequence, as well as STR sites. P-values, two-sided Fisher’s exact, observed vs expected. n = 94 (all; P = 1.0 x 10⁻⁹), 91 (STR; P = 0.029), 3 (SNMH; P = 1) deletions. b, A TNT sequence motif is present at all 2 bp STR and SNMH deletions in rnh201∆ pol2-M644G yeast. Sequence logo: 2-bit representation of the sequence context of 2 bp deletions. Top, all deletions, with those sequences containing a deleted adenosine (except AT/TA) reverse complemented, and deletions aligned on right-hand T. Bottom, aligned on T (STR and SNMH context only). n, number of deletions. c, d, TN*T motifs extend beyond 2 bp deletions, with enrichment above expectation for 2 bp deletions at TNT, 3 bp deletions at TNNT and 4 bp deletions at TNNNT motifs in rnh201∆ pol2-M644G yeast WGS. Null expectations were generated by randomly simulating deletions of 2, 3 and 4 bp (c) or 2 bp STR sequences (d) genome-wide and scoring those simulated events for TN*T compliance. Each simulated dataset matched the count of observed mutations for the corresponding deletion class and n = 1,000 replicate simulated datasets were produced. The frequency distribution of TN*T compliance in simulations is plotted as histograms, and comparison to the observed frequency of TN*T compliance (dotted red lines) used to derive a two-tailed empirical P-value. e, 2 bp STR deletions have biased sequence composition. Deletions observed in rnh201∆ pol2-M644G yeast WGS. Genome, frequency of dinucleotides in STR sequences in mappable genome. f, Ribouridine (rU) is more common in a CrU/GrU than in an ArU/TrU dinucleotide context. Genome-embedded ribonucleotide frequency determined by emRiboSeq. Dotted line indicates relative rate in absence of bias (=0.25). Horizontal lines, mean; individual data points, values for n = 4 independent experiments. g, h, 2 bp TNT deletions in wildtype and RNase H2 null cells are dependent on Topoisomerase 1. Mutation rates for 2 bp deletions at TNT-compliant SSTRs (g). Deletions at TNT motifs are significantly increased above expectation in WT and rnh201∆, but not in top1∆ and rnh201∆ top1∆ yeast. Horizontal bars, 95% confidence intervals for odds ratio estimates (diamonds). P-values, two-sided Fisher’s exact after Bonferroni correction; n = 86, 28, 103, 19 2-bp deletions, with each deletion from an independent culture, for WT, top1∆, rnh201∆, rnh201∆ top1∆, respectively. Null expectation, random occurrence of mutations in reporter target sequence (h).
Extended Data Fig. 8
Extended Data Fig. 8. TOP1-mediated mutagenesis causes increased 2–5 bp deletions in cancer.
a, Of all indels, only 2–5 bp deletions are significantly increased in CLL with biallelic RNASEH2B loss. Box, 25–75%; line, median; whiskers 5–95% with data points for values outside this range. WT (2 copies), n = 201; monallelic loss (1 copy), n = 131; biallelic loss (0 copies), n = 16 independent tumours. Indels as percentage of all variants per sample (GEL and ICGC data combined). q-values, 2-sided Mann-Whitney test with 5% FDR. b, c, In RNase H2 null CLL, 2 bp deletions predominantly occur at STR and SNMH sequences (b), and at the TNT sequence motif (c), consistent with TOP-mediated mutagenesis. Mean ± s.e.m., percentage of all variants per sample. GEL and ICGC data combined. n = 1,711; 1,244; 443 2-bp indels identified in 201, 131, 16 biologically independent tumours, respectively. d, ID4 contribution in RNase H2 null CLL is greater in transcribed regions. Two-sided Fisher’s exact test, ID4 indels vs other indels (P = 9.2 x 10⁻¹⁶). e, Pan-cancer transcript expression data divided into ten expression strata for ubiquitously expressed genes (used in panel h and Fig. 5b analysis). Data points, median/maximum expression across cancer types for individual genes. Genes with similar median and maximum TPMs were considered to be ubiquitously expressed and divided into expression groups from low (1) to high (10) expression. f, Two bp deletions in cancer preferentially occur at STRs. g, ID-TOP1 deletions increase in frequency with TOP1 cleavage activity (measured by TOP1-Seq;). Dotted line, relative rate in lowest TOP1-seq category set to 1. Solid lines, relative deletion rate. ID-TOP1, 2–5 bp MH and SSTR deletions containing the TN*T sequence motif. h, ID-TOP1, but not deletions in other sequence contexts, correlate with transcription. i, 2–5 bp deletions from prostate adenocarcinoma are most enriched amongst the top 10% of highly expressed prostate ‘tissue-restricted’ genes. Odds ratio (OR): number of 2–5 bp deletions in top 10% tissue restricted genes vs 2–5 bp deletions in other genes, relative to expected frequency from all other tissues. j, ID4 is not detected in the indel signature of irinotecan-treated colorectal cancers. Untreated (n = 78), treated (n = 39). k, 2–5 bp deletion frequency in cancer corresponds to TOP1 cleavage activity, in both genic and non-genic regions. Data analysed from PCAWG, all tumours in e, h; ID4 positive tumours in g, k; Genomics England in j. In g, h and k, solid line, relative deletion rate; shading indicates 95% confidence intervals from 1,000 (g, k) or 100 (h) bootstrap replicates.
Extended Data Fig. 9
Extended Data Fig. 9. Human germline de novo indels are enriched for ID-TOP1 deletions.
a, Most de novo 2 bp deletions occur at SSTR, STR and SNMH sequences. b, c, A TNT sequence motif is present at the majority of 2 bp STR and SNMH deletions (b). Sequence logos: 2-bit representation of the sequence context of 2 bp deletions. Top, all deletions, with those containing A (except AT/TA) reverse complemented, and deletions right-aligned on T (where present). Bottom, STR/SNMH deletions only (c). d, TN*T motifs extend beyond 2 bp deletions, with enrichment above expectation for 2 bp deletions at TNT, 3 bp deletions at TNNT and 4 bp deletions at TNNNT motifs (P < 0.001; two-tailed empirical P-value determined for each category). Bootstrap sampling (n = 1,000) of 2, 3 and 4 bp STR/MH sequences genome-wide to derive expected frequencies of those matching TN*T motifs. Sampling was performed to match the numbers of deletions at repeats observed in the Gene4Denovo database for each category defined by repeat type, repeat unit length and total repeat length. Histograms, distribution of the number of repeats matching TN*T motifs over these samplings. Solid blue lines, kernel density estimates for these distributions. Dotted red lines, number of deletions observed in Gene4Denovo matching TN*T motifs for each category. e, ID-TOP1 correlates with germline expression level. ID-TOP1, defined as 2–5 bp MH and SSTR deletions containing the TN*T sequence motif. Shading, 95% confidence intervals from 100 bootstrap replicates.
Extended Data Fig. 10
Extended Data Fig. 10. Topoisomerase 1 causes small deletions while protecting against topological stress.
a, The canonical role of Topoisomerase 1 (TOP1) is to relieve torsional stress (sc, supercoiling) during replication and transcription. b, TOP1 acts by forming ssDNA nicks to release supercoils and then religates the relaxed DNA. However, TOP1 cleavage at genome-embedded ribonucleotides (frequently incorporated by replicative polymerases such as Pol ε), can lead to short deletions that will be most frequent at sites of torsional stress in the genome, such as occurs at highly transcribed genes. Adapted with permission from ref. , SpringerNature.

Comment in

References

    1. Hanawalt PC, Spivak G. Transcription-coupled DNA repair: two decades of progress and surprises. Nat. Rev. Mol. Cell Biol. 2008;9:958–970. - PubMed
    1. Datta A, Jinks-Robertson S. Association of increased spontaneous mutation rates with high levels of transcription in yeast. Science. 1995;268:1616–1619. - PubMed
    1. Herman RK, Dworkin NB. Effect of gene induction on the rate of mutagenesis by ICR-191 in Escherichia coli. J. Bacteriol. 1971;106:543–550. - PMC - PubMed
    1. Jinks-Robertson S, Bhagwat AS. Transcription-associated mutagenesis. Annu. Rev. Genet. 2014;48:341–359. - PMC - PubMed
    1. Alexandrov LB, et al. The repertoire of mutational signatures in human cancer. Nature. 2020;578:94–101. - PMC - PubMed