. 2022 Feb;602(7897):510-517.
doi: 10.1038/s41586-022-04398-6. Epub 2022 Feb 9.

Mapping clustered mutations in cancer reveals APOBEC3 mutagenesis of ecDNA

Affiliations

Mapping clustered mutations in cancer reveals APOBEC3 mutagenesis of ecDNA

Erik N Bergstrom et al. Nature. 2022 Feb.

Abstract

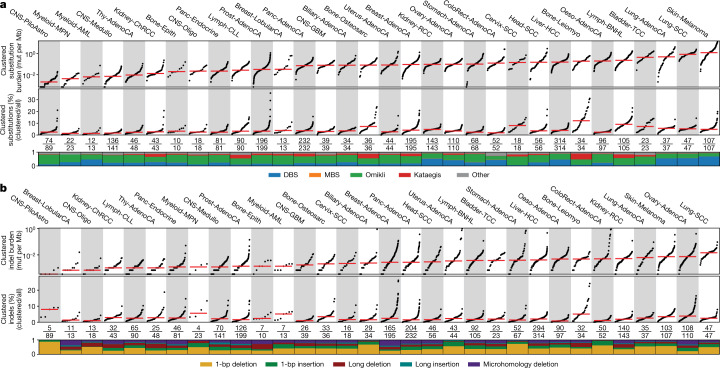
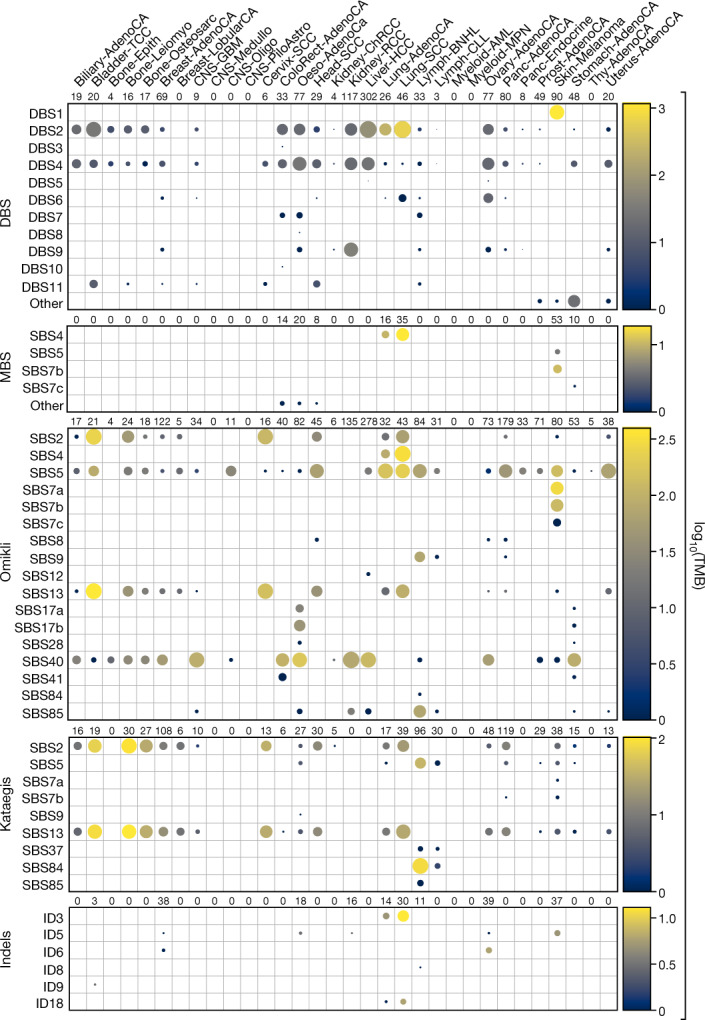
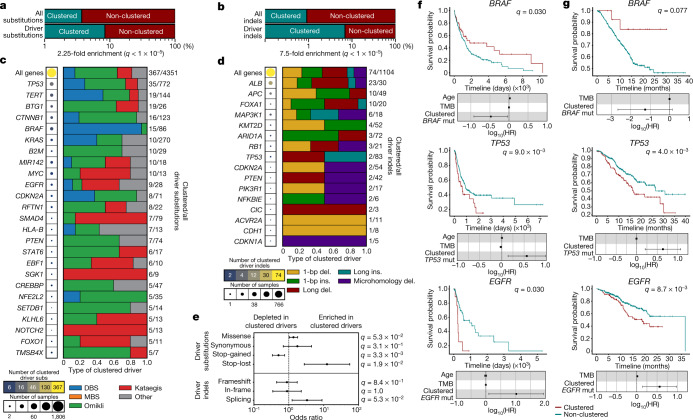
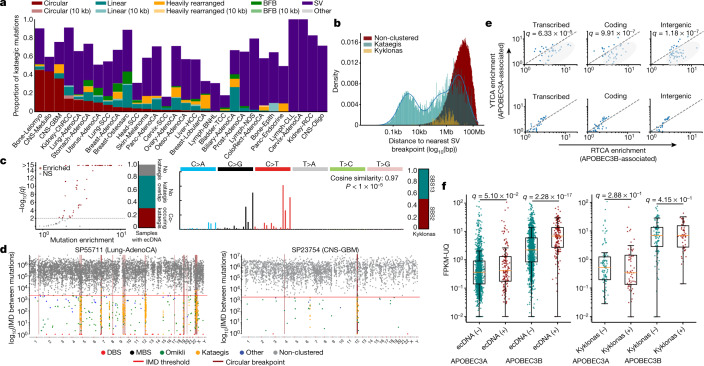
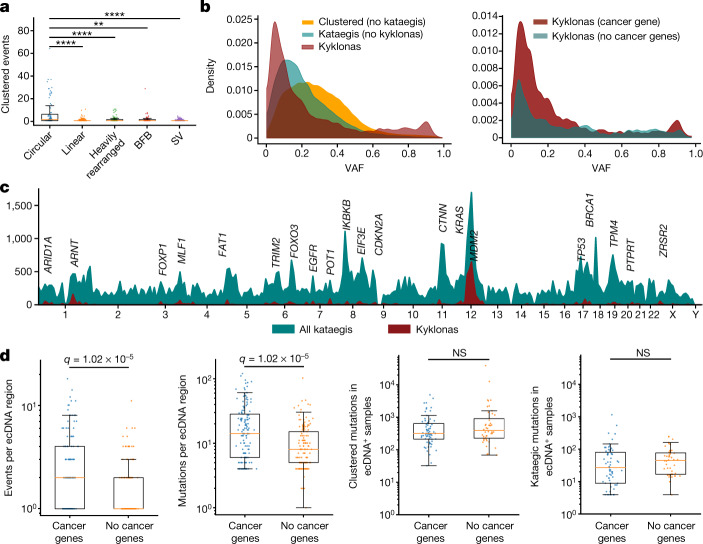
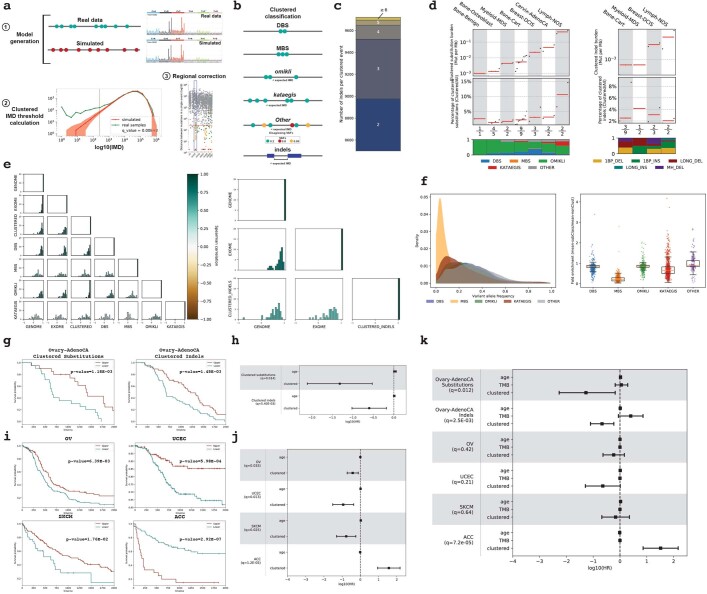
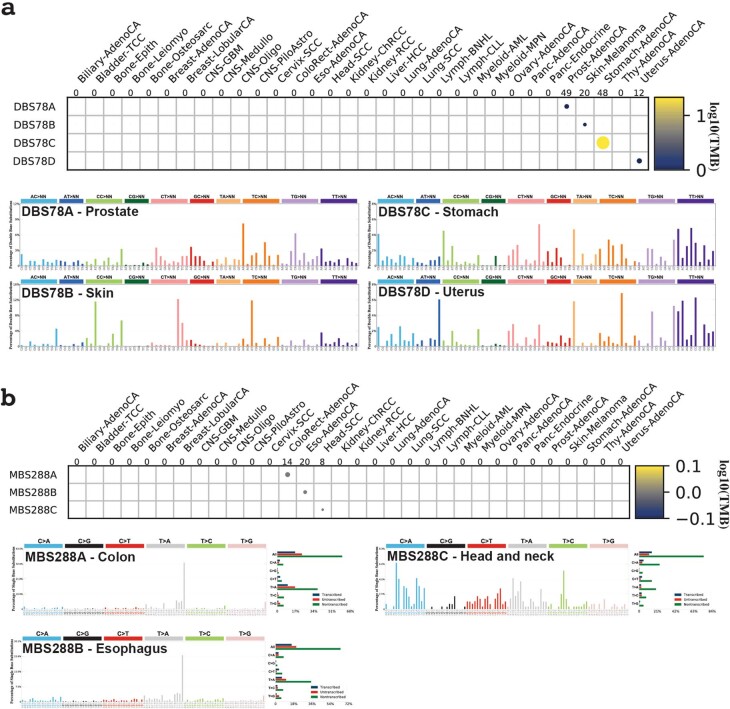
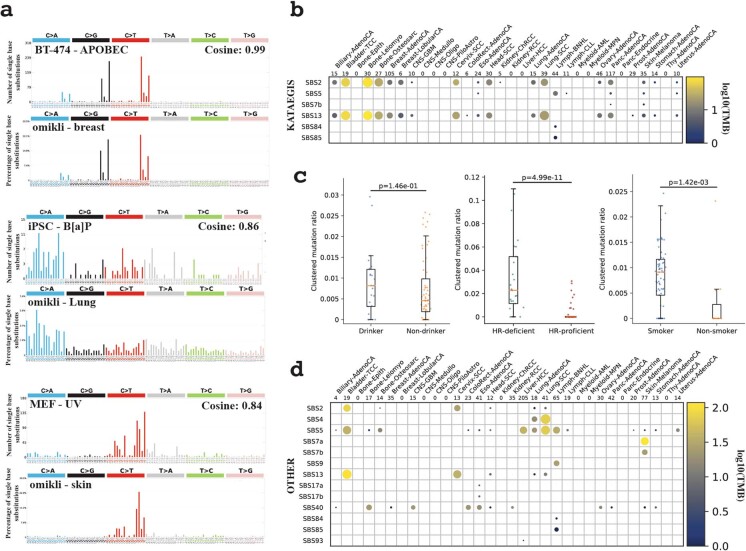
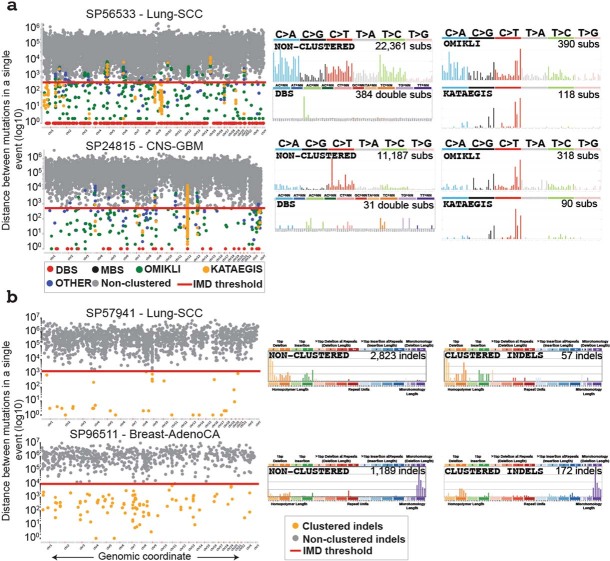
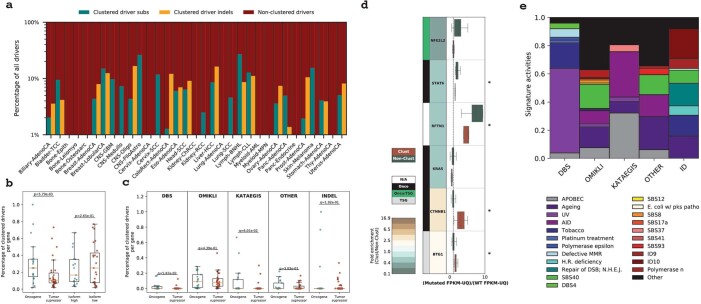
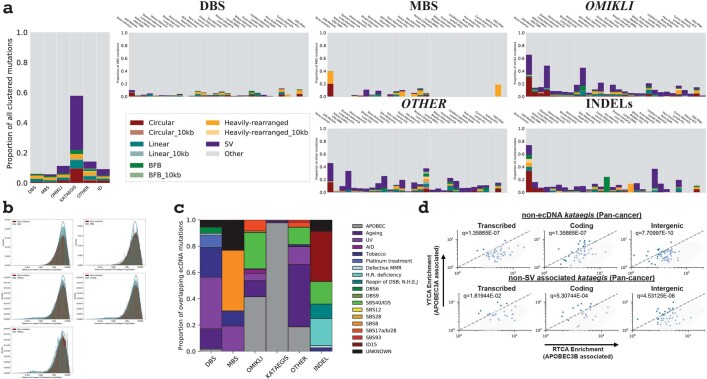
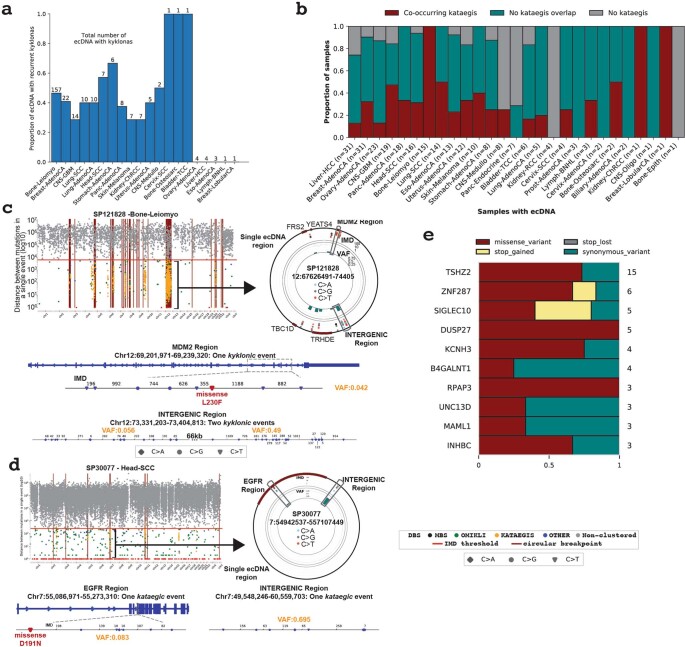
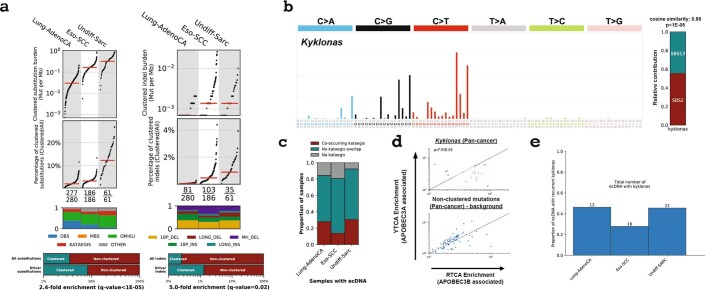
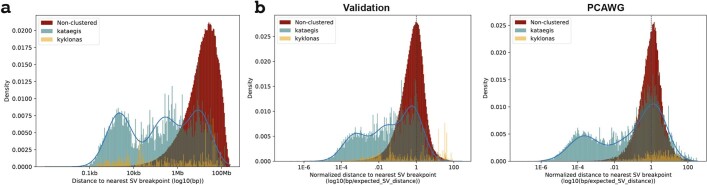
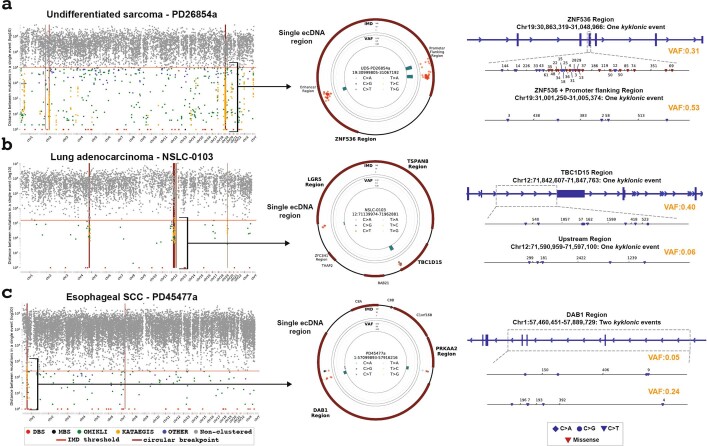
Clustered somatic mutations are common in cancer genomes and previous analyses reveal several types of clustered single-base substitutions, which include doublet- and multi-base substitutions1-5, diffuse hypermutation termed omikli6, and longer strand-coordinated events termed kataegis3,7-9. Here we provide a comprehensive characterization of clustered substitutions and clustered small insertions and deletions (indels) across 2,583 whole-genome-sequenced cancers from 30 types of cancer10. Clustered mutations were highly enriched in driver genes and associated with differential gene expression and changes in overall survival. Several distinct mutational processes gave rise to clustered indels, including signatures that were enriched in tobacco smokers and homologous-recombination-deficient cancers. Doublet-base substitutions were caused by at least 12 mutational processes, whereas most multi-base substitutions were generated by either tobacco smoking or exposure to ultraviolet light. Omikli events, which have previously been attributed to APOBEC3 activity6, accounted for a large proportion of clustered substitutions; however, only 16.2% of omikli matched APOBEC3 patterns. Kataegis was generated by multiple mutational processes, and 76.1% of all kataegic events exhibited mutational patterns that are associated with the activation-induced deaminase (AID) and APOBEC3 family of deaminases. Co-occurrence of APOBEC3 kataegis and extrachromosomal DNA (ecDNA), termed kyklonas (Greek for cyclone), was found in 31% of samples with ecDNA. Multiple distinct kyklonic events were observed on most mutated ecDNA. ecDNA containing known cancer genes exhibited both positive selection and kyklonic hypermutation. Our results reveal the diversity of clustered mutational processes in human cancer and the role of APOBEC3 in recurrently mutating and fuelling the evolution of ecDNA.


Conflict of interest statement

M.P. is a shareholder in Vertex Pharmaceuticals. V.B. is a co-founder, consultant and Scientific Advisory Board member of, and has equity interest in, Boundless Bio, and Abterra. The terms of this arrangement have been reviewed and approved by the University of California San Diego in accordance with its conflict-of-interest policies. E.N.B. and L.B.A. declare filing a provisional patent application for using clustered mutations as clinical prognostic biomarkers in cancer. P.S.M. is a co-founder of Boundless Bio. He has equity in the company and he chairs the Scientific Advisory Board, for which he is compensated. L.B.A. is an inventor on US patent no. 10,776,718 for source identification by non-negative matrix factorization. All other authors declare no competing interests.

Figures

Fig. 1
Fig. 1. The landscape of clustered mutations across human cancer.
a, Pan-cancer distribution of clustered substitutions subclassified into DBSs, MBSs, omikli, kataegis and other clustered mutations. Top, each black dot represents a single cancer genome. Red bars reflect the median clustered TMB (mutations (mut) per Mb) for cancer types. Middle, the clustered TMB normalized to the genome-wide TMB reflecting the contribution of clustered mutations to the overall TMB of a given sample. Red bars reflect the median contribution for cancer types. Bottom, the proportion of each subclass of clustered events for a given cancer type with the total number of samples having at least a single clustered event over the total number of samples within a given cancer cohort. b, Pan-cancer distribution of clustered small indels. The top and middle panels have the same information as a. Bottom, the proportion of each cluster type of indel for a given cancer type with the total number of samples having at least a single clustered indel over the total number of samples within a given cancer cohort. All 2,583 whole-genome-sequenced samples from PCAWG are included in the analysis; however, cancers with fewer than 10 samples were removed from the main figure and included in Extended Data Fig. 1d. For definitions of abbreviations for cancer types used in the figures, see 'Cancer-type abbreviations' in Methods.
Fig. 2
Fig. 2. Mutational processes that underlie clustered events.
Each circle represents the activity of a signature for a given cancer type. The radius of the circle determines the proportion of samples with greater than a given number of mutations specific to each subclass; the colour reflects the median number of mutations per cancer type. A minimum of two samples are required per cancer type for visualization (Methods).
Fig. 3
Fig. 3. Panorama of clustered driver mutations in human cancer.
a, b, Percentage of clustered mutations (top) compared to the percentage of clustered driver events (bottom) for substitutions (a) and indels (b). c, The frequency of clustered driver events across known cancer genes. The radius of the circle is proportional to the number of samples with a clustered driver mutation within a gene; the colour reflects the clustered mutational burden. All clustered driver events are classified into one of the five clustered classes, with the number of clustered driver substitutions and the total number of driver substitutions shown on the right. d, Clustered indel drivers are shown in a similar manner to c. e, The odds ratio of clustered substitutions (top) and indels (bottom) resulting in deleterious (n = 192 clustered substitutions; n = 54 clustered indels) or synonymous changes (n = 5 clustered substitutions; n = 5 clustered indels) within a given driver gene compared to non-clustered driver mutations (n = 771 deleterious and n = 237 synonymous substitutions; n = 111 deleterious and n = 50 synonymous indels). All events were overlapped with the PCAWG consensus list of driver events and were annotated using the ENSEMBL Variant Effect Predictor (VEP). The odds ratios are shown with their 95% confidence intervals. f, Kaplan–Meier survival curves comparing the outcome of samples with clustered versus non-clustered mutations in BRAF (top), TP53 (middle) and EGFR (bottom) across TCGA cohorts. Only cohorts with more than five samples containing a clustered mutation within the given gene were included. g, Kaplan–Meier survival curves comparing the outcome of samples with clustered versus non-clustered mutations in the same genes across the MSK-IMPACT cohort. The log10-transformed hazards ratios (log10(HR)) are shown with their 95% confidence intervals in f, g. Cox regressions were corrected for age (TCGA only), mutational burden and cancer type (Methods). Q values in a, b, e were calculated using a two-tailed Fisher’s exact test and corrected for multiple hypothesis testing.
Fig. 4
Fig. 4. Kataegic events co-locate with most forms of structural variation.
a, Proportion of all kataegic events per cancer type overlapping different amplifications or structural variations. b, Distance to the nearest breakpoint for all kataegic mutations (teal), kyklonas (gold) and non-clustered mutations (red). Kataegic distances were modelled as a Gaussian mixture with three components (blue line). c, Left, volcano plot depicting samples that are statistically enriched for kyklonas (red; q-values from a false discovery rate (FDR)-corrected z-test; not significant (NS)). Middle left, proportion of samples with ecDNA co-occurring with kataegis. Middle right, mutational spectrum of all kyklonas. Right, proportion of kyklonic events attributed to SBS2 and SBS13. Cosine similarity was calculated between the kyklonic and the reconstructed spectra composed using SBS2 and SBS13 (P value from a Z-score test). d, Rainfall plots illustrating the IMD distribution for a given sample with the genomic locations of ecDNA breakpoints (maroon). e, Top, YTCA versus RTCA enrichments per sample with kyklonas, in which YTCA or RTCA enrichment is suggestive of higher APOBEC3A or APOBEC3B activity, respectively. Genic mutations were divided into transcribed (template strand) and coding mutations. The RTCA/YTCA fold enrichments were compared to those of non-clustered mutations (bottom). f, Relative expression of APOBEC3A and APOBEC3B in samples containing ecDNA (n = 157) compared to samples without ecDNA (n = 1,364) (left), and in samples with ecDNA that have kyklonas (n = 59) compared to samples without kyklonas (n = 98) (right). Expression values were normalized using fragments per kilobase of exon per million mapped fragment (FPKM) and upper quartile (UQ) normalization obtained from the PCAWG release. Q values in e, f were calculated using a two-tailed Mann–Whitney U-test and FDR corrected using the Benjamini–Hochberg procedure. For box plots, the middle line reflects the median, the lower and upper bounds of the box correspond to the first and third quartiles, and the lower and upper whiskers extend from the box by 1.5× the interquartile range.
Fig. 5
Fig. 5. Recurrent APOBEC3 hypermutation of ecDNA.
a, Number of clustered events overlapping a single amplicon or SV event; each dot represents an amplicon or SV (n = 84 circular; n = 275 linear; n = 111 heavily rearranged; n = 62 BFB; and n = 11,139 SV). A 10-kb window was used to determine the co-occurrence of kataegis with SV breakpoints (**q < 0.01, ****q < 0.0001). b, Left, normalized distributions of the VAFs for all clustered mutations excluding kataegis (orange), all non-ecDNA kataegis (teal), and kyklonas (red). Right, normalized VAF distributions for kyklonic ecDNA containing cancer genes and for kyklonic ecDNA without cancer genes. c, Frequency of recurrence for all kataegis (teal) and kyklonas (red) using a sliding genomic window of 10 Mb. d, Number of kyklonic events and kyklonic mutations per ecDNA region containing cancer genes (n = 137) or without cancer genes (n = 134; left and right, respectively). e, Total number of clustered and kataegic mutations found in samples with ecDNAs containing cancer genes (n = 67 samples) compared to samples with ecDNAs without cancer genes (n = 44; left and right, respectively). Q values in a, d, e were calculated using a two-tailed Mann–Whitney U-test and FDR-corrected using the Benjamini–Hochberg procedure. Box plot parameters as in Fig. 4.
Extended Data Fig. 1
Extended Data Fig. 1. Identification and clinical associations of clustered events.
a, Schematic depiction for separating clustered mutations for a sample. b, Subclassification of clustered substitutions and indels. Expected IMD derived using steps 2 and 3 (a). c, Distribution of indels present in a single clustered event. d, Distribution of clustered substitutions (left) and indels (right) across cancers with less than 10 samples subclassified into different categories. e, Correlations between TMB of each sample, the TMB within the exome, or the TMB for each class of clustered substitutions (left) and indels (right). f, Distribution of VAFs for all clustered substitution classes (left; DBS: 1,215 samples; MBS: 851; omikli:1,466; kataegis: 1,108; other: 335) with the average fold enrichment compared against non-clustered mutations (right). For each boxplot, the middle line reflects the median, the lower and upper bounds correspond to the first and third quartiles, and the lower and upper whiskers extend from the box by 1.5x the inter-quartile range (IQR). g, Kaplan–Meier curves between samples with high (top 80th percentile) and low (bottom 20th percentile) clustered substitution (left) or indel (right) burdens in PCAWG ovarian cancer. h, Cox regressions performed for PCAWG cancer types while correcting for age (n = 20 upper and n = 21 lower clustered substitutions; n = 49 upper and n = 49 lower clustered indels). i, Kaplan–Meier survival curves for TCGA cancer types with a differential patient outcome associated with the detection of any clustered mutations. j, k, Cox regressions performed for TCGA samples while correcting for age (j) and total mutational burden (k) (OV: n = 111 upper, n = 159 lower clustered substitutions; UCEC: n = 322 upper, n = 64 lower; ACC: n = 24 upper, n = 67 lower). PCAWG ovarian cancers were included in k. Centre of measure for each Cox regression reflects the log10(Hazards ratios) with the 95% confidence intervals in hk).
Extended Data Fig. 2
Extended Data Fig. 2. De novo signatures of DBS and MBS signatures.
a, The activity of DBS de novo signatures (top) and the corresponding signatures extracted from prostate, skin, stomach, and uterine cancers that could not be accurately reconstructed using known COSMIC mutational signatures (bottom; Methods). b, The activity of MBS de novo signatures (top) and the corresponding signatures extracted from colon, oesophagus, and head and neck cancers that could not be accurately reconstructed using known COSMIC mutational signatures (bottom; Methods).
Extended Data Fig. 3
Extended Data Fig. 3. Experimental validation and epidemiological associations of clustered mutational processes.
a, Experimental validation of three omikli processes. Specifically, APOBEC3-associated omikli were validated using a clonally expanded BT-474 breast cancer cell line (top), omikli events resulting from exposure to benzo[a]pyrene were validated using iPS cells (middle), and omikli events resulting from exposure to ultraviolet light were validated using iPS cells (bottom). b, Mutational processes of strand-coordinated kataegic events. c, Epidemiological associations comparing the ratio of clustered TMB to the total TMB for a given sample between: drinkers (n = 25) and non-drinkers (n = 61); smokers (n = 68) and non-smokers (n = 11); homologous-recombination deficient (HR-deficient; n = 25) and homologous-recombination proficient samples (HR-proficient; n = 64). For each boxplot, the middle line reflects the median, the lower and upper bounds of the box correspond to the first and third quartiles, and the lower and upper whiskers extend from the box by 1.5x the inter-quartile range (IQR). P-values were calculated using a two-tailed Mann–Whitney U-test. d, Mutational processes of clustered events with inconsistent VAFs classified as other clustered substitutions. A minimum of two samples are required per cancer type for visualization (Methods).
Extended Data Fig. 4
Extended Data Fig. 4. Examples of clustered mutational signatures.
a, Two samples depicting the intra-mutational distance (IMD) distributions of substitutions across genomic coordinates, where each dot represents the minimum distance to adjacent mutations for a selected mutation coloured based on the corresponding subclassification of event (rainfall plot; left). The red lines depict the sample-dependent IMD threshold for each sample. Specific clustered mutations may be above this threshold based on corrections for regional mutation density. The mutational spectra for the different catalogues of clustered and non-clustered substitutions for each sample (right; MBS are not shown). b, Two samples illustrating the IMD distributions of indels across the given genomes, with the IMD indel thresholds shown in red (left). The non-clustered and clustered indel catalogues for each sample (right).
Extended Data Fig. 5
Extended Data Fig. 5. Mutational processes of clustered driver events.
a, The percentage of clustered driver substitutions and indels within each cancer type. All samples 2,583 whole-genome sequenced samples from PCAWG with a detected driver event are included; however, cancer types with fewer than 10 samples are not presented. b, The proportion of clustered driver mutations per cancer gene compared between oncogenes (n = 19 genes) versus tumour suppressor genes (n = 30 genes) and genes with high numbers of isoforms (n = 17) versus genes with low numbers of isoforms (n = 23; upper and lower quartiles of isoforms across all cancer drivers). c, The proportion of clustered driver mutations for a given subclass per cancer gene compared between oncogenes (n = 17 genes with clustered substitutions and n = 13 with for clustered indels) versus tumour suppressor genes (n = 28 genes with clustered substitutions and n = 70 genes with clustered indels). d, The relative expression of driver genes containing clustered (copper) versus non-clustered events (green). All expression values were normalized using FPKM normalization and upper quartile normalization obtained from the official PCAWG release and were subsequently normalized using the average expression of the wild-type gene. A value of 1 (dashed lined) reflects no difference in expression compared to the wild-type gene. e, The proportional activity of mutational signatures contributing to clustered driver events within each subclass. MBSs did not contribute to any reported driver events. For analyses in bd, p-values were generated using a two-tailed Mann–Whitney U-test (*P < 0.05; p = 0.03 for STAT6; p = 0.04 for CTNNB1; p = 0.02 for BTG1). For each boxplot, the middle line reflects the median, the lower and upper bounds of the box correspond to the first and third quartiles, and the lower and upper whiskers extend from the box by 1.5x the inter-quartile range (IQR).
Extended Data Fig. 6
Extended Data Fig. 6. Clustered events and structural variations.
a, The proportion of all clustered events co-locating with structural variations across all cancer types (left) and across each cancer type (right). b, The distance to the nearest structural variation for each class of clustered mutations (teal), and non-clustered mutations (red). The distribution for each class of clustered events were modelled using a Gaussian mixture (blue line). DBSs and MBSs were modelled using a single distribution, whereas omikli, other, and indels were modelled using two components reflecting the minimal distribution of overlap with structural variations. c, The mutational signatures active in ecDNA clustered events. d, YTCA versus RTCA enrichments per sample within non-ecDNA kataegis (top) and non-SV associated kataegis (bottom), where YTCA and RTCA enrichment is suggestive of APOBEC3A or APOBEC3B activity, respectively. Genic mutations were divided into transcribed (template strand) and coding mutations. The RTCA/YTCA fold enrichments were compared to the fold enrichments of non-clustered mutations (p-values calculated using two-tailed Mann–Whitney U-tests and corrected for multiple hypothesis testing using the Benjamini–Hochberg FDR procedure).
Extended Data Fig. 7
Extended Data Fig. 7. Recurrent mutagenesis and functional effects of kyklonas.
a, The total number of recurrently mutated ecDNA displayed as a proportion of the total number of ecDNA with kyklonas for a given cancer type. The total number of ecDNA with kyklonas are displayed above each bar plot for each cancer type. All ecDNA with recurrent hypermutation were considered enriched for kyklonic events after correcting for multiple hypothesis testing (Z-score test; q-values < 0.05). b, Proportion of samples containing ecDNA divided exclusively into those with co-occurring kataegis, no kataegis overlap, and no detected kataegis across the entire genome. The number of samples included in each cancer type are listed. For certain cancer types, as few as a single sample may represent the entire proportional breakdown (for example, Bone-Osteosarc or Bone-Epith). c, A single sarcoma genome and d, a single head squamous cell carcinoma genome depicting the overlap of kataegis with ecDNA regions displayed as a rainfall (top left) with a single zoomed in ecDNA represented using a circos plot (top right). Bottom: Two regions of the ecDNA with overlapping kyklonic events. VAFs are shown per event (orange). e, Kyklonic substitutions resulting in recurrent coding mutations within known cancer genes.
Extended Data Fig. 8
Extended Data Fig. 8. Validation of APOBEC3 hypermutation of ecDNA in three independent cohorts.
a, Distribution of clustered substitutions (left) and clustered indels (right) across three validation cohorts. Clustered substitutions were subclassified into DBSs, MBSs, omikli, kataegis, and other clustered mutations. Top: Each black dot represents a single cancer genome. Red bars reflect the median clustered TMB and the percentage of clustered mutations contributing to the overall TMB of a given sample for each cancer type. Middle: The proportion of each subclass of clustered events for a given cancer type with the total number of samples having at least a single clustered event over the total number of samples within a given cancer cohort. Bottom: Percentage of clustered mutations compared to the percentage of clustered driver events for substitutions (left) and indels (right). P-values were calculated using a Fisher’s exact test and corrected for multiple hypothesis testing using Benjamini–Hochberg FDR procedure. b, Left: The mutational spectrum of all kyklonas across the validation cohorts. Right: The proportion of kyklonic events attributed to SBS2 and SBS13 (p-value determined using a Z-score test; Methods). c, The proportion of samples with ecDNA that co-occur with kataegis, do not co-occur with kataegis, or do not have any detected kataegic activity across each cohort. d, YTCA versus RTCA enrichments per sample with kyklonas, where YTCA and RTCA enrichment is suggestive of higher APOBEC3A or APOBEC3B activity, respectively. The RTCA/YTCA fold enrichments were compared to the fold enrichments of non-clustered mutations (p-values calculated using a two-tailed Mann–Whitney U-test). e, The proportion of ecDNA with kyklonas that contain multiple kyklonic events. The total number of ecDNA with kyklonas are displayed above each bar plot for each cancer type.
Extended Data Fig. 9
Extended Data Fig. 9. Kyklonas occur distally from structural breakpoints across three independent cohorts.
a, The distance to the nearest breakpoint for all kataegic mutations (teal), kyklonas (gold), and non-clustered mutations (red) across the three validation cohorts. b, Distances to the nearest SV breakpoints were normalized by calculating the expected distance a mutation would fall from a breakpoint given the number of breakpoints detected per chromosome and the overall length of the chromosome across the validation cohorts (left) and PCAWG (right). A value of 1 (dashed line) reflects a distance that one would expect based on the random placement of a mutation across the chromosome, whereas a value less than 1 reflects a mutation occurring closer than what is expected by random chance. The distributions of kataegic mutations were modelled using Gaussian mixture models (blue lines) with an automatic selection criterion for the number of components using the minimum Bayesian information criteria (BIC).
Extended Data Fig. 10
Extended Data Fig. 10. Examples of kyklonas in three independent cohorts.
a, A single undifferentiated sarcoma genome depicting the overlap of kataegis with ecDNA regions displayed as a rainfall (left) with a single zoomed in ecDNA represented using a circos plot (middle). The outer track of the circos plot represents the reference genome of the ecDNA with proximal known cancer driver genes. The middle track reflects a circular rainfall plot where each dot represents the IMD around a single mutation coloured based on the substitution change. The innermost track shows the average VAF for each kyklonic event. Right: Two smaller regions of the selected ecDNA including a single kyklonic event within ZNF536 region resulting in a plethora of missense and stop-gained mutations, and a single kyklonic event within a promoter flanking with the average VAFs per event (orange). b, A single lung adenocarcinoma genome depicting the overlap of kataegis with ecDNA regions (left) with a single zoomed in ecDNA containing TBC1D15 and two distinct kyklonic events represented using a circos plot (middle). Right: Two kyklonic events overlapping an upstream region and TBC1D15. c, A single oesophageal squamous cell carcinoma genome depicting the overlap of kataegis with ecDNA regions (left) with a single zoomed in ecDNA containing PRKAA2 and DAB1 and three distinct kyklonic events (middle). Right: Two kyklonic events overlapping DAB1.

References

    1. Alexandrov LB, et al. The repertoire of mutational signatures in human cancer. Nature. 2020;578:94–101. - PMC - PubMed
    1. Matsuda T, Kawanishi M, Yagi T, Matsui S, Takebe H. Specific tandem GG to TT base substitutions induced by acetaldehyde are due to intra-strand crosslinks between adjacent guanine bases. Nucleic Acids Res. 1998;26:1769–1774. - PMC - PubMed
    1. Nik-Zainal S, et al. Mutational processes molding the genomes of 21 breast cancers. Cell. 2012;149:979–993. - PMC - PubMed
    1. de Gruijl FR, van Kranen HJ, Mullenders LH. UV-induced DNA damage, repair, mutations and oncogenic pathways in skin cancer. J. Photochem. Photobiol. B. 2001;63:19–27. - PubMed
    1. Brash DE. UV signature mutations. Photochem. Photobiol. 2015;91:15–26. - PMC - PubMed

Publication types