. 2021 Dec 10;22(2):85-99.
doi: 10.1002/elsc.202100114. eCollection 2022 Feb.

Phenotype analysis of cultivation processes via unsupervised machine learning: Demonstration for Clostridium pasteurianum

Affiliations

Phenotype analysis of cultivation processes via unsupervised machine learning: Demonstration for Clostridium pasteurianum

Yaeseong Hong et al. Eng Life Sci. .

Abstract

A novel approach of phenotype analysis of fermentation-based bioprocesses based on unsupervised learning (clustering) is presented. As a prior identification of phenotypes and conditional interrelations is desired to control fermentation performance, an automated learning method to output reference phenotypes (defined as vector of biomass-specific rates) was developed and the necessary computing process and parameters were assessed. For its demonstration, time series data of 90 Clostridium pasteurianum cultivations were used which feature a broad spectrum of solventogenic and acidogenic phenotypes, while 14 clusters of phenotypic manifestations were identified. The analysis of reference phenotypes showed distinct differences, where potential conditionalities were exemplary isolated. Further, cluster-based balancing of carbon and ATP or the use of reference phenotypes as indicator for bioprocess monitoring were demonstrated to highlight the perks of this approach. Overall, such analysis depends strongly on the quality of the data and experimental validations will be required before conclusions. However, the automated, streamlined and abstracted approach diminishes the need of individual evaluation of all noisy dataset and showed promising results, which could be transferred to strains with comparably wide-ranging phenotypic manifestations or as indicators for repeated bioprocesses with clearly defined target.

Keywords: Clostridium pasteurianum; automated fermentation analysis; phenotype analysis; process monitoring; unsupervised learning.


Conflict of interest statement

The authors have declared no conflict of interests.

Figures
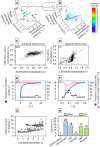
FIGURE 1
FIGURE 1
Vector display of fermentation data with utilized distance metrics, impact of z‐score normalization, influence of clustering parameters and computed number of optimal clusters using different criteria. (A and B) For a simplified example of three dimensions (growth rate, specific 1,3‐propanediol production rate, specific glycerol consumption rate) the vector display is shown for squared Euclidean distance (SED) and cosine distance (CD). Each point/vector at,p represents the phenotypic manifestation during a cultivation experiment, which is used for clustering. For computing clusters, SED as atr,pats,p22 between exemplary points at tr and ts or CD based on the angle θ between both vectors are used. (C and D) Valuation of distances to the mean of all data depending on the sample standard deviation via z‐score normalization for SED and CD, respectively. All distances above the reference lines represent distances that are weighted higher through consideration of sample standard deviation and vice‐versa. (E and F) Number of identified cluster and the clustering properties for Density‐based spatial clustering of applications with noise (DBSCAN) are shown for SED and CD, respectively. Proportions of clustered data (non‐noise data) and proportion of data in cluster 1 depicts the quality of DBSCAN. (G) Computed optimal number of clusters using silhouette criterion and CD metric with varying degree of outlier removal of each dimension up to 5th and 95th percentiles. (H) Computed optimal number of clusters using different criterions for CD and SED metric with 3rd and 97th percentiles of outlier removal
FIGURE 2
FIGURE 2
Scatter matrix for k‐means clustering of 90 Clostridium pasteurianum cultivation experiments. For k of 14, k‐means clustering was performed based on cosine distance metric and z‐score normalization. All 11 dimensions (growth rate (μ), specific production or consumption rates of glucose (Glc), glycerol, 1,3‐propanediol (PDO), ethanol (EtOH), butanol (BuOH), lactic acid (LaAc), formic acid (FoAc), acetic acid (AcAc), butyric acid (BuAc) and 2‐oxobutyric acid (OBuAc)) are shown in a scatterplot matrix, where the diagonal shows a histogram of each dimension as number of points with normalized scales. The units are: [h‐1] for growth rate, [mmol g‐1 h‐1] for other rates and [‐] for the diagonal
FIGURE 3
FIGURE 3
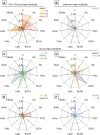
Radar charts of identified clusters of phenotypic manifestations in C. pasteurianum. Normalized centroids of 14 clusters of C. pasteurianum fermentations using cosine distance metric sorted based on the main carbon source. (A) Clusters 1 and 10 utilize glucose (Glc) as major substrate and clusters 12 and 13 utilize Glc and glycerol (Gly), while cluster 10 and 13 showed the highest acetic acid (AcAc) and 1,3‐propanediol (PDO) production rates, respectively; (B) Cluster with 2‐oxobutyric acid (OBuAc) production without apparent Glc or Gly consumption; (C–F) Clusters with Gly as major substrate, further differentiated by the product spectrum. Clusters 3, 7 and 8 (C) show highest production rates of butyric acid (BuOH), formic acid (FoAc) and lactic acid (LaAc), respectively. Highest solventogenesis of ethanol (EtOH) and butanol (BuOH) were found for clusters 4 and 11 (D), respectively. Cluster 5 and 6 (F) showed highest and lowest growth rate (μ), respectively. Clusters 9 and 14 (E) are not characteristic for a single metabolic activity
FIGURE 4
FIGURE 4
Logarithmic deviations of dynamic and general cultivations conditions (clusters 9 and 11) from total dataset. Over‐representation (logarithmic deviation >0) indicate elevated appearance of a specific cluster for a given condition in comparison to the total dataset and vice‐versa for logarithmic deviation <0. (A–C) Logarithmic deviations of cluster appearances depending on dynamic conditions (concentration ranges of cell dry weight, glycerol and butanol, respectively). Logarithmic deviations of (initial) cultivations conditions are shown for following tags: cultivation condition in pH‐uncontrolled serum bottles or bioreactors (D), cultivation employing bioelectrochemical system (BES) (E), initial iron(II) sulfate heptahydrate concentrations (F) and utilization of additives (G)
FIGURE 5
FIGURE 5
Carbon recovery and specific ATP production rates of identified clusters. (A) Carbon recoveries of identified clusters that are calculated from the characteristic sets of specific rates including theoretical carbon dioxide production rate. (B) Plot of specific ATP production rate based on substrate‐level phosphorylation against specific growth rate and linear fit excluding clusters with carbon recoveries over 19% discrepancy. Cluster 2 constitutes an exception, since no identified substrate uptake was found disabling calculation of carbon recovery and specific ATP production rate
FIGURE 6
FIGURE 6
Superposition‐based approximation of batch cultivation of C. pasteurianum. (A) Time course of cell dry weight of the batch fermentation and residual sum of squares (RSS) of the non‐negative least square fitting of cluster‐based approximation. (B) Proportions of identified clusters as superposition‐based non‐negative least square fitting of all identified 14 clusters that describe dynamic states of phenotypic manifestation as summed composition

References

    1. Jordan, M. I. , Mitchell, T. M. , Machine learning: Trends, perspectives, and prospects. Science 2015, 349, 255–260. - PubMed
    1. Kumar, Y. , Kaur, K. , Singh, G. , Machine learning aspects and its applications towards different research areas, 2020 International Conference on Computation, Automation and Knowledge Management (ICCAKM), Dubai, United Arab Emirates, 09.01.2020 ‐ 10.01.2020, IEEE, 2020, pp. 150–156.
    1. Volk, M. J. , Lourentzou, I. , Mishra, S. , Vo, L. T. , et al. Biosystems design by machine learning. ACS Synth. Biol. 2020, 9, 1514–1533. - PubMed
    1. Wu, J. , Zhao, Y. , Machine learning technology in the application of genome analysis: A systematic review. Gene 2019, 705, 149–156. - PubMed
    1. Libbrecht, M. W. , Noble, W. S. , Machine learning applications in genetics and genomics. Nat. Rev. Genet. 2015, 16, 321–332. - PMC - PubMed

LinkOut - more resources