. 2022 Jan 24:15:785276.
doi: 10.3389/fnins.2021.785276. eCollection 2021.

Systematic Phenotyping and Characterization of the 3xTg-AD Mouse Model of Alzheimer's Disease

Affiliations

Systematic Phenotyping and Characterization of the 3xTg-AD Mouse Model of Alzheimer's Disease

Dominic I Javonillo et al. Front Neurosci. .

Abstract

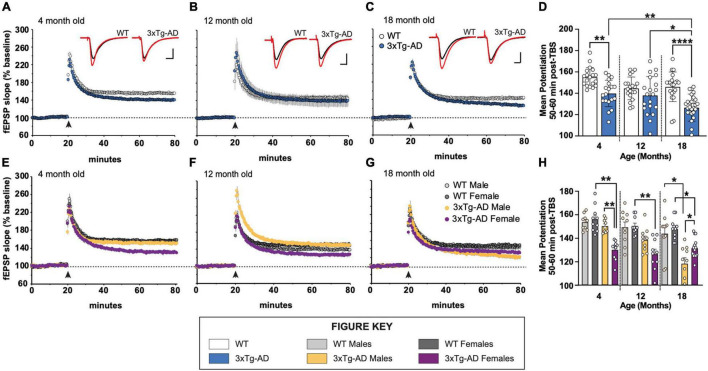
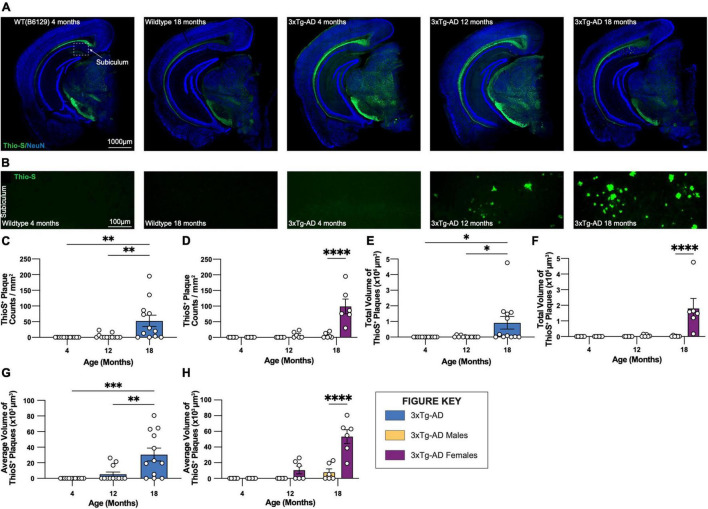
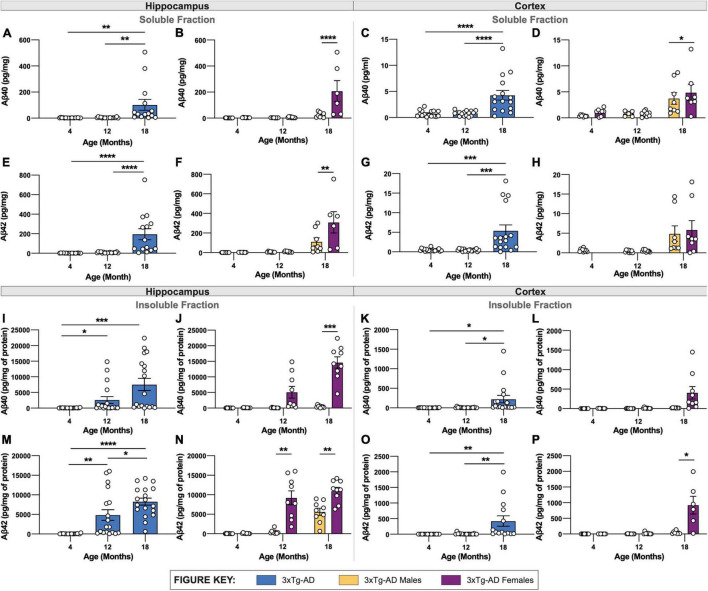
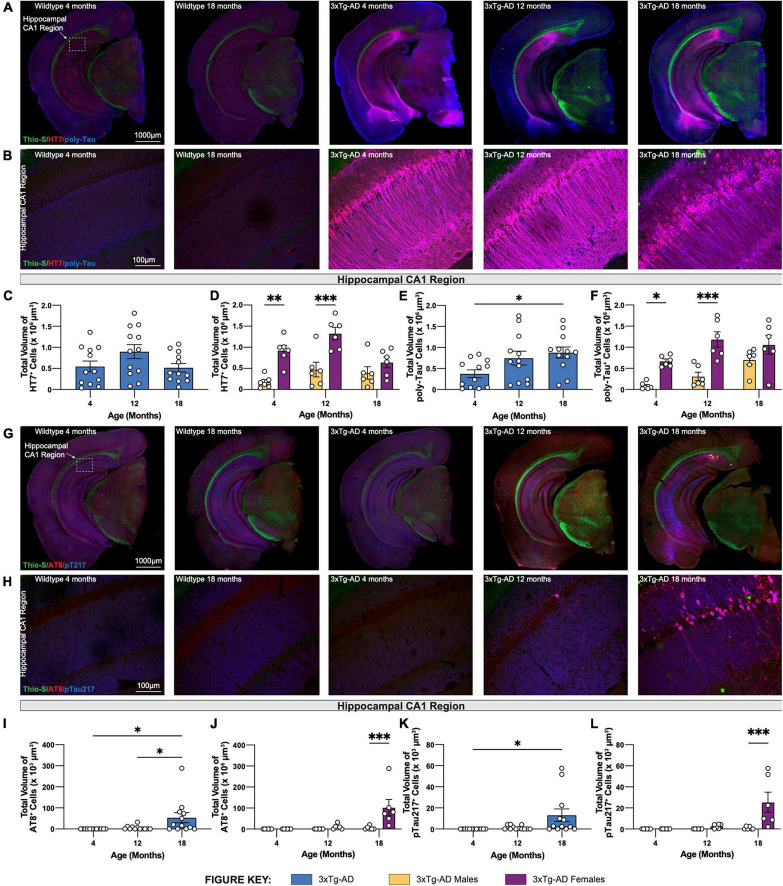
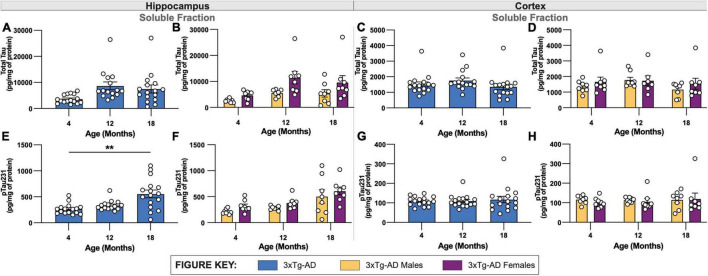
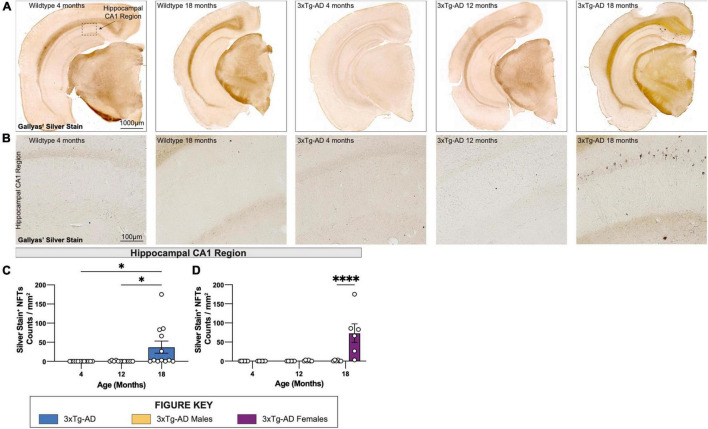
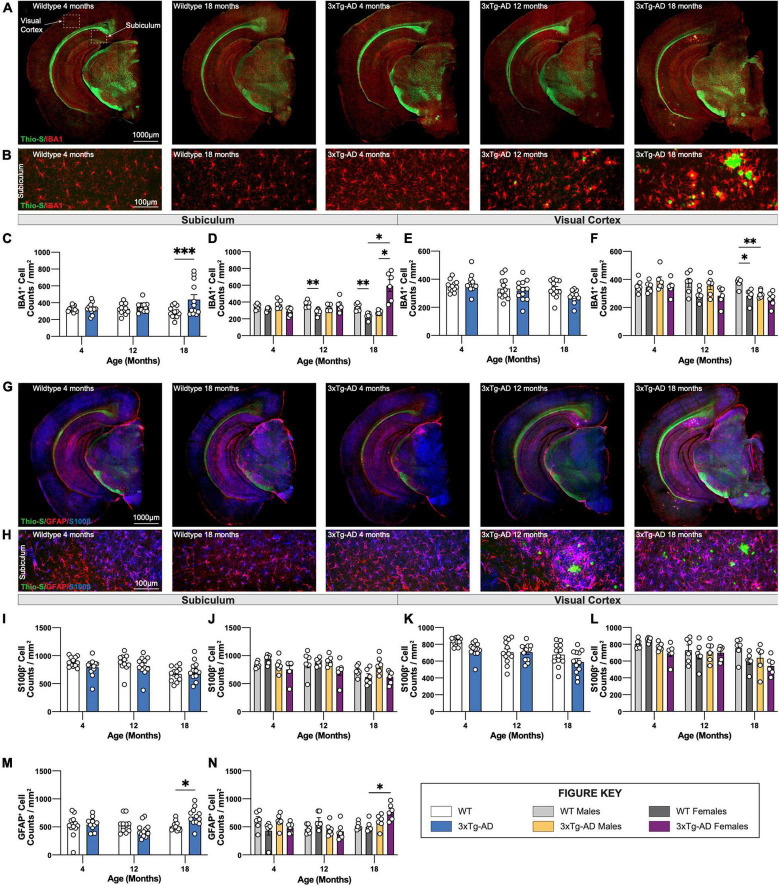
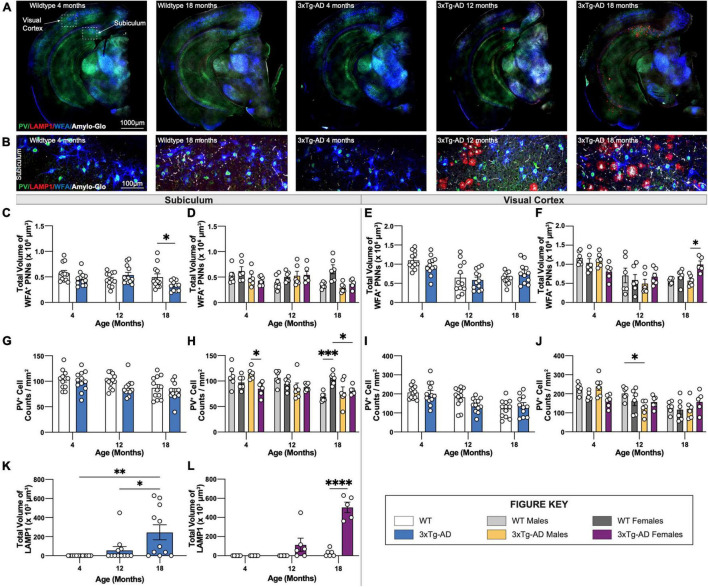
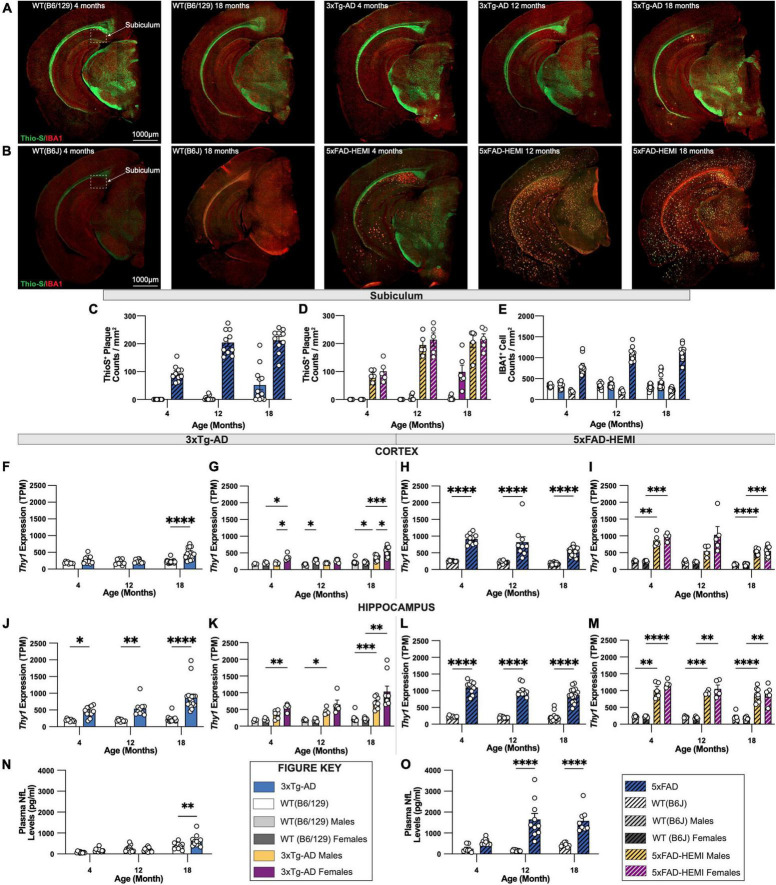
Animal models of disease are valuable resources for investigating pathogenic mechanisms and potential therapeutic interventions. However, for complex disorders such as Alzheimer's disease (AD), the generation and availability of innumerous distinct animal models present unique challenges to AD researchers and hinder the success of useful therapies. Here, we conducted an in-depth analysis of the 3xTg-AD mouse model of AD across its lifespan to better inform the field of the various pathologies that appear at specific ages, and comment on drift that has occurred in the development of pathology in this line since its development 20 years ago. This modern characterization of the 3xTg-AD model includes an assessment of impairments in long-term potentiation followed by quantification of amyloid beta (Aβ) plaque burden and neurofibrillary tau tangles, biochemical levels of Aβ and tau protein, and neuropathological markers such as gliosis and accumulation of dystrophic neurites. We also present a novel comparison of the 3xTg-AD model with the 5xFAD model using the same deep-phenotyping characterization pipeline and show plasma NfL is strongly driven by plaque burden. The results from these analyses are freely available via the AD Knowledge Portal (https://modeladexplorer.org/). Our work demonstrates the utility of a characterization pipeline that generates robust and standardized information relevant to investigating and comparing disease etiologies of current and future models of AD.

Keywords: 3xTg-AD; Alzheimer’s disease; amyloid precursor protein; amyloid β-protein; animal model; genetically modified; neurofibrillary tangles; tau.


Conflict of interest statement

The authors declare that the research was conducted in the absence of any commercial or financial relationships that could be construed as a potential conflict of interest.

Figures

FIGURE 1
FIGURE 1
Long-term potentiation (LTP) impairments in 3xTg-AD mice at ages 4, 12, and 18 months in a sex-dependent manner. (A–C,E–G) Hippocampal slices were collected from 4-, 12-, and 18-month-old (mo) male and female WT and 3xTg-AD mice and were used to measure LTP in the stratum radiatum in area CA1. Following a 20 min stable recording of field excitatory postsynaptic potentials (fEPSP), LTP was induced by applying five theta bursts (black arrow: each burst containing four 100 Hz pulses with each burst separated by 200 ms) and recording of baseline stimulation was resumed for an additional 60 min. (D,H) fEPSP potentiation averaged during the last 10 min of recording in slices from male and female WT and 3xTg-AD mice at ages 4, 12, and 18 mo. *p < 0.05, **p < 0.005, ****p < 0.0001.
FIGURE 2
FIGURE 2
Fibrillar amyloid plaques increase in size and number in 18-month-old female 3xTg-AD mice. 3xTg-AD plaque burden was assessed with Thioflavin-S staining at each time point. (A) Representative stitched brain hemispheres of WT and 3xTg-AD mice shown with Thio-S staining at 4- and 18-month, and 4-, 12-, and 18-month timepoints, respectively, counterstained with NeuN. (B) Representative confocal images of Thio-S+ plaques in subiculum hippocampal regions of WT and 3xTg-AD mice across timepoints displaying increased number of fibrillar amyloid plaques. (C,D) Quantification for density of Thio-S+ plaques in the subiculum hippocampal region per square millimeter by genotype and sex. (E,F) Quantification of total volume of Thio-S+ plaques by genotype and sex demonstrating age- and genotype-associated increases in total volume of plaques. (G,H) Quantification of average volume of Thio-S+ plaques showing an increase in the average volume of a plaque related to age and genotype. n = 6 mice per genotype/age/sex. Data are represented as mean ± SEM. *p ≤ 0.05, **p ≤ 0.01, ***p ≤ 0.001, ****p ≤ 0.0001.
FIGURE 3
FIGURE 3
Quantification of Aβ isoforms in 3xTg-AD mice of different age and sex. Aβ was quantified in micro-dissected hippocampi and cortices via Mesoscale Multiplex technology. (A–H) Aβ40 and Aβ42 were measured in the soluble fraction of hippocampus (A,B,E,F) and cortex (C,D,G,H), respectively, with age-related increases in Aβ40 and Aβ42 shown in hippocampus and cortex of 3xTg-AD mice between sexes. (I–P) An age-related increase in insoluble Aβ40 and Aβ42 was also observed in hippocampus (I,J,M,N) and cortex (K,L,O,P) of 3xTg-AD mice between sexes. n = 5–6 mice per genotype/age/sex. Data are represented as mean ± SEM. *p ≤ 0.05, **p ≤ 0.01, ***p ≤ 0.001, ****p ≤ 0.0001.
FIGURE 4
FIGURE 4
Phosphorylated tau increases in volume in 18-month-old female 3xTg-AD mice. Accumulation of human tau was assessed by immunostaining using HT7 and poly-tau antibody, while phosphorylated tau was assessed using AT8 and phospho-Tau Thr 217 antibody, respectively. (A) Representative stitched brain hemispheres of WT and 3xTg-AD mice stained with Thio-S/HT7/poly-tau at 4- and 18-month and 4-, 12-, and 18-month timepoints, respectively. (B) Representative confocal images of HT7+ and poly-tau+ cells in the hippocampal CA1 regions of WT and 3xTg-AD mice across respective timepoints. (C,D) HT7 immunostaining reveals age-related changes in total volume of HT7+ cells in 3xTgAD mice between sexes. (E,F) Poly-tau immunostaining reveals age-related changes in total volume of poly-tau+ cells in 3xTg-AD mice between sexes. (G) Representative stitched brain hemispheres of WT and 3xTg-AD mice stained with Thio-S/AT8/pT217 at 4- and 18-month and 4-, 12-, and 18-month timepoints, respectively. (H) Representative confocal images of AT8+ and Thr217+ cells in the hippocampal CA1 regions of WT and 3xTg-AD mice across respective timepoints. (I,J) AT8 immunostaining reveals age-related changes in total volume of AT8+ cells in 3xTg-AD mice between sexes. (K,L) Thr217 immunostaining reveals age-related changes in total volume of Thr217+ cells in 3xTg-AD mice between sexes. n = 5–6 mice per genotype/age/sex. Data are represented as mean ± SEM. *p ≤ 0.05, **p ≤ 0.01, ***p ≤ 0.001.
FIGURE 5
FIGURE 5
Quantification of total tau and phosphorylated tau in 3xTg-AD mice of different ages and sexes. Levels of total tau and phosphorylated tau were quantified in micro-dissected hippocampi and cortices using Mesoscale Multiplex technology. (A–D) Total tau was measured in the soluble fraction of hippocampus (A,B) and cortex (C,D), respectively, with no significant differences found between age or sex in either brain regions of 3xTg-AD. (E–H) Levels of phosphorylated tau 231 (pTau231) significantly increased with age specifically in soluble fractions of hippocampus (E,F) but not cortex (G,H) of 3xTg-AD mice. Differences in pTau231 levels were not seen between sexes. n = 5–6 mice per genotype/age/sex. Data are represented as mean ± SEM. **p ≤ 0.01.
FIGURE 6
FIGURE 6
Neurofibrillary tangles increase in number in 18-month-old female 3xTg-AD mice. Accumulation of neurofibrillary tangles (NFTs) was assessed using Gallyas’ silver staining method at each timepoint. (A) Representative stitched brain hemispheres of WT and 3xTg-AD mice at 4- and 18-month, and 4-, 12-, and 18-month timepoints, respectively. (B) Representative brightfield images of silver stained NFTs in hippocampal CA1 regions of WT and 3xTg-AD mice across each timepoint showing progressive accumulation of NFTs. (C,D) Quantification for density of silver stained NFTs in hippocampal CA1 regions per square millimeter by genotype and sex. n = 6 mice per genotype/age/sex. Data are represented as mean ± SEM. *p ≤ 0.05, ****p ≤ 0.0001.
FIGURE 7
FIGURE 7
Immunostaining of microglia and astrocytes. Brains of mice at each timepoint were coronally sectioned and immunostained for IBA1, GFAP, and S100β to identify changes in microglia or astrocytes. (A) Representative stitched images of brain hemispheres of WT (4-, 18-month) and 3xTg-AD mice (4-, 12-, 18-month) stained with Thio-S/IBA1. (B) Representative images of IBA1+ cells surrounding Thio-S+ in subiculum hippocampal regions of WT and 3xTg-AD mice at indicated timepoints. (C–F) Age-related changes microglial density in both WT and 3xTg-AD, and differences between genotypes in subiculum hippocampal and cortical regions. (G) Representative images of brain hemispheres of WT (4-, 18-month) and 3xTg-AD mice (4-, 12-, 18-month) stained with Thio-S/GFAP/S100β. (H) Representative images of GFAP+ and S100β+ cells surrounding Thio-S+ plaques in subiculum hippocampal regions of WT and 3xTg-AD mice at indicated timepoints. (I–N) Astrocyte density as assessed via S100β (I–L) and GFAP (M,N) staining in the subiculum hippocampal and cortical regions. Age-related changes in both WT and 3xTg-AD astrocytic density, and differences between genotypes in both subiculum hippocampal and cortical regions. n = 5–6 mice per genotype/age/sex. Data are represented as mean ± SEM. *p ≤ 0.05, **p ≤ 0.01, ***p ≤ 0.001.
FIGURE 8
FIGURE 8
PNN and LAMP1. Perineuronal nets (PNNs) and parvalbumin (PV) interneurons were assessed with immunostaining using WFA and PV antibody, while lysosomes were assessed with immunostaining using LAMP1 antibody. (A) Representative images of WT (4-, 18-month) and 3xTg-AD mice (4-, 12-, 18-month) stained with PV/LAMP1/WFA/Amylo-Glo. (B) Representative images of WFA+ PNNs surrounding PV+ neurons around LAMP1+ lysosomes in subiculum hippocampal regions of WT and 3xTg-AD mice across respective timepoints. (C–F) Age-related change in total volume of WFA+ PNNs in 3xTg-AD mice. (G–J) Immunostaining for PV+ neurons demonstrate age-related changes in the density of PV+ neurons in both WT and 3xTg-AD mice, and differences between genotypes in subiculum and cortical regions. n = 5–6 mice per genotype/age/sex. (K,L) LAMP1 immunostaining reveals age- and sex-associated increases in the total volume of LAMP1+ lysosomes in the subiculum brain region of 3xTg-AD mice. n = 6 mice per genotype/age/sex. Data are represented as mean ± SEM. *p ≤ 0.05, **p ≤ 0.01, ***p ≤ 0.001, ****p ≤ 0.0001.
FIGURE 9
FIGURE 9
Comparison of fibrillar amyloid plaque accumulation in 3xTg-AD and 5xFAD mice. (A) Representative images of brain hemispheres of WT(B6;129) at 4- and 18-month and 3xTg-AD mice at 4-, 12-, 18-month stained with Thio-S/IBA1. (B) Representative stitched brain hemispheres of WT(B6J) at 4- and 18-month and hemizygous 5xFAD mice at 4-, 12-, 18-month stained with Thio-S/IBA1. (C,D) Quantification for density of Thio-S+ plaques in subiculum hippocampal regions in 3xTg-AD and 5xFAD mice showed differences in plaque burden between mouse models and sexes. (E) Quantification for IBA1 immunostaining for microglia in subiculum hippocampal regions reveals age-related differences between mouse models. (F,G) TPM values for Thy1 expression in micro-dissected cortical lysates revealed an age-associated increase in 3xTg-AD, as well as sex-differences driven by female mice. (H,I) TPM values for Thy1 expression in micro-dissected cortical lysates in 5xFAD mice displays a significant increase compared to B6J wildtype mice, yet no sex differences were observed. (J,K) TPM values for Thy1 expression in micro-dissected hippocampal lysates demonstrate higher Thy1 expression in 4-, 12-, and 18-month-old 3xTg-AD mice. (L,M) TPM values for Thy1 expression in micro-dissected hippocampal lysates display a similar increase in Thy1 expression compared to B6J wildtype controls with no sex differences within groups. (N,O) Quantification of neurofilament-light chain (NfL) levels of plasma from 3xTg-AD and 5xFAD using Mesoscale Singleplex technology demonstrated an age-related increase in 3xTg-AD mice at only the 18-month timepoint (N), while age-related increases were found in 5xFAD mice at both 12-month and 18-month timepoints (O). n = 5–10 mice per genotype/age/sex. Data are represented as mean ± SEM. *p ≤ 0.05, **p ≤ 0.01, ***p ≤ 0.001, ****p ≤ 0.0001.

References

    1. Alzheimer’s Association Report (2021). 2021 Alzheimer’s disease facts and figures. Alzheimers Dement 17 327–406. 10.1002/alz.12328 - DOI - PubMed
    1. Balderrama-Gutierrez G., Liang H., Rezaie N., Carvalho K., Forner S., Matheos D., et al. (2021). Single-cell and nucleus RNA-seq in a mouse model of AD reveal activation of distinct glial subpopulations in the presence of plaques and tangles. bioRxiv [preprint]. 10.1101/2021.09.29.462436 - DOI
    1. Barthelemy N. R., Horie K., Sato C., Bateman R. J. (2020). Blood plasma phosphorylated-tau isoforms track CNS change in Alzheimer’s disease. J. Exp. Med. 217:e20200861. 10.1084/jem.20200861 - DOI - PMC - PubMed
    1. Belfiore R., Rodin A., Ferreira E., Velazquez R., Branca C., Caccamo A., et al. (2019). Temporal and regional progression of Alzheimer’s disease-like pathology in 3xTg-AD mice. Aging Cell 18:e12873. 10.1111/acel.12873 - DOI - PMC - PubMed
    1. Bories C., Guitton M. J., Julien C., Tremblay C., Vandal M., Msaid M., et al. (2012). Sex-dependent alterations in social behaviour and cortical synaptic activity coincide at different ages in a model of Alzheimer’s disease. PLoS One 7:e46111. 10.1371/journal.pone.0046111 - DOI - PMC - PubMed