. 2022 Jan 15;12(1):176-197.
eCollection 2022.

The ADAM9/UBN2/AKR1C3 axis promotes resistance to androgen-deprivation in prostate cancer

Affiliations

The ADAM9/UBN2/AKR1C3 axis promotes resistance to androgen-deprivation in prostate cancer

Trang Thi-Huynh Le et al. Am J Cancer Res. .

Abstract

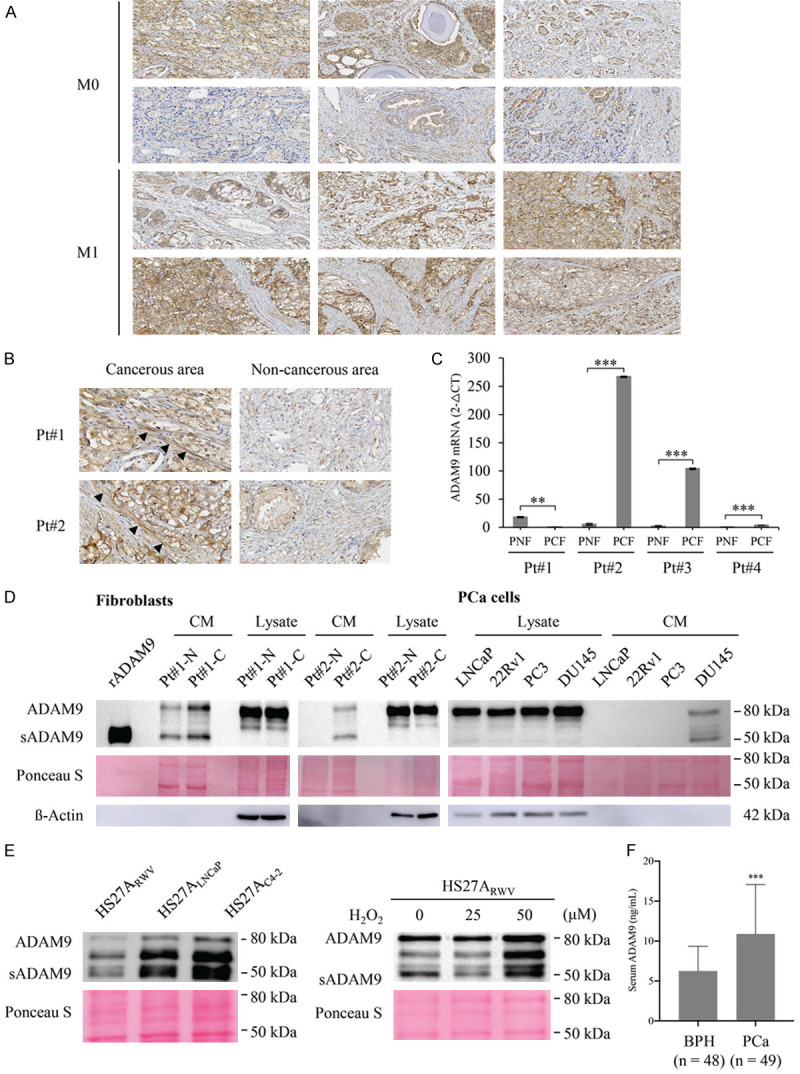
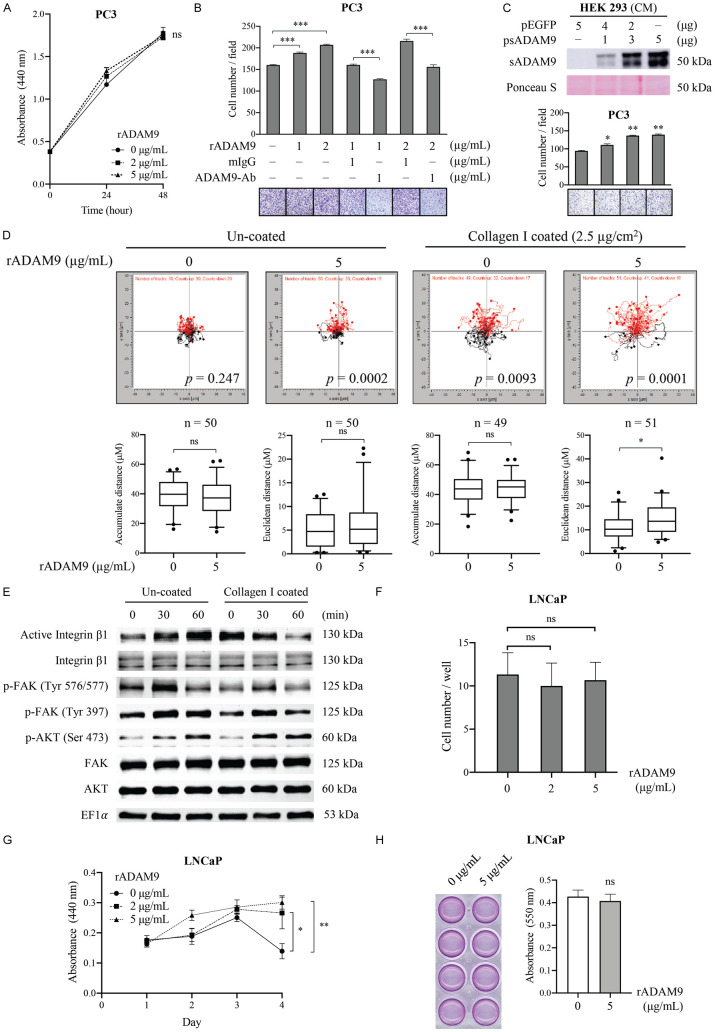
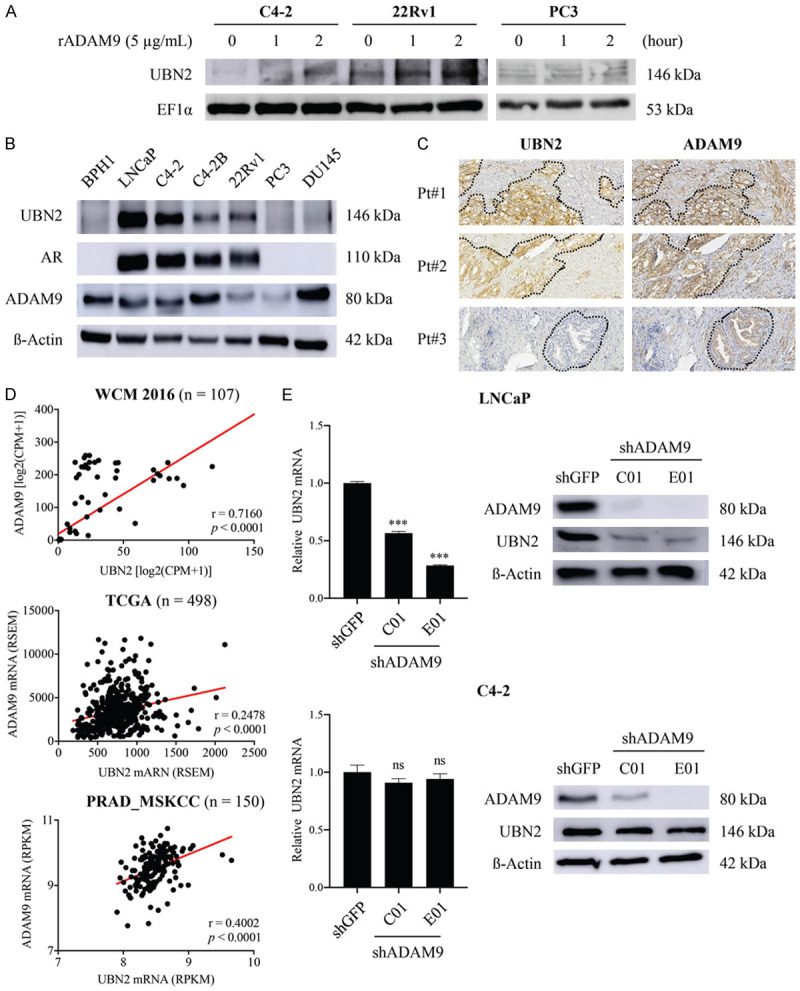
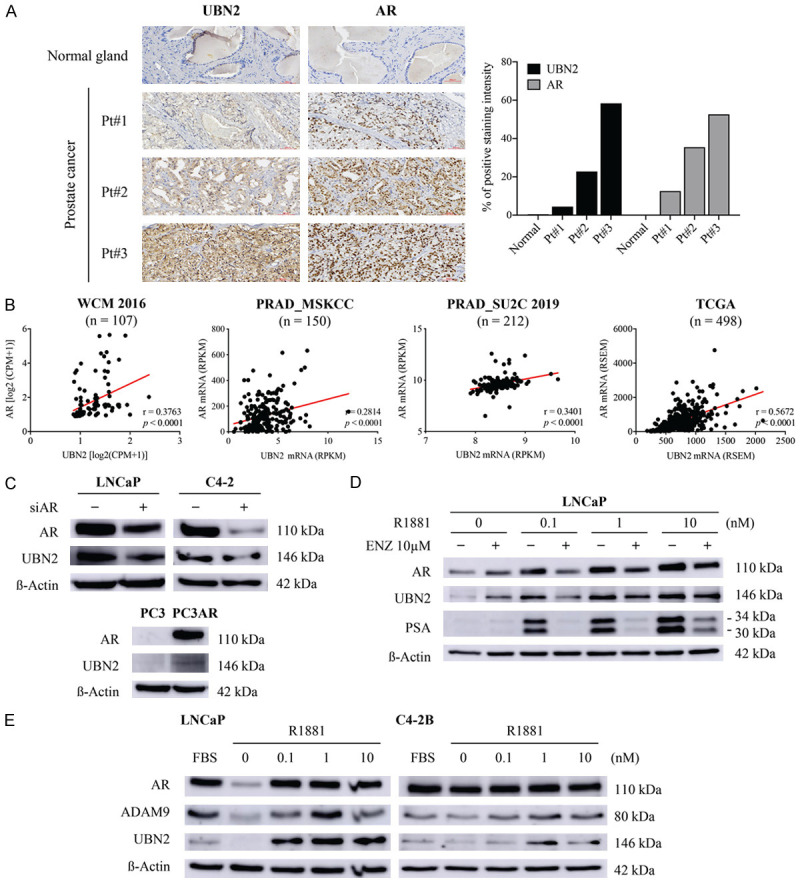
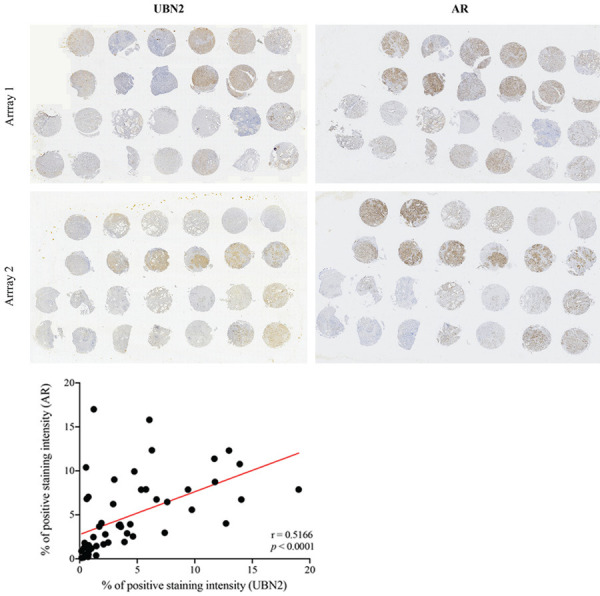
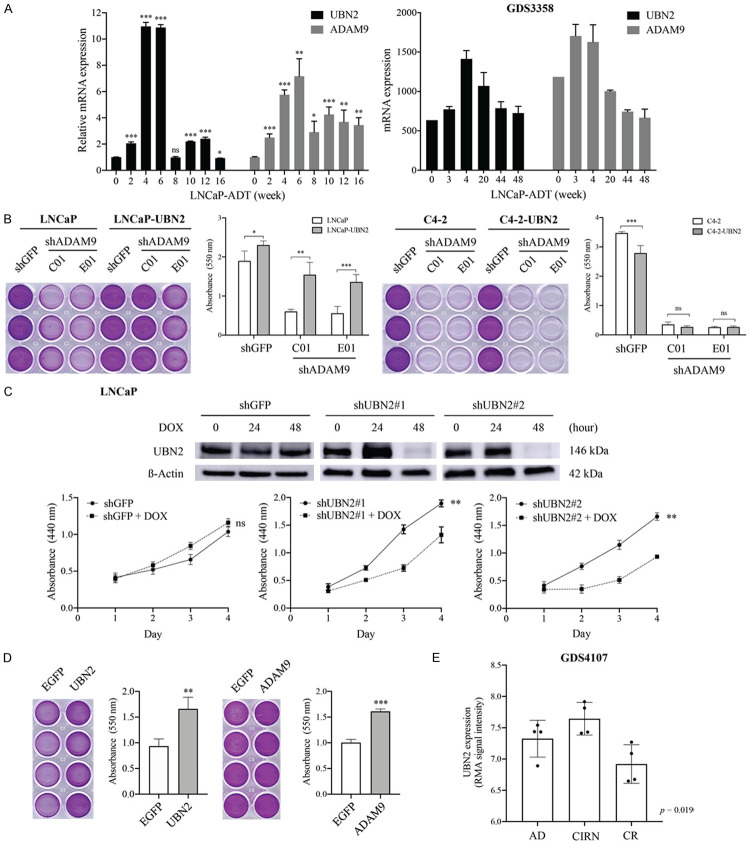
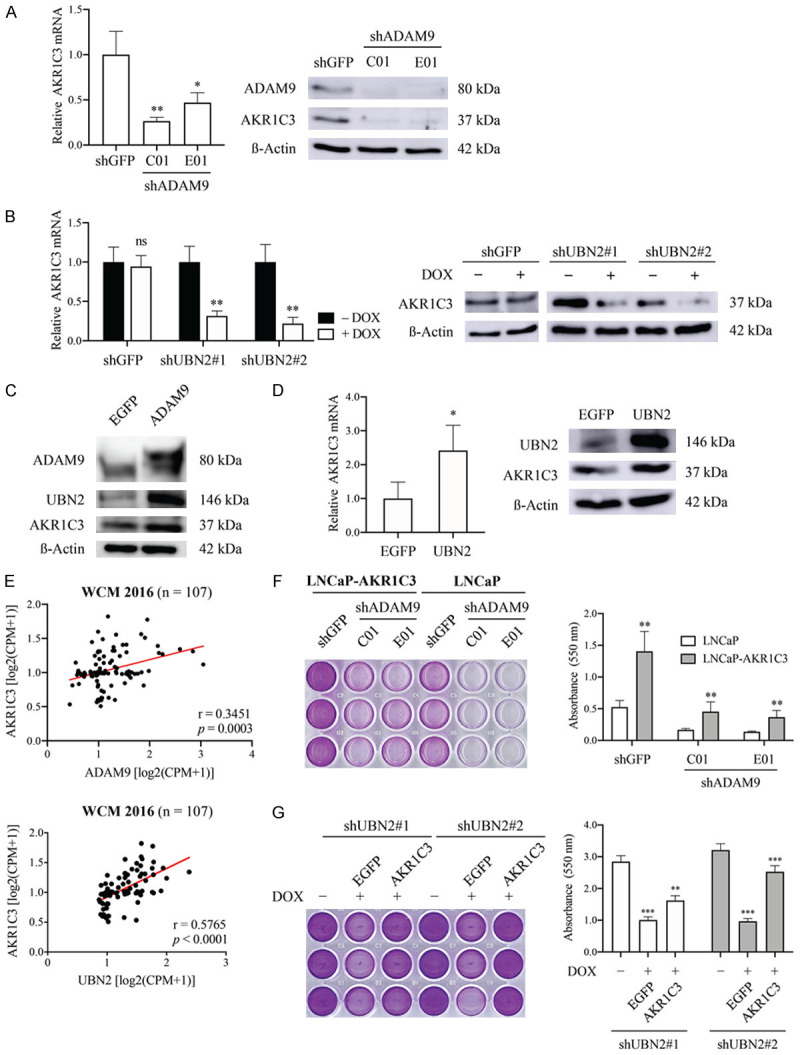
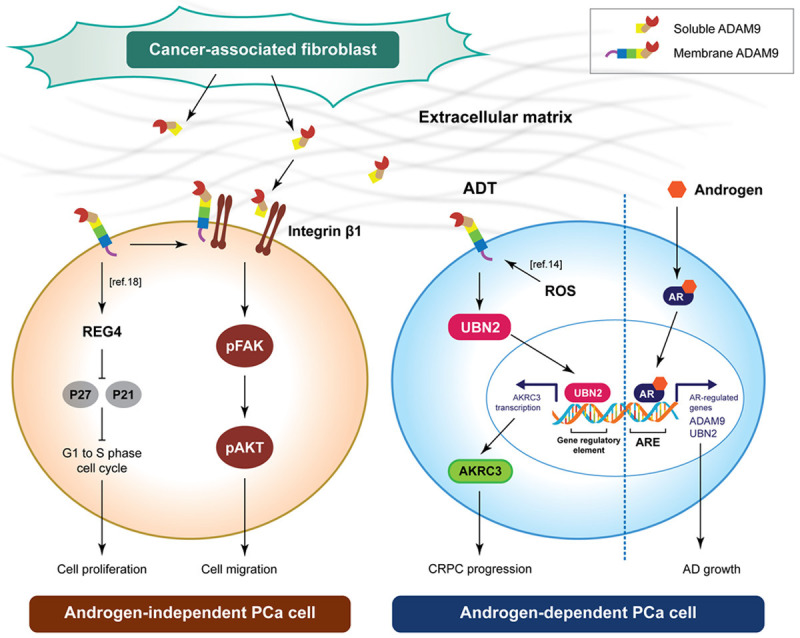
Metastatic and castration-resistant disease is a fatal manifestation of prostate cancer (PCa). The mechanism through which resistance to androgen deprivation in PCa is developed remains largely unknown. Our understanding of the tumor microenvironment (TME) and key signaling pathways between tumors and their TME is currently changing in light of the generation of new knowledge with regard to cancer progression. A disintegrin and metalloproteinase domain-containing protein 9 (ADAM9) is a membranous bridge forming cell-cell and cell-matrix connections that regulate tumor aggressiveness and metastasis. However, it is not known whether ADAM9 expressed in the TME contributes to the CRPC phenotype. In this study, we aimed to investigate the expression patterns of ADAM9 in prostate cancer-associated fibroblasts (CAFs). We also intended to elucidate the effects of both stromal cell- and cancer cell-derived ADAM9 on the progression of CRPC and the implicated molecular pathways. By using both clinical specimens and cell lines, we herein showed that unlike the membrane anchored ADAM9 overexpressed by both PCa cells and prostate CAFs, the secreted isoform of ADAM9 (sADAM9) was strongly detected in CAFs, but rarely in tumor cells, and that could be a serum marker for PCa patients. We demonstrated that functionally sADAM9 are characterized as chemoattractant for the directed movement of androgen-independent PCa cells through integrin downstream FAK/AKT pathway, supporting that elevated sADAM9 by prostate CAFs could be responsible for the promotion of CRPC metastasis. Moreover, by stimulating PCa cells with sADAM9, we found that ubinuclein-2 (UBN2) expression was increased. A positive correlation of ADAM9 and UBN2 expression was observed in androgen receptor-expressing PCa cell lines and further confirmed in clinical PCa specimens. Using a genetic modification approach, we identified UBN2 as a downstream target gene of ADAM9 that is critical for the survival of androgen-dependent PCa cells in response to androgen deprivation, through the induction and effect of the aldo-keto reductase family 1 member C3 (AKR1C3). Collectively, our results reveal a novel action of ADAM9 on the transition of androgen-dependent PCa cells into an androgen-independent manner through the UBN2/AKR1C3 axis; the aforementioned action could contribute to the clinically-observed acquired androgen-deprivation therapy resistance.

Keywords: ADAM9; Prostate cancer; aldo-keto reductase family 1 member C3 (AKR1C3); androgen-deprivation therapy (ADT); cancer-associated fibroblasts (CAFs); castration resistant prostate cancer (CRPC); soluble ADAM9; tumor microenvironment; ubinuclein-2 (UBN2).


Conflict of interest statement

None.

Figures

Figure 1
Figure 1
Detection of ADAM9 expression pattern in human prostate cancer and prostatic stromal cells. (A) IHC staining of ADAM9 in a PCa tissue microarray containing prostate tumors from patients who developed metastasis (M1) or not (M0) after prostatectomy, with a total of six samples in each group. (B) Enlarged IHC images of cancerous and non-cancerous areas in (A) M1 tissues from two individual patients at a magnification of 40×. The arrowheads indicate positive staining in the stromal cells. (C) Quantitative RT-PCR analysis of ADAM9 mRNA expression in LCM-isolated fibromuscular stroma surrounding normal (PNF) and tumor (PCN) prostatic tissues deriving from 4 patients (Pt#1-4). (D) WB analysis of ADAM9 expression in total lysates and conditioned media (CM) from PCa patient-derived normal (Pt#1-N and Pt#2-N) and cancer-associated (Pt#1-C and Pt#2-C) fibroblasts and PCa cell lines. A recombinant ectodomain of ADAM9 (rADAM9) was used as molecular weight marker of the mature soluble isoform (50 kDa) of ADAM9 (sADAM9). (E) WB analysis of ADAM9 from the HS27A-derived normal (HS27ARWV) and PCa-associated (HS27ALNCaP and HS27AC4-2) CM or from the H2O2-treated HS27ARWV CM. (F) ELISA determination of ADAM9 levels in the serum samples of patients diagnosed with benign prostatic hyperplasia (BPH) or PCa. WB of ß actin and Ponceau S staining are showed as the loading control of cell lysates and CM, respectively. Data are representative of three independent experiments and shown as mean ± SD. *P<0.05, **P<0.001, ***P<0.0001.
Figure 2
Figure 2
Effects of sADAM9 on the cell growth and migratory ability of PCa cells. (A) WST-1 cell proliferation assay of PC3 cells cultured with different concentrations of rADAM9 for two days. (B) Transwell migration assay of PC3 cells incubated with different concentrations of rADAM9 in the presence of additional 1 μg/ml of an ADAM9 neutralizing antibody or control mouse IgG (mIgG). (C) Transwell migration assay of PC3 cells with the CM from 293FT cells transfected with a plasmid containing sADAM9 or EGFP cDNA. WB analysis of ADAM9 expression in these same CM is shown at the top. (D) Chemotaxis assay for PC3 cells toward rADAM9 using the μ-slide chemotaxis chamber, with or without collagen I slide coating. On average 47-53 cells were tracked per experiment for three independent experiments. Trajectory plots (upper panel) was generated by the analysis of migration paths of individual cells and by normalizing the starting point to x=0 and y=0. The y-axis represents the direction of the chemoattractant source. The Rayleigh test was used for controlling the uniformity of cell distribution. The data of the accumulated and the Euclidean distance are represented as a box-whisker plot (lower panel) (by a t-test). (E) WB analysis of the activation of integrin β1 and the migration-related signaling pathway in PC3 cells that were grown on collagen I-coated or uncoated plates, and were treated with 5 μg/ml rADAM9 at the indicated time points. (F) Transwell migration assay and (G) cell proliferation assay by WST-1 of LNCaP cells cultured with 0, 2, and 5 µg/mL of rADAM9 in 0.5% FBS-containing medium. (H) Cell growth assay and relative graph of LNCaP cells that were added with or without 5 µg/mL of rADAM9 in CSS medium for 7 days. Quantitative data in figure are shown as the mean ± SD of at least three independent experiments. The representative image of transwell migration (B, C) from each condition is shown at bottom. *P<0.05, **P<0.001, ***P<0.0001, ns: non-significant.
Figure 3
Figure 3
Characterization of the relationship between ADAM9 and UBN2 in PCa cells. A. WB analysis of the UBN2 induction in CRPC-like C4-2, 22Rv1, and PC3 cells after stimulation with rADAM9 for the indicated time points. EF1-α protein levels are shown for various loading quantities of cell lysates. B. WB analysis for the coexpression pattern of ADAM9 and UBN2 in PCa cell lines; β-actin was used as loading control. C. IHC analysis for UBN2 and ADAM9 in a serial section of the same tissues. The dashed lines indicate the junction between the tumor nests and the stroma. D. Pearson correlation analysis between ADAM9 and UBN2 using the indicated database resources. The solid line indicates the linear fit, while Pearson’s correlation coefficient (R) and the corresponding P value are indicated in the panel. E. Comparison of the UBN2 expression levels between ADAM9-knockdown (shADAM9) and control (shGFP) lines of androgen-dependent LNCAP and androgen-independent C4-2, as identified by qRT-PCR and WB analysis. C01 and E01 represent two shRNAs targeting different regions of ADAM9 gene. *P<0.05, **P<0.001, ***P<0.0001, ns: non-significant.
Figure 4
Figure 4
Effects of AR signaling on UBN2 expression in PCa cells. Detection of association between AR and UBN2 expression in PCa tissues by (A) IHC analysis of tissue microarrays, and (B) Pearson correlation analysis of public RNA-seq datasets. Comparison of UBN2 expression levels between (C) parental and AR knockdown (siAR) in LNCaP and C4-2 cells and AR-stably expressing PC3 cells (PC3-AR), (D) LNCaP cells treated with the indicated dose of R1881 in the presence and absence of additional enzalutamide (ENZ) in androgen-depleted medium for 72 h, and (E) LNCaP and C4-2B cells cultured under normal (FBS) and androgen withdrawal conditions (CSS) for 72 h; β-actin was used as WB loading control.
Figure 5
Figure 5
Low power view of tissue microarray slides immunostained with AR and UBN2 antibodies. The parallel in two TMAs immunostaining of prostatectomies from PCa patients. Correlation between the relative protein levels of AR and UBN2 in 52 PCa tissues is shown at the bottom.
Figure 6
Figure 6
Effects of the ADAM9/UBN2 axis on LNCaP cell proliferation. (A) Expression pattern of ADAM9 and UBN2 mRNA in LNCaP cells during a period of long-term culture in androgen-depleted media, as determined by RT-qPCR analysis in our cell model and by bioinformatic analysis of RNA-seq data from GDS3358 dataset. (B, D) Crystal violet staining assay for cell growth comparison. (B) The ADAM9 knockdown (shADAM9) LNCaP and C4-2 cells with or without overexpression of UBN2, and (D) the parental LNCaP cells stably expressing control (EGFP), UBN2, ADAM9 were cultured in androgen withdrawal media for 10 days and 1 week, respectively. A representative image of culture plates from each condition is shown on the left. (C) WST-1 cell proliferation assay of LNCaP shGFP and shUBN2 derivatives treated with or without DOX for UBN2 knockdown under normal culture conditions at the indicated time points. The WB analysis of the UBN2 knockdown efficiency by DOX (0.1 µg/mL) induction at different time points is shown at the top. (E) Comparison of the UBN2 mRNA levels at different stages of a PCa tumor growth during the ADT in a KUCaP xenograft model (GDS4107). The quantitative data are represented as mean ± SD of absorbance values of triplicate wells after dye extraction from one out of two independent experiments. *P<0.05, **P<0.001, ***P<0.0001, ns: non-significant. AD: androgen-dependent, CIRN: castration-induced regression nadir, CR: castration-resistant.
Figure 7
Figure 7
Characterization of the involvement of AKR1C3 in ADAM9/UBN2-mediated cell survival of LNCaP against ADT. Comparison of AKR1C3 expression in ADAM9- (A, C) and UBN2-modulated (B, D) LNCaP derivatives, as determined by RT-qPCR and WB analysis. (E) Pearson correlation analysis between ADAM9 or UBN2 and AKR1C3 mRNA expression using the WCM 2016 database. (F, G) Comparison of cell growth, (F) the ADAM9 knock down (shADAM9) in LNCaP cells with and without overexpression of AKR1C3 after 7 days and (G) UBN2 knockdown (shUBN2) LNCaP derivative (+DOX) transfected with AKR1C3 or EGFP (cells without DOX treatment were used as the UBN2 wild type control) after 10 days of culturing in androgen-depleted media by crystal violet staining analysis. *P<0.05, **P<0.001, ***P<0.0001, ns: non-significant.
Figure 8
Figure 8
Model of ADAM9 and sADAM9 in androgen-independent and androgen-dependent PCa cell.

Similar articles

Cited by

References

    1. Mattiuzzi C, Lippi G. Current cancer epidemiology. J Epidemiol Glob Health. 2019;9:217–222. - PMC - PubMed
    1. Polotti CF, Kim CJ, Chuchvara N, Polotti AB, Singer EA, Elsamra S. Androgen deprivation therapy for the treatment of prostate cancer: a focus on pharmacokinetics. Expert Opin Drug Metab Toxicol. 2017;13:1265–1273. - PubMed
    1. Varenhorst E, Klaff R, Berglund A, Hedlund PO, Sandblom G Scandinavian Prostate Cancer Group (SPCG) Trial No. 5. Predictors of early androgen deprivation treatment failure in prostate cancer with bone metastases. Cancer Med. 2016;5:407–414. - PMC - PubMed
    1. Chung LW, Baseman A, Assikis V, Zhau HE. Molecular insights into prostate cancer progression: the missing link of tumor microenvironment. J Urol. 2005;173:10–20. - PubMed
    1. Damodaran S, Kyriakopoulos CE, Jarrard DF. Newly diagnosed metastatic prostate cancer: has the paradigm changed? Urol Clin North Am. 2017;44:611–621. - PMC - PubMed

LinkOut - more resources