. 2022 Jan 15;12(1):280-302.
eCollection 2022.

ST3GAL2 knock-down decreases tumoral character of colorectal cancer cells in vitro and in vivo

Affiliations

ST3GAL2 knock-down decreases tumoral character of colorectal cancer cells in vitro and in vivo

Marlène Deschuyter et al. Am J Cancer Res. .

Abstract

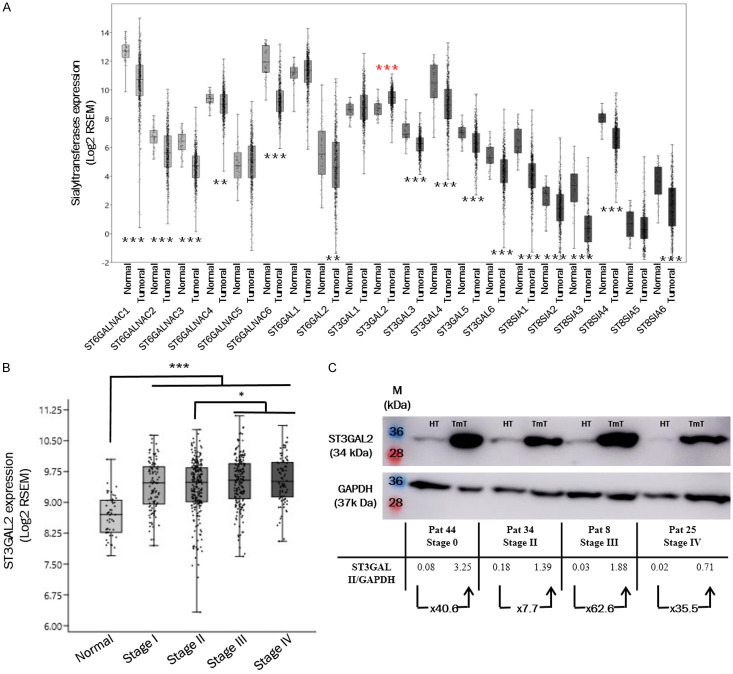
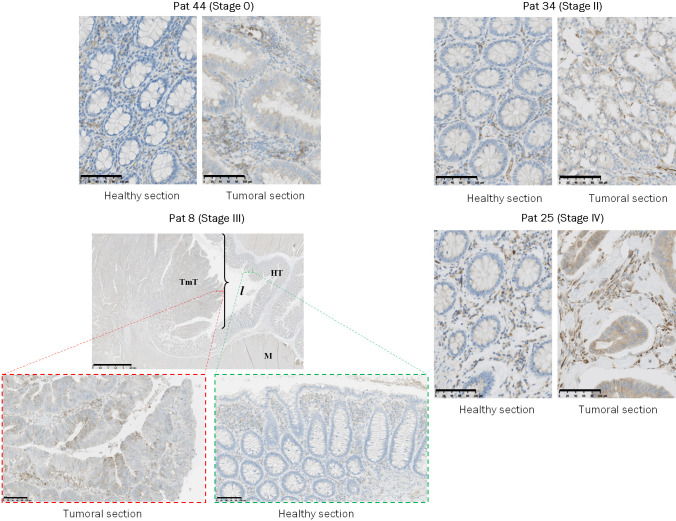
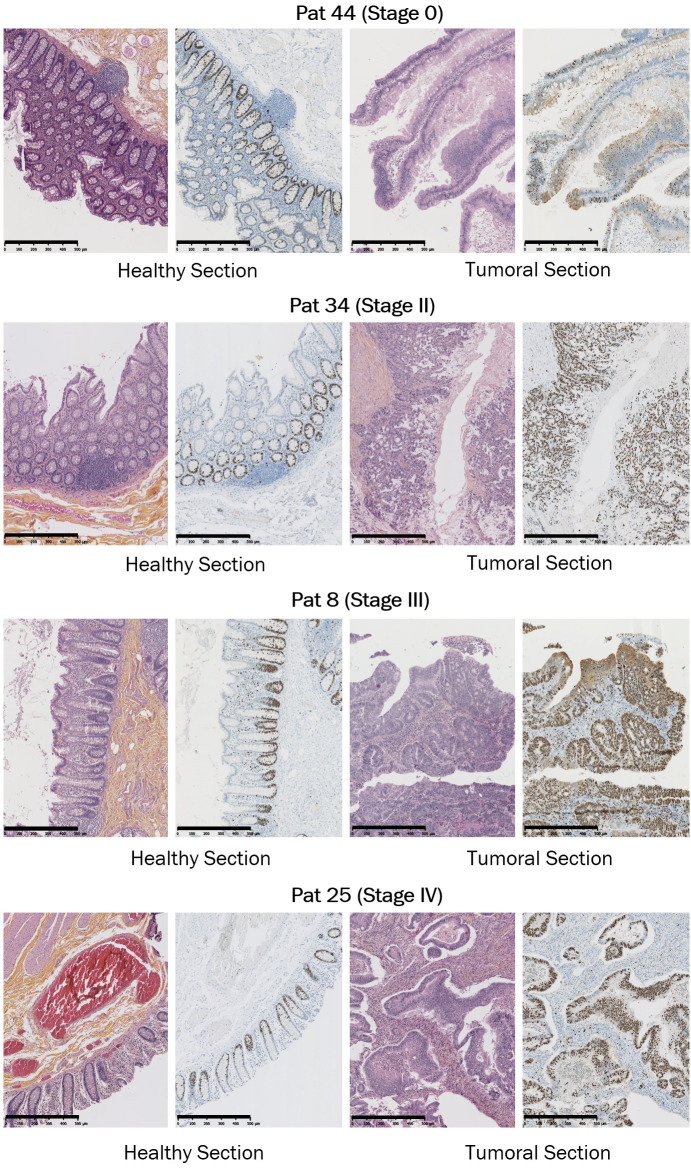
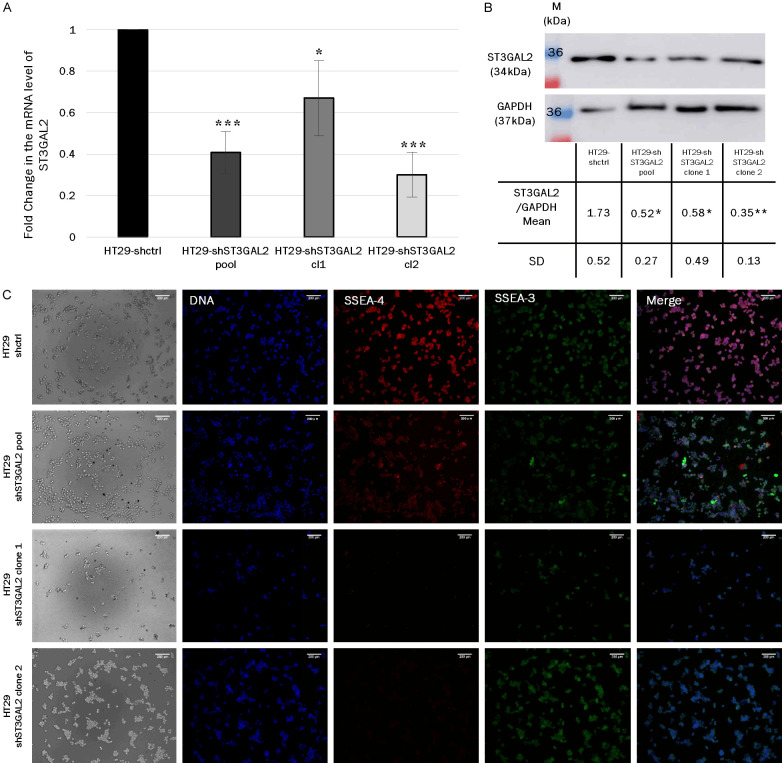
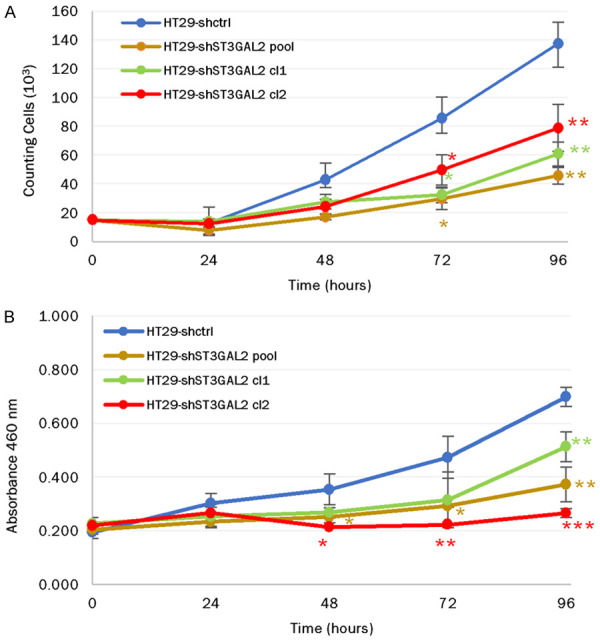
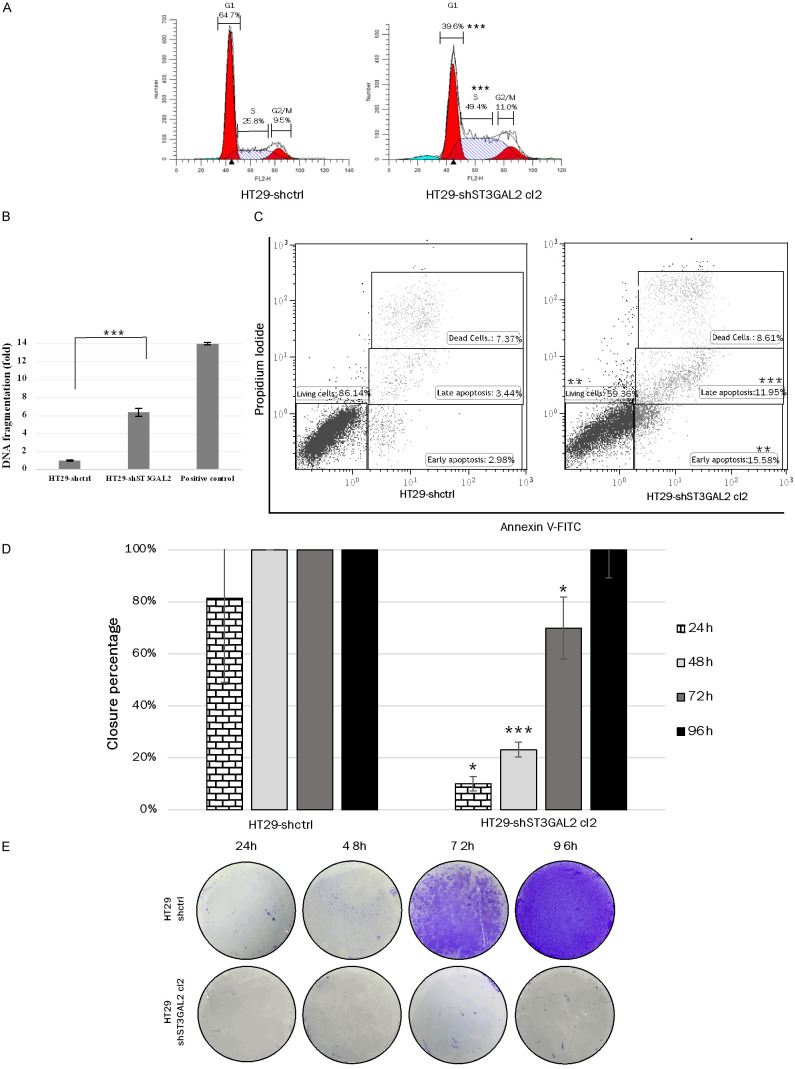
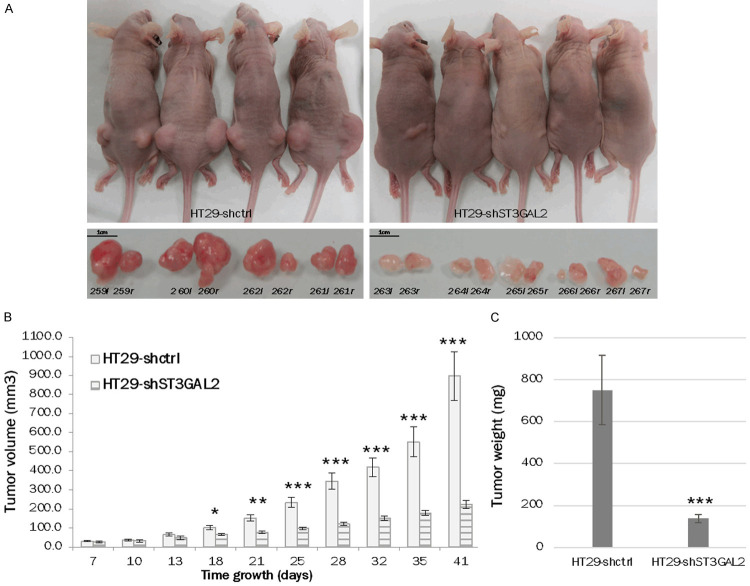
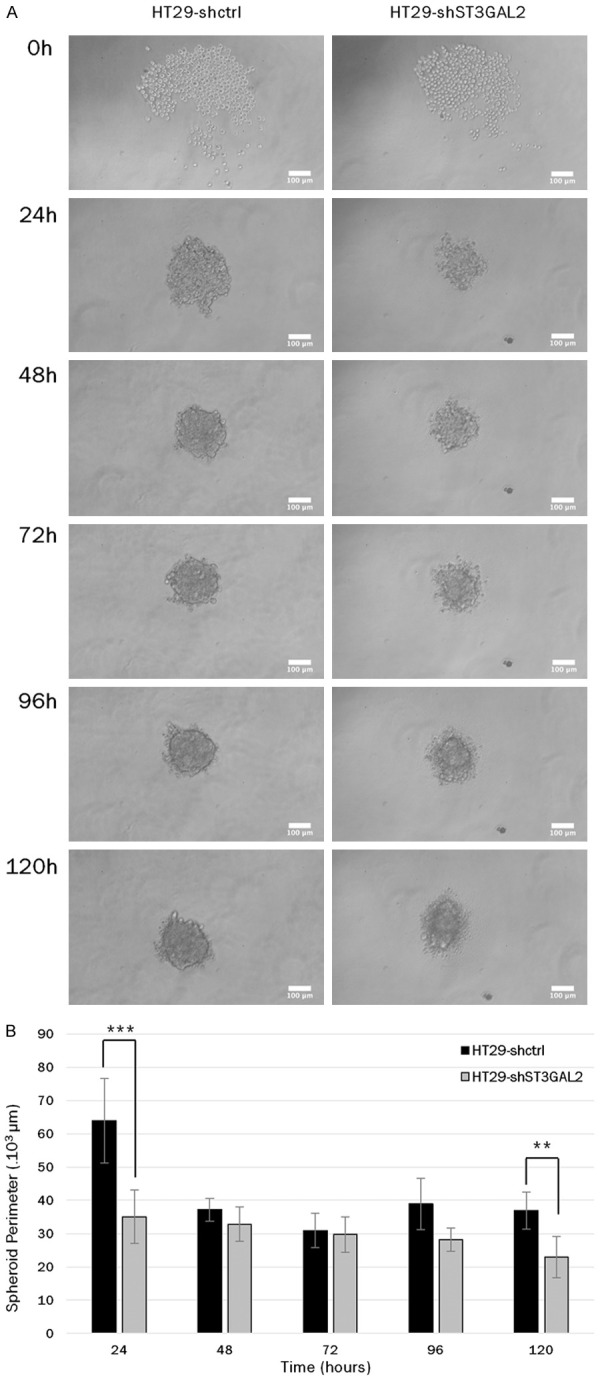
Tumor cells have a modified glycosylation profile that promotes their evolution and/or their maintenance in the tumor. Sialylation is a type of glycosylation that is often altered in cancers. RNA-Seq database analysis revealed that the sialyltransferase gene ST3GAL2 is significantly overexpressed at all stages of colorectal cancer (CRC). ST3GAL2 sialylates both glycoproteins and glycolipids. The aim of this work was to investigate the involvement of ST3GAL2 in CRC. Using the HT29 tumor cell line derived from a stage II of CRC, we decreased the expression of ST3GAL2 by specific shRNA, and then characterized these cells by performing functional tests. We found that ST3GAL2 knock down (KD) significantly decreases tumor cell proliferation, cell migration and invasiveness properties in vitro. The cell cycle of these cells is affected with a change in cell cycle distribution and an increase of cell apoptosis. The effect of ST3GAL2 KD was then studied in vivo, following xenografts into nude mice, in which the tumor progression was significantly reduced. This work demonstrates that ST3GAL2 is a major player in the behavior of colorectal tumor cells, by modifying the sialylation state of glycoproteins and glycolipids which remain to be specifically identified.

Keywords: HT29; ST3GAL2; biopsies; colorectal cancer; xenografts.


Conflict of interest statement

None.

Figures

Figure 1
Figure 1
ST3GAL2 overexpression in colorectal tumors. (A) COADREAD RNAseq data extracted from Firebrowse database, containing 626 tumor tissues and 51 normal tissues, show that among 20 sialyltransferases, ST3GAL2 is significantly overexpressed in colorectal tumors (red stars). (B) ST3GAL2 is overexpressed at all stages, and it seems slightly more expressed in the two last stages. Average age: 66.3 years; distribution is: 53% men, 47% women. For (A) and (B), bar graph represent mean of log2 RSEM ± SEM, *P<0.05, **P<0.01, ***P<0.001. (C) Expression level of ST3GAL2 was assessed by western blotting assays in colorectal tumor tissues compared to healthy sections of the same patients. (HT: Healthy Tissue; TmT: Tumoral Tissue).
Figure 2
Figure 2
Immunohistochemistry performed on biopsies from CRC patients. Immunohistochemistry analyses performed with anti-ST3GAL2 antibody on healthy section and tumoral section from biopsies from patients with colorectal tumors at different stages. Patient Pat 44 represents a stage 0 from a woman CRC. Patient Pat 34 represents a stage II from a man and patient Pat 25 represents a stage IV from man. For Pat 8 which represents stage III, healthy and tumoral tissues are present on the same biopsy. ST3GAL2 immunolabelling was more intense in tumoral section (brown staining) compared to healthy section where immunolabelling was only observed in lymphocytes surrounding the Luberkhunien glands. Scale bar: 100 µm. (TmT: Tumor Tissue, HT: Healthy Tissue, M: Muscle, l: intestinal lumina).
Figure 3
Figure 3
HES and Ki67 stainings performed on biopsies from CRC patients. HES (left panels) and Ki67 (right panels) stainings on healthy and tumoral sections from different stage biopsies. HES staining revealed a classical architecture of healthy tissue with polarized epithelium invaginating in Lieberkühn crypts, while this structured architecture was totally abolished into tumoral section. Ki67 stainings, for their part, were more pronounced in tumoral section which is consistent with the proliferative nature of tumoral tissue. In healthy section, Ki67 staining was only observed in bottom pole of intestinal glands, consistent with the literature. Scale bar: 500 µm.
Figure 4
Figure 4
ST3GAL2 KD validation. A. Relative mRNA levels of ST3GAL2 were measured by real time qPCR assays after transfection of shRNA control or shRNA against ST3GAL2 in the colorectal cell line HT29. Bar graph represents mean of ST3GAL2 mRNA relative quantity ± SD, *P<0.05; **P<0.01, ***P<0.001. B. Protein levels of ST3GAL2 were analyzed by western blotting assays in HT29 transfected with shRNA against ST3GAL2 compared to HT29 transfected with shRNA control. Western blots were performed in triplicate, the table shows the ST3GAL2/GAPDH ratio mean ± SD. p values are calculated for each KD cell populations vs HT29-shctrl. *P<0.05, **P<0.01. C. Immunofluorescence labelling of Stage Specific Embryonic Antigen 4 (SSEA-4) (red), SSEA-3 (green) and DNA with DAPI (blue), performed on the different HT29 cells knockdown for ST3GAL2 (HT29-shST3GAL2) and HT29 control cells (HT29-shctrl). Scale bar: 100 µm.
Figure 5
Figure 5
Proliferation assays on the different HT29 population cells: Proliferation capacities of HT29-shctrl, HT29-shST3GAL2 pool, HT29-shST3GAL2 cl1 and HT29-shST3GAL2 cl2 cells were assessed using two different methods, cell counting (A) and CCK8 kit assay (B). Proliferation test with CCK8 kit and counting method gave similar results. Data are represented as mean of counting cells per day ± SD (A) or mean of absorbance at 460 nm per day ± SD (B) from three independent experiments. *P<0.05, **P<0.01, ***P<0.001.
Figure 6
Figure 6
Functional tests on HT29 cells. A. Cell cycle analysis by flow cytometry of ST3GAL2 KD and control cells. The percentages correspond to cells in G1 phase, S phase and G2/M phases. B. DNA fragmentation in HT29-shctrl and HT29-shST3GAL2 cells was quantified by ELISA. DNA degradation is expressed relative to control cells. Graph bars represent mean ± SD. C. HT29 cells were stained with Annexin V-FITC and PI, and analyzed by flow cytometry. Percentages represent living cells in lower left panel, cells in apoptosis in lower right panel, and dead cells in upper right panel. D. Migration assays were performed in free FBS medium to detect the cell migration ability of HT29 cells. The gap closure was measured every day and converted in closure percentage. Graph bars represent means of percentage closure ± SD. from three independent experiments. *P<0.05, ***P<0.001. E. Invasion tests: cells were placed in the upper chamber of a transwell insert, and matrigel-transwell assays were performed to detect every 24 h the cell invasion ability of HT29 cells by crystal violet staining of cells on the underside of the membrane. *P<0.05, **P<0.01, ***P<0.001.
Figure 7
Figure 7
Tumor growth into mice. In vivo tumor formation into nude mice xenografted with HT29-shctrl cells or HT29-shST3GAL2 cells was observed. Knock-down of ST3GAL2 reduced tumor growth in vivo (A). The tumor volume (B) and weight (C) were significantly lower with HT29-shST3GAL2 xenografts. Tumors were named with mice identification number and with letter r (right flank) or l (left flank). Graph bars represent means of volumes and weights ± SD. *P<0.05, **P<0.01, ***P<0.001.
Figure 8
Figure 8
Immunohistological analyses of mouse tumors. ST3GAL2 immunohistochemistry was performed on tumors derived from mice xenografted with HT29-shctrl (A) or HT29-shST3GAL2 (B). Ki67 staining of tumors from mice xenografted with HT29-shctrl (C) or HT29-shST3GAL2 (D) cells was also performed. Necrosis zones are indicated with red arrows. Scale bar: 50 µm.
Figure 9
Figure 9
Spheroid formation capacities. A. Capacities of spheroid formation of HT29-shctrl cells and HT29-shST3GAL2 cl2 cells were tested during 120 h using specific 96 well plates. Only one spheroid can form per well, pictures were taken every 24 hours to compare spheroid evolution. Scale bar: 100 µm. B. Spheroid perimeters of HT29-shST3GAL2 were significantly smaller at 24 h and 120 h. **P<0.01, ***P<0.001.

Similar articles

Cited by

References

    1. Warburg O, Wind F, Negelein E. Über den Stoffwechsel von Tumoren im Körper. Klin Wochenschr. 1926;5:829–832.
    1. Shaw RJ, Cantley LC. Ras, PI(3)K and mTOR signalling controls tumour cell growth. Nature. 2006;441:424–430. - PubMed
    1. Kroemer G, Pouyssegur J. Tumor cell metabolism: cancer’s Achilles’ heel. Cancer Cell. 2008;13:472–482. - PubMed
    1. Varki A, Cummings RD, Esko JD, Freeze HH, Stanley P, Bertozzi CR, Hart GW, Etzler ME, editors. Cold Spring Harbor (NY): Cold Spring Harbor Laboratory Press; 2009. Essentials of glycobiology. - PubMed
    1. Varki A, Kannagi R, Toole B, Stanley P. Glycosylation Changes in Cancer. In: Varki A, Cummings RD, Esko JD, Stanley P, Hart GW, Aebi M, Darvill AG, Kinoshita T, Packer NH, Prestegard JH, Schnaar RL, Seeberger PH, editors. Essentials of Glycobiology. 3rd edition. Cold Spring Harbor (NY): Cold Spring Harbor Laboratory Press; 2015. - PubMed

LinkOut - more resources