. 2022 Jan 15;12(1):427-444.
eCollection 2022.

Guanosine primes acute myeloid leukemia for differentiation via guanine nucleotide salvage synthesis

Affiliations

Guanosine primes acute myeloid leukemia for differentiation via guanine nucleotide salvage synthesis

Hanying Wang et al. Am J Cancer Res. .

Abstract

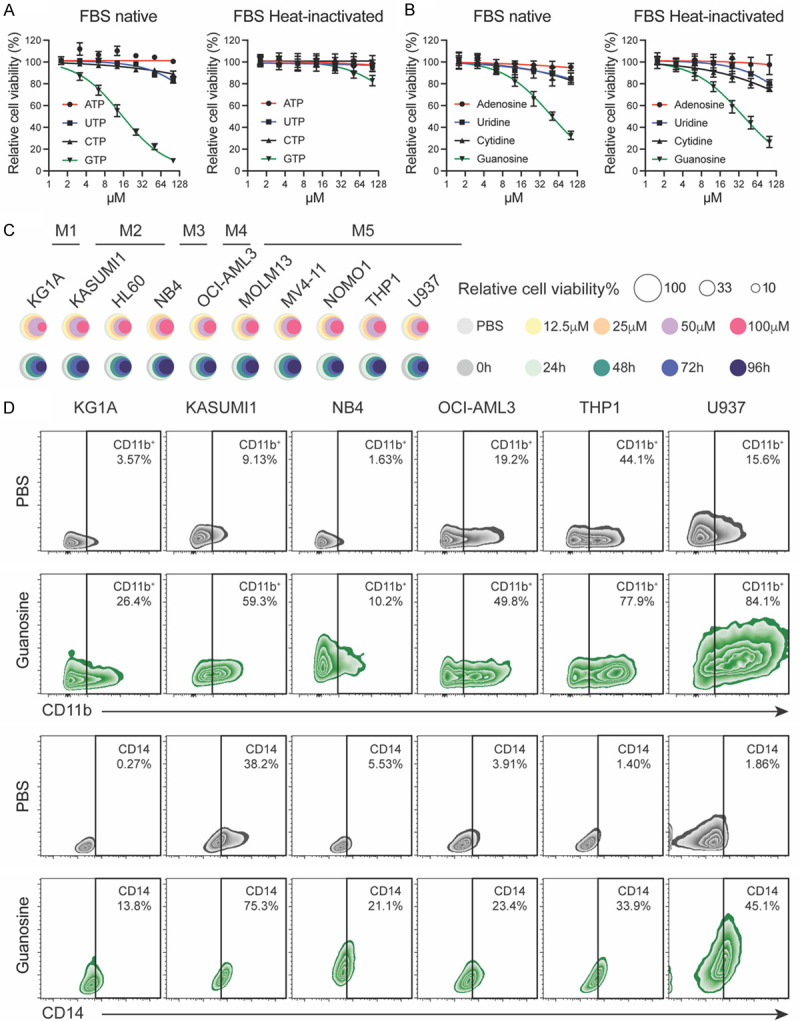
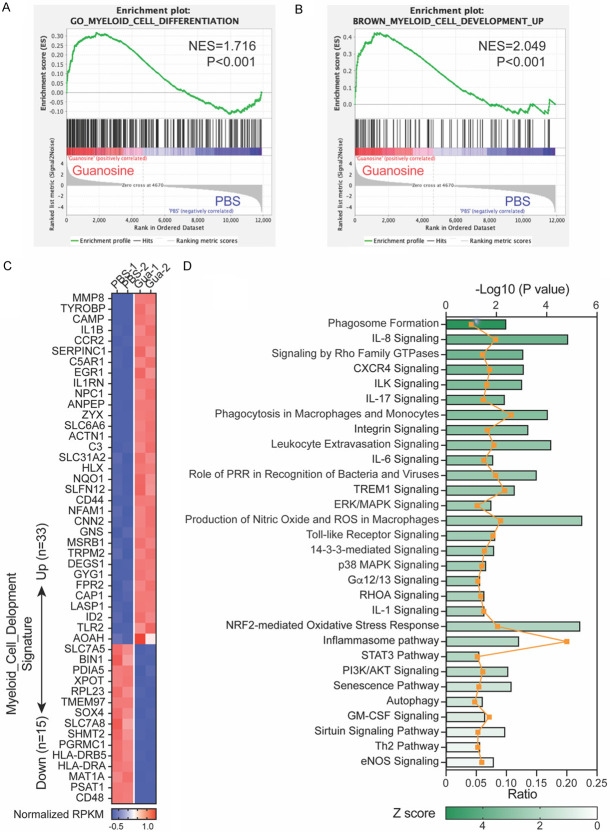
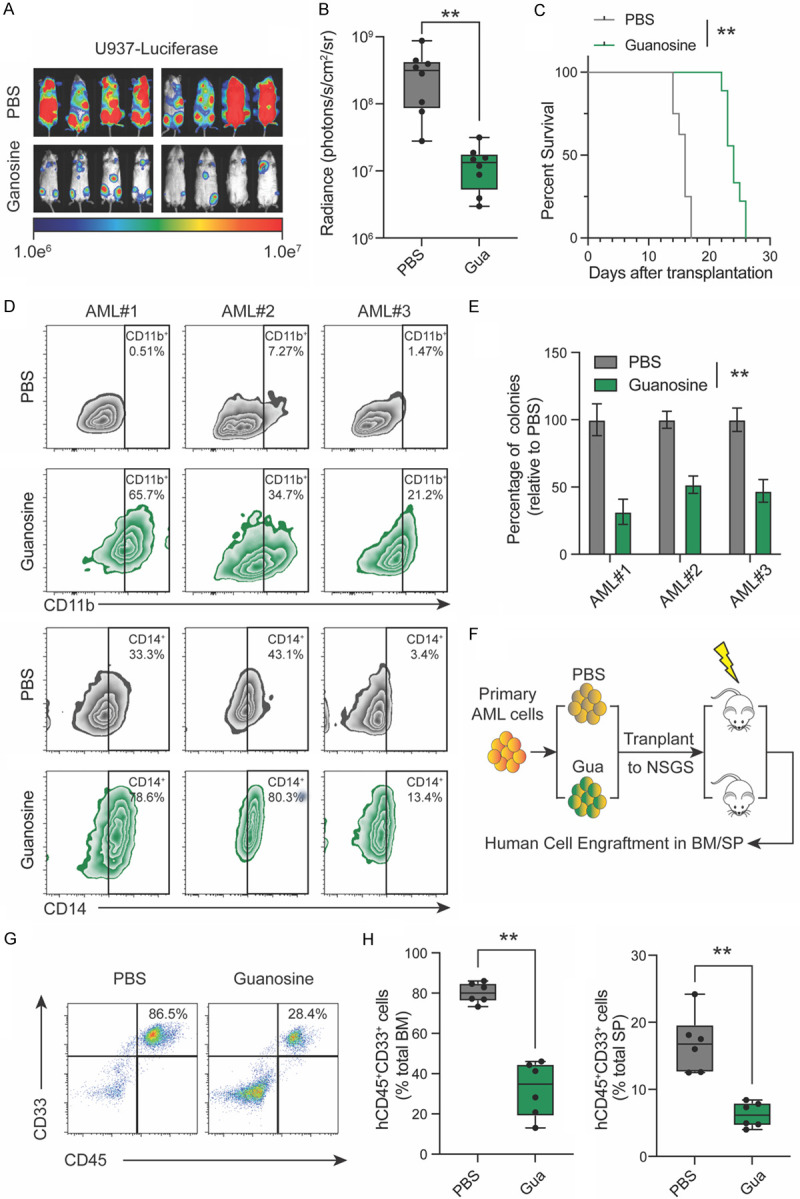
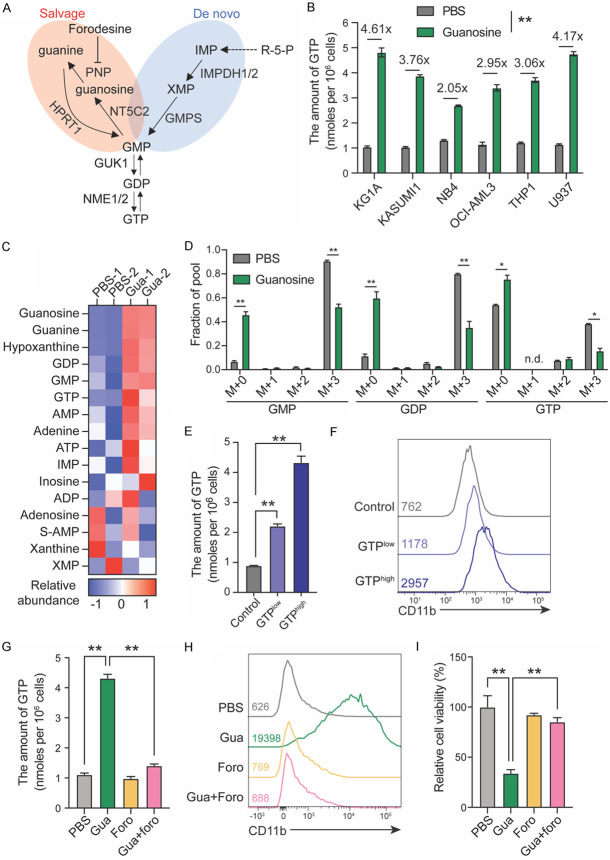
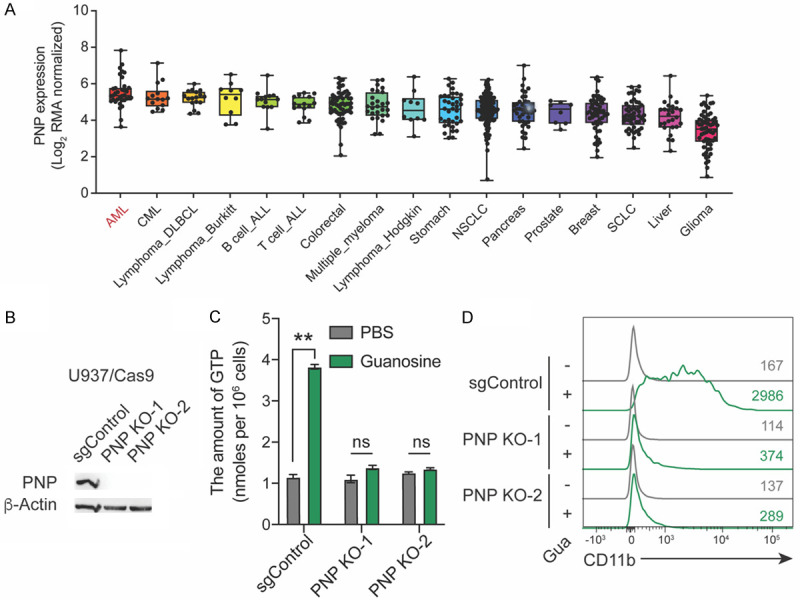
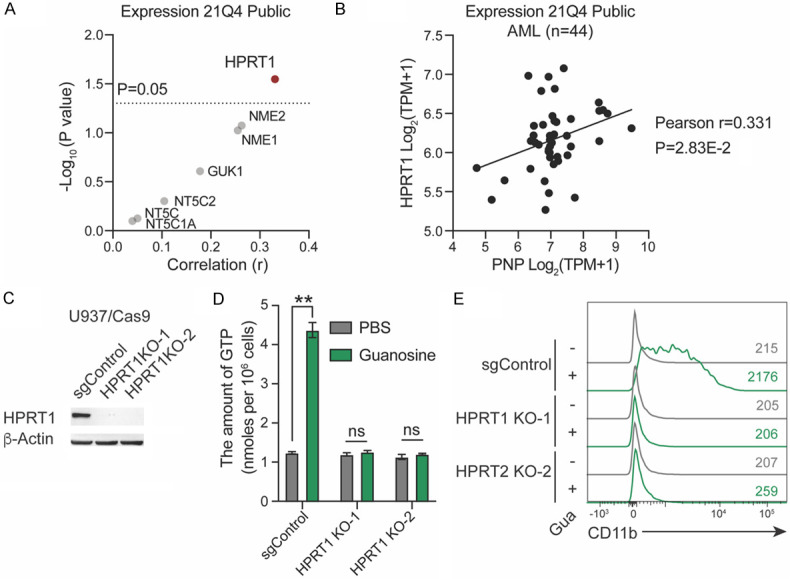
Differentiation arrest represents a distinct hallmark of acute myeloid leukemia (AML). Identification of differentiation-induction agents that are effective across various subtypes remains an unmet challenge. GTP biosynthesis is elevated in several types of cancers, considered to support uncontrolled tumor growth. Here we report that GTP overload by supplementation of guanosine, the nucleoside precursor of GTP, poises AML cells for differentiation and growth inhibition. Transcriptome profiling of guanosine-treated AML cells reveals a myeloid differentiation pattern. Importantly, the treatment compromises leukemia progression in AML xenograft models. Mechanistically, GTP overproduction requires sequential metabolic conversions executed by the purine salvage biosynthesis pathway including the involvement of purine nucleoside phosphorylase (PNP) and hypoxanthine phosphoribosyltransferase 1 (HPRT1). Taken together, our study offers novel metabolic insights tethering GTP homeostasis to myeloid differentiation and provides an experimental basis for further clinical investigations of guanosine or guanine nucleotides in the treatment of AML patients.

Keywords: Acute myeloid leukemia; HPRT1; PNP; guanosine 5’-triphosphate; myeloid differentiation.


Conflict of interest statement

None.

Figures

Figure 1
Figure 1
Guanosine treatment induces AML growth inhibition and differentiation. A. Relative cell viability of U937 cells treated with various doses of ribonucleoside 5’-triphosphates (ATP, UTP, CTP, GTP) respectively in culture media supplemented with native FBS (left) or heat-inactivated FBS (right). Data are presented as mean ± SD from triplicates. B. Relative cell viability of U937 cells treated with various doses of ribonucleosides (adenosine, uridine, cytidine, guanosine) respectively in culture media supplemented with native FBS (left) or heat-inactivated FBS (right). Data are presented as mean ± SD from triplicates. C. Dose- and time-dependent growth inhibition effects of guanosine on leukemia cell lines across different FAB subtypes. Cells were treated with different concentrations of guanosine for 96 hours (upper panel) or 100 μM guanosine for the indicated durations (lower panel). The colors denote different doses or timepoints and the diameter represents relative cell viability based on CellTiter Glo assay. D. CD11b and CD14 expression levels in indicated AML cell lines treated with 100 μM guanosine or PBS control for 96 hours. The percentages of CD11b+ gates and CD14+ gates are shown.
Figure 2
Figure 2
Guanosine induces gene expression program of myeloid differentiation. A. GSEA plot showing enrichment of GO_MYELOID_CELL_DIFFERENTIATION signature after guanosine treatment. The normalized enrichment scores (NES) and adjusted P values are indicated. B. GSEA plot showing enrichment of BROWN_MYELOID_CELL_DEVELOPMENT_UP signature after guanosine treatment. The normalized enrichment scores (NES) and adjusted P values are indicated. C. Heat map showing normalized expression of core enriched genes in guanosine-treated cells with respect to the gene set “BROWN_MYELOID_CELL_DEVELOPMENT_UP”, as well as core enriched genes in PBS controls with respect to the gene set “BROWN_MYELOID_CELL_DEVELOPMENT_DOWN”. D. Pathway analysis of genes upregulated after guanosine treatment. Bars represent -Log10 P values for individual pathways as indicated on the top axis. Dots and curve represent ratio of upregulated genes overlapped with the pathway of interest as indicated on the bottom axis. Pathways are colored and ranked according to Z-score.
Figure 3
Figure 3
Guanosine treatment impairs leukemia cell growth in vivo. (A-C) Luciferase-expressing U937 cells (0.5 × 10⁶ cells per mouse) were first treated with 100 μM guanosine in vitro for 3 days before injection into sub-lethally irradiated NSGS mice. Leukemia cell engraftment was assessed by in vivo bioluminescence imaging (A). Quantitative radiances by bioluminescence on Day 14 post transplantation (B) are shown as box-whisker plots. **P<0.01 as assessed by student’s t test. (C) Kaplan-Meier survival curves of mice. **P<0.01 as assessed by Mantel-Cox log-rank test. (D) CD11b and CD14 expression levels in indicated primary AML cells treated with 100 μM guanosine or PBS control for 96 hours. The percentages of CD11b+ gates and CD14+ gates are shown. (E) Colony formation in methylcellulose of 3 primary AML patient samples treated with 100 μM guanosine for two weeks. Data are normalized to PBS control for each sample and presented as mean ± SD. **P<0.01 as assessed by student’s t test. (F) Schematic illustration of leukemic PDX model transplanted with AML cells from primary specimen AML #1 treated with 100 μM guanosine ex vivo for 3 days. Mice were sacrificed 12 weeks post transplantation and human cells were detected in bone marrow and spleen for assessment of long-term engraftment. (G) Representative CD45 and CD33 expression in bone marrow of NSGS xenografts. (H) Percentage of human CD45+/CD33+ cells in total bone marrow (left) and spleen (right). Data are shown as box-whisker plots. **P<0.01 as assessed by student’s t test.
Figure 4
Figure 4
Guanosine promotes differentiation through intracellular GTP accumulation. (A) Overview of guanine nucleotide synthesis pathway. GMP can be either de novo synthesized starting from ribose 5’-phosphate, or directly salvaged from guanine by HPRT1. Meanwhile, GMP is hydrolyzed by NT5C2 to form guanosine, which is subsequently degraded to guanine by PNP. R-5-P, ribose 5’-phosphate; IMP, inosine monophosphate; XMP, xanthosine monophosphate; GMP, guanosine monophosphate; GDP, guanosine diphosphate; GTP, guanosine triphosphate; IMPDH, IMP dehydrogenase; GMPS, GMP synthetase; PNP, purine nucleoside phosphorylase; HPRT1, hypoxanthine phosphoribosyltransferase 1; NT5C2, 5’-nucleotidase, cytosolic II; GUK1, guanylate kinase 1; NME, NME/NM23 nucleoside diphosphate kinase. (B) AML cell lines were treated with 100 μM guanosine or PBS control for 72 hours. Intracellular GTP levels were quantified by HPLC/MS. For each cell line, data are presented as mean ± SD from duplicates. Numbers denote the fold change relative to controls. **P<0.01 as assessed by student’s t test. (C) Heat map showing relative abundance of metabolites involved in purine metabolism. U937 cells were treated with 100 μM guanosine or PBS control for 12 hours and harvested for targeted HPLC-MS/MS. Z-score normalized intensities from duplicates are shown. (D) Fractional labeling of GMP, GDP and GTP in guanosine-treated or control U937 cells cultured in media containing [amide-15N] glutamine for 12 hours. M+3 was the dominant labeled form. Data are presented as mean ± SD from duplicates. *P<0.05, **P<0.01 as assessed by student’s t test. (E) U937 cells were electroporated with nucleofector solution containing different concentrations of GTP (GTPlow denotes 12.5 mM, GTPhigh denotes 25 mM) or vehicle control. Cells were washed with PBS and collected at 4 hours after electroporation, and intracellular GTP levels were quantified by HPLC/MS. Data are presented as mean ± SD from duplicates. **P<0.01, one-way ANOVA with Sidak’s multiple comparison test. (F) Representative CD11b expression levels of U937 cells electroporated with different concentrations of GTP as indicated above and incubated in heat-inactivated media for 96 hours. Mean fluorescence intensity (MFI) was indicated in histograms. (G) U937 cells were treated with PBS, guanosine (100 μM), forodesine (1 μM) or combination for 72 hours. Intracellular GTP levels were quantified by HPLC/MS. Data are presented as mean ± SD from duplicates. **P<0.01, one-way ANOVA with Sidak’s multiple comparison test. (H, I) Representative CD11b expression levels (H) and relative cell viability (I) of U937 cells treated with PBS, guanosine (100 μM), forodesine (1 μM) or combination for 96 hours. For cell viability, data are presented as mean ± SD from triplicates. **P<0.01, one-way ANOVA with Sidak’s multiple comparison test.
Figure 5
Figure 5
Genetic knockout of PNP reverses guanosine-elicited differentiation. A. Expression profiling for PNP across a panel of 604 cancer cell lines (including 35 AML cell lines) from CCLE. Data are presented as box-whisker plots where the mean, the minimum, and the maximum are indicated. B. Western blots of PNP in Cas9-expressing U937 cell clones transduced with lentiviral vectors expressing PNP-directed sgRNA (sgPNP). Bulk cells transduced with non-targeting sgRNA (sgControl) were served as the control. C. sgControl-transduced bulk cells and two validated sgPNP-transduced cell clones were treated with 100 μM guanosine or PBS control for 72 hours. Intracellular GTP levels were quantified by HPLC/MS. Data are presented as mean ± SD from duplicates. ns, not significant; **P<0.01 as assessed by student’s t test. D. Representative CD11b expression levels of U937-sgControl cells or U937 PNP KO cells treated with 100 μM guanosine or PBS control for 96 hours. MFI was indicated in histograms.
Figure 6
Figure 6
Guanosine-caused GTP accumulation depends on HPRT1-mediated salvage synthesis. (A) Pearson correlation coefficients of mRNA abundance between PNP and other transcripts of genes in guanine nucleotide salvage pathways from a panel of 44 AML cell lines. Dashed lines demarcate P=0.05 for linear regression. (B) Pearson correlation of PNP and HPRT1 expression as indicated in (A). (C) Western blots of HPRT1 in Cas9-expressing U937 cell clones transduced with lentiviral vectors expressing HPRT1-directed sgRNA (sgHPRT1). Bulk cells transduced with non-targeting sgRNA (sgControl) were served as the control. (D) sgControl-transduced bulk cells and two validated sgHPRT1-transduced cell clones were treated with 100 μM guanosine or PBS control for 72 hours. Intracellular GTP levels were quantified by HPLC/MS. Data are presented as mean ± SD from duplicates. ns, not significant; **P<0.01 as assessed by student’s t test. (E) Representative CD11b expression levels of U937-sgControl cells or U937 HPRT1 KO cells treated with 100 μM guanosine or PBS control for 96 hours. MFI was indicated in histograms.

Similar articles

Cited by

References

    1. Short NJ, Rytting ME, Cortes JE. Acute myeloid leukaemia. Lancet. 2018;392:593–606. - PMC - PubMed
    1. Talati C, Sweet K. Recently approved therapies in acute myeloid leukemia: a complex treatment landscape. Leuk Res. 2018;73:58–66. - PubMed
    1. Papaemmanuil E, Gerstung M, Bullinger L, Gaidzik VI, Paschka P, Roberts ND, Potter NE, Heuser M, Thol F, Bolli N, Gundem G, Van Loo P, Martincorena I, Ganly P, Mudie L, McLaren S, O’Meara S, Raine K, Jones DR, Teague JW, Butler AP, Greaves MF, Ganser A, Döhner K, Schlenk RF, Döhner H, Campbell PJ. Genomic classification and prognosis in acute myeloid leukemia. N Engl J Med. 2016;374:2209–2221. - PMC - PubMed
    1. de Thé H. Differentiation therapy revisited. Nat Rev Cancer. 2018;18:117–127. - PubMed
    1. Lewis AC, Kats LM. Non-genetic heterogeneity, altered cell fate and differentiation therapy. EMBO Mol Med. 2021;13:e12670. - PMC - PubMed

LinkOut - more resources