. 2022 Feb 5;14(1):e12251.
doi: 10.1002/dad2.12251. eCollection 2022.

Plasma microRNA vary in association with the progression of Alzheimer's disease

Affiliations

Plasma microRNA vary in association with the progression of Alzheimer's disease

Diane Guévremont et al. Alzheimers Dement (Amst). .

Abstract

Introduction: Early intervention in Alzheimer's disease (AD) requires the development of an easily administered test that is able to identify those at risk. Focusing on microRNA robustly detected in plasma and standardizing the analysis strategy, we sought to identify disease-stage specific biomarkers.

Methods: Using TaqMan microfluidics arrays and a statistical consensus approach, we assessed plasma levels of 185 neurodegeneration-related microRNA, in cohorts of cognitively normal amyloid β-positive (CN-Aβ+), mild cognitive impairment (MCI), and Alzheimer's disease (AD) participants, relative to their respective controls.

Results: Distinct disease stage microRNA biomarkers were identified, shown to predict membership of the groups (area under the curve [AUC] >0.8) and were altered dynamically with AD progression in a longitudinal study. Bioinformatics demonstrated that these microRNA target known AD-related pathways, such as the Phosphoinositide 3-kinase (PI3K-Akt) signalling pathway. Furthermore, a significant correlation was found between miR-27a-3p, miR-27b-3p, and miR-324-5p and amyloid beta load.

Discussion: Our results show that microRNA signatures alter throughout the progression of AD, reflect the underlying disease pathology, and may prove to be useful diagnostic markers.

Keywords: Alzheimer's disease; biomarker; disease progression; early diagnostic; microRNA; plasma.


Conflict of interest statement

Helen Tsui: nothing to disclose Chris J. Fowler: nothing to disclose Colin L. Masters: nothing to disclose Ralph N. Martins: nothing to disclose Nicholas J. Cutfield: Attended conferences and workshops for which costs were subsidized, but received no direct payments. Allergan‐sponsored Movement disorders injectors workshop, Hamilton NZ (2019); Biogen and Roche‐sponsored Multiple Sclerosis meetings (2018, 2019, 2020), (2019); Biogen‐sponsored Multiple Sclerosis ATLAS meeting, Sydney Australia; Sanofi American Academy of Neurology meeting, California, USA.

Figures

FIGURE 1
FIGURE 1
Heat map showing microRNA expression profiles in cognitively normal amyloid positive (CN‐Aβ+), mild cognitive impairment (MCI), and Alzheimer'd disease (AD) cross‐sectional cohorts. A statistically significant expression of microRNA was identified in each cohort using empirical‐Bayes moderated t‐tests (*; P < .05), based on log2 mean‐fold changes relative to CN. The microRNA that were differentially expressed in at least one cohort are presented in the heat map as green/upregulated or red/downregulated. Each column represents a different disease stage or cohort (number of participants in parenthesis) and each row represents a single microRNA. Data were processed using GraphPad Prism v8.
FIGURE 2
FIGURE 2
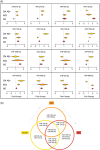
Forest plots showing the weighted fold‐change of 16 microRNA highlighted following meta‐analysis as potential biomarkers in the CN‐Aβ+, MCI, and AD cross‐sectional cohorts. (A) The linear mixed‐effects model included CN‐Aβ+ (n = 21), and pooled results for the MCI (n = 74) and AD (n = 63) cohorts. Observed outcomes for each disease stage are represented with a diamond (CN‐Aβ+ = gold, MCI = orange, AD = crimson). The width of the diamond reflects the precision of the estimate (95% CI); the weights correspond to the inverse standard deviations of the effect size estimates from the studies; the position on the x‐axis represents the measure estimate, with the vertical line indicating “no change” in microRNA expression. A positive effect size represents upregulation and a negative effect size represents downregulation. Data are relative to CN groups. Summary estimates are provided in Table S4. (B) Venn showing the association of the 16 microRNA retained after the meta‐analyses with disease stage.
FIGURE 3
FIGURE 3
Consensus ranking of microRNA and diagnostic value of disease‐stage–specific putative biomarker signatures. Each of the 16 microRNA identified in the meta‐analysis were ranked using three independent criteria. The three rankings per microRNA were then summed to provide a final rank. Lower total rank sums were given the highest ranking. The three ranking criteria used were (1) differential expression (P‐value; refer Table S3), (2) distribution of normalized Ct values (log‐rank tests; P‐values; refer Table S4), and (3) predictive power (AUC from logistic regression). The signature and results of each ROC analysis are shown in (A). The diagnostic ability of each derived signature was assessed by computing the AUC value of the ROC curve (logistic regression with normalized Ct values), compared to the CN group (B).
FIGURE 4
FIGURE 4
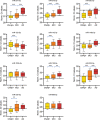
Box and whisker plots showing microRNA expression in the AIBL longitudinal cohort. Expression of biomarker microRNA (Figure 3) was studied in the AIBL longitudinal cohort (n = 21; CN‐Aβ+ to MCI stage and n = 18 MCI to AD stage; total MCI = 39). Y‐axis shows the normalized Ct values where high values = low expression. The lines within the boxes show the median microRNA expression (normalized Ct values) and the whiskers represent the 95% CI. Statistically significant differences were identified using generalized estimating equations (* P < .05; ** P < .01; *** P < .001). The hashed line indicates the median values in the AIBL CN group, and these data were not included in this longitudinal analysis.

References

    1. Stocker H, Möllers T, Perna L, Brenner H. The genetic risk of Alzheimer's disease beyond APOE ε4: systematic review of Alzheimer's genetic risk scores. Translational Psychiatr. 2018;8(1):166. - PMC - PubMed
    1. Moreno‐Grau S, de Rojas I, Hernández I, et al. Genome‐wide association analysis of dementia and its clinical endophenotypes reveal novel loci associated with Alzheimer's disease and three causality networks: the GR@ACE project. Alzheimer's & Dement: J Alzheimer's Assoc. 2019;15(10):1333‐1347. - PubMed
    1. Blennow K, Mattsson N, Schöll M, Hansson O, Zetterberg H. Amyloid biomarkers in Alzheimer's disease. Trends in Pharmacol Sci. 2015;36(5):297‐309. - PubMed
    1. Chételat G, Villemagne VL, Villain N, et al. Accelerated cortical atrophy in cognitively normal elderly with high β‐amyloid deposition. Neurol. 2012;78(7):477‐484. - PubMed
    1. Nakamura A, Kaneko N, Villemagne VL, et al. High performance plasma amyloid‐β biomarkers for Alzheimer's disease. Nature. 2018;554(7691):249‐254. - PubMed