. 2022 Jan 12;25(2):103759.
doi: 10.1016/j.isci.2022.103759. eCollection 2022 Feb 18.

Upregulation of CD14 in mesenchymal stromal cells accelerates lipopolysaccharide-induced response and enhances antibacterial properties

Affiliations

Upregulation of CD14 in mesenchymal stromal cells accelerates lipopolysaccharide-induced response and enhances antibacterial properties

Matthew P Hirakawa et al. iScience. .

Abstract

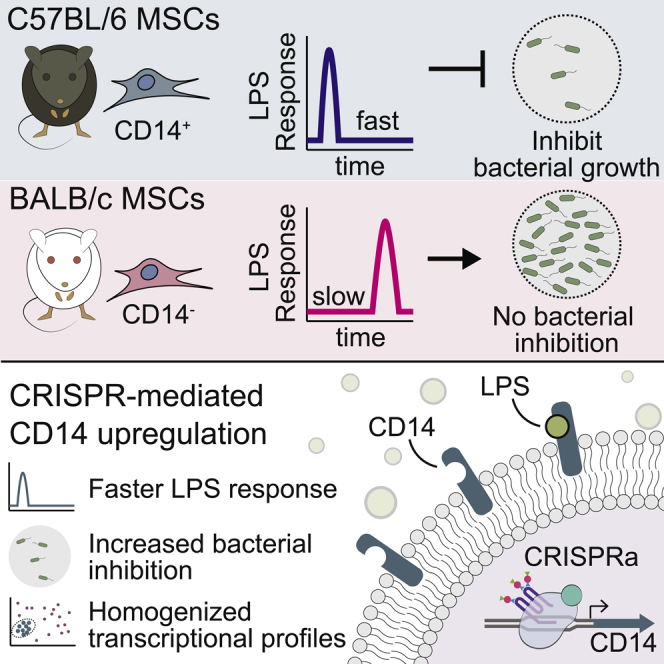
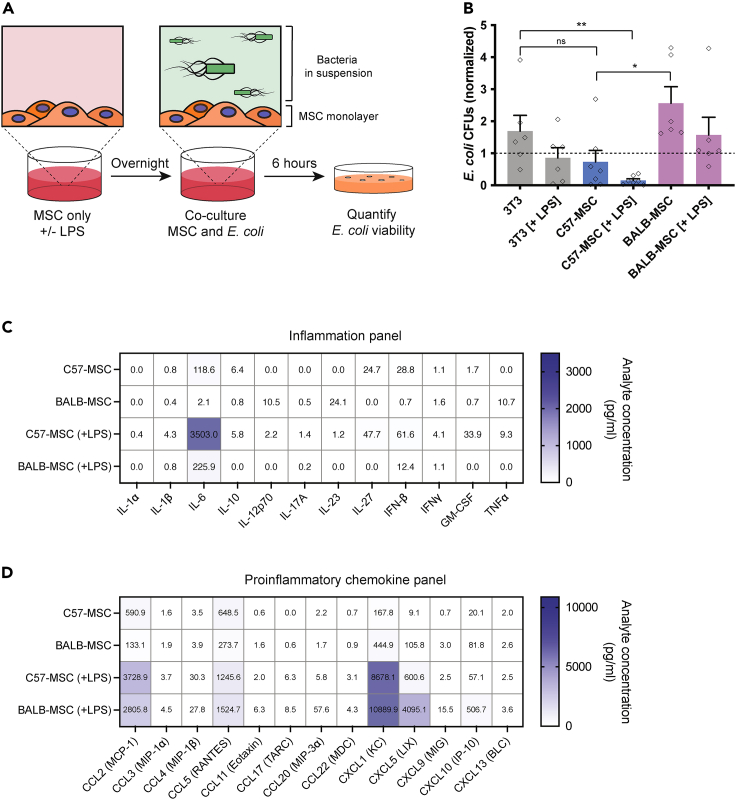
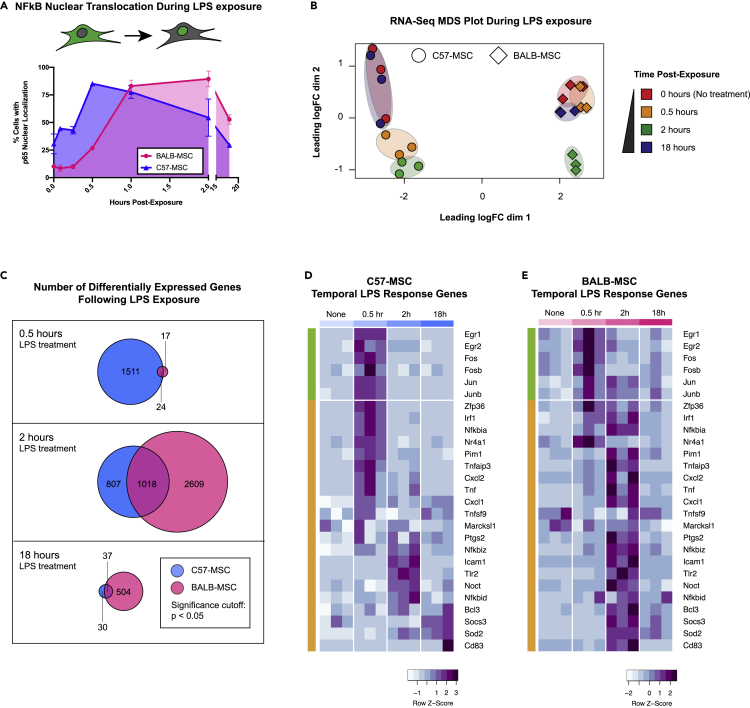
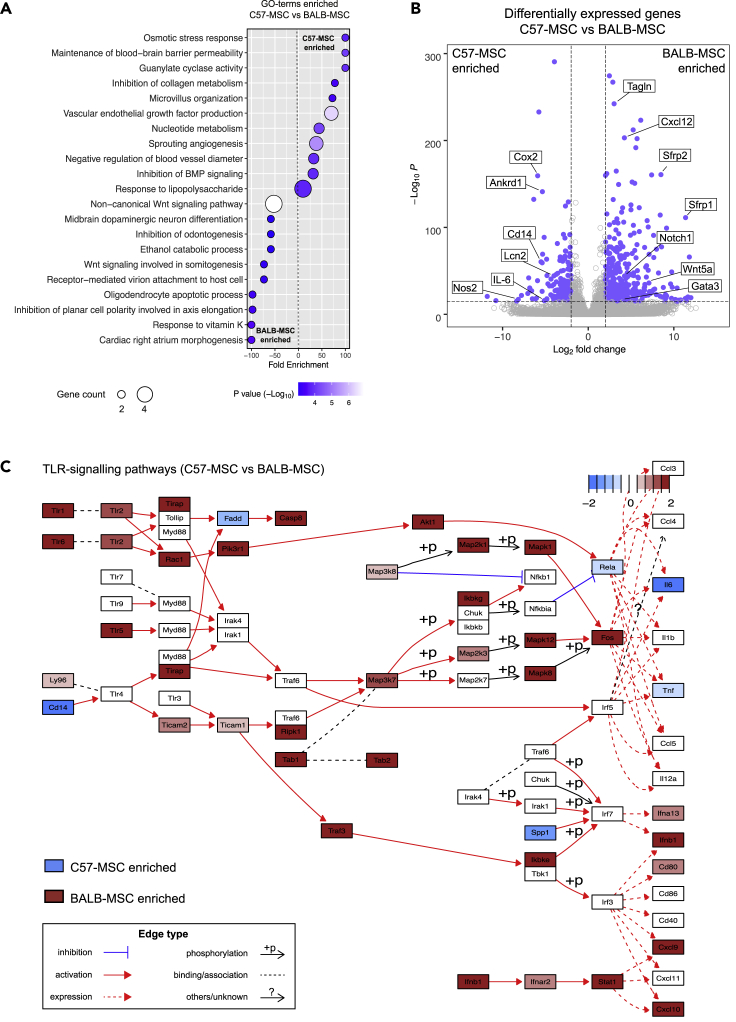
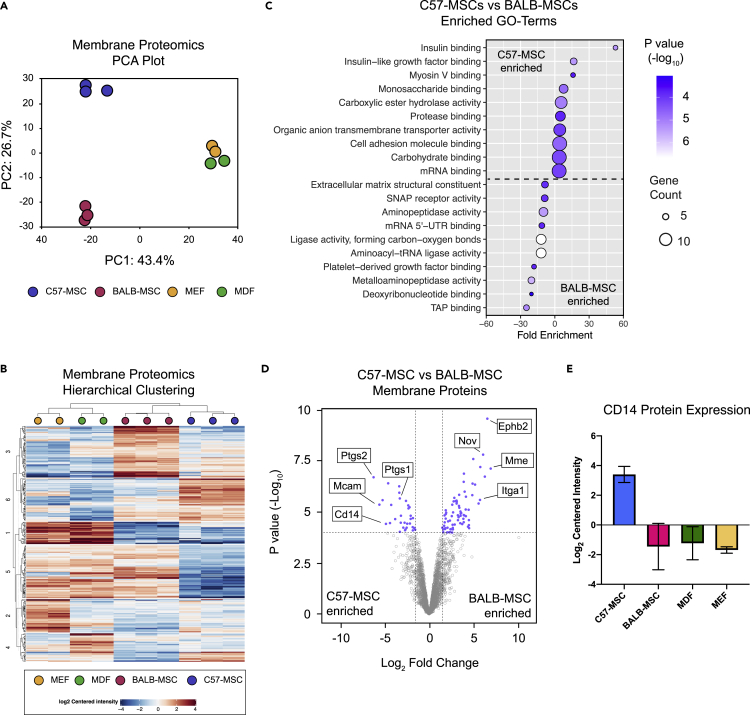
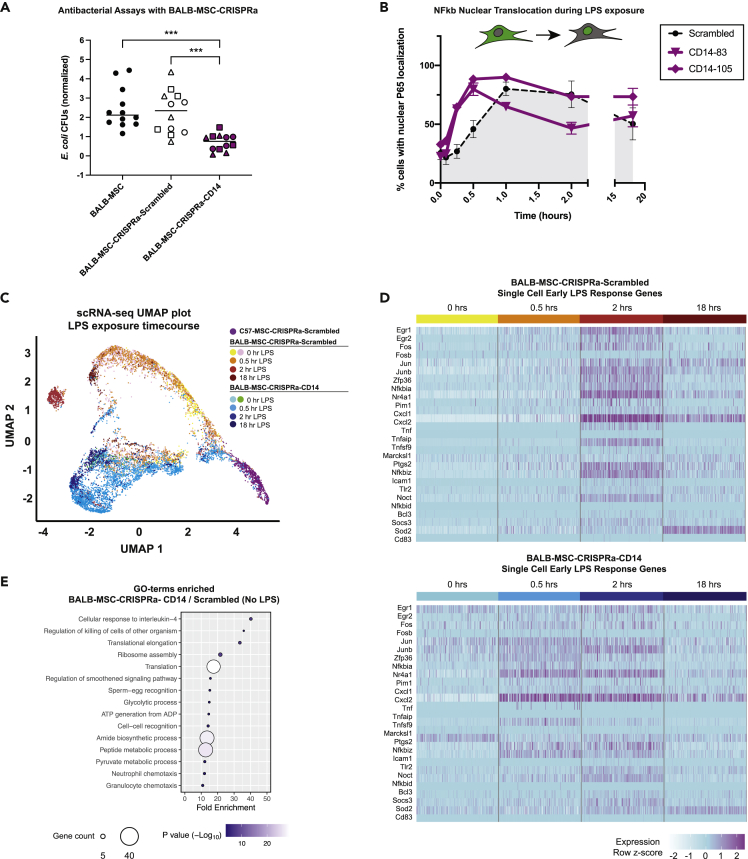
Mesenchymal stromal cells (MSCs) have broad-ranging therapeutic properties, including the ability to inhibit bacterial growth and resolve infection. However, the genetic mechanisms regulating these antibacterial properties in MSCs are largely unknown. Here, we utilized a systems-based approach to compare MSCs from different genetic backgrounds that displayed differences in antibacterial activity. Although both MSCs satisfied traditional MSC-defining criteria, comparative transcriptomics and quantitative membrane proteomics revealed two unique molecular profiles. The antibacterial MSCs responded rapidly to bacterial lipopolysaccharide (LPS) and had elevated levels of the LPS co-receptor CD14. CRISPR-mediated overexpression of endogenous CD14 in MSCs resulted in faster LPS response and enhanced antibacterial activity. Single-cell RNA sequencing of CD14-upregulated MSCs revealed a shift in transcriptional ground state and a more uniform LPS-induced response. Our results highlight the impact of genetic background on MSC phenotypic diversity and demonstrate that overexpression of CD14 can prime these cells to be more responsive to bacterial challenge.

Keywords: Cell biology; Molecular biology; Omics.


Conflict of interest statement

The authors do not have any competing interests to report.

Figures

None
Graphical abstract
Figure 1
Figure 1
MSCs from different genetic backgrounds have distinct antibacterial properties (A) Cartoon depicting the antibacterial assays used in this study. MSCs were incubated overnight with or without lipopolysaccharide (LPS) from E. coli (100 ng/mL) and were then co-cultured with E. coli strain K12 for 6 h. After 6 h of co-culture, E. coli abundance in the media was quantified using colony-forming unit (CFU) assays. (B) Quantification of E. coli CFUs following 6-h co-culture with different cell types +/− LPS treatment. E. coli CFU values from co-culture experiments were normalized to controls in which E. coli was grown side-by-side in monoculture (n = 5 biological replicates per condition; statistical significant determined using t test; ∗p < 0.05; ∗∗p < 0.01; individual data points are shown and bar graphs represent the mean with error bars = SEM). (C and D) Cytokine profiling of C57-MSC and BALB-MSC conditioned media with or without LPS-priming using BioLegend LEGENDplex bead-based immunoassays with the mouse inflammation panel or (D) proinflammatory chemokine panel. Samples were analyzed 18-h post-LPS-exposure, and the values shown on heatmap are the mean of at least two biological replicates.
Figure 2
Figure 2
Differential response rates to LPS between MSCs from different genetic backgrounds (A) Quantification of NF-κB nuclear translocation assays using p65 staining and high-throughput imaging (>1000 cells analyzed per replicate; n = 3 biological replicates; error bars represent SD). (B) MDS plot depicting transcriptional profiles of C57-MSCs and BALB-MSCs at time points post-LPS-exposure (0, 0.5, 2, and 18 h). (C) Numbers of differently expressed genes at different time points post-LPS-exposure compared with corresponding untreated cells. (D and E) Heatmap depicting temporal expression of immediate early genes (green bars) and primary LPS response (orange bars) in C57-MSC and BALB-MSC at time points post-LPS-exposure (immediate-early genes and primary LPS response genes were previously defined (Bahrami and Drablos, 2016; Fowler et al., 2011; Ramirez-Carrozzi et al., 2009). For each time point analyzed, three biological replicates were sequenced and are depicted by sub-columns in the heatmap.
Figure 3
Figure 3
Comparative transcriptional analyses of MSC types using RNA-seq (A) RNA-seq data from C57-MSCs and BALB-MSCs were examined for differential gene expression using DeSeq2 (Love et al., 2014). Genes that were upregulated in C57-MSCs compared with BALB-MSCs (fold change >2, adjust p < 0.05) were inputted into the PANTHER GO Enrichment Analysis to find biological processes that were enriched in C57-MSCs. The same process was also performed to identify GO-terms associated with genes upregulated in BALB-MSCs. (B) Volcano plot depicting differentially expressed genes between C57-MSCs and BALB-MSCs and highlighting notable genes of interest (blue dots represent genes with fold change >2 and adjusted p-value < 10−16). (C) Pathway analysis visualization of comparative gene expression between C57-MSCs (blue) and BALB-MSCs (red) of TLR-signaling pathways.
Figure 4
Figure 4
Characterization of cell membrane protein differences between cell types using quantitative proteomics MSCs and fibroblasts were grown in standard culture conditions, and membrane proteins were analyzed using LC-MS/MS (A) PCA plot depicting membrane protein profiles of MSC and fibroblast cell types (n = 3 biological replicates for MSCs and n = 2 biological replicates for MEF and MDF). (B) Heatmap utilizing hierarchical clustering showing expression level differences of membrane proteins. (C) GO-term enrichment analysis of differentially expressed membrane proteins between C57-MSCs and BALB-MSCs. MSC membrane proteins were quantified using LC-MS/MS and analyzed for differential protein expression using the DEP R package (Zhang et al., 2018). (D) Volcano plot highlighting significantly differentially expressed proteins between C57-MSCs and BALB-MSCs and notable proteins of interest (blue dots represent proteins with fold change >2 and adjusted p-value < 10−4). (E) Protein expression levels of the LPS-receptor CD14 across the cell types examined in this study (n = 3 biological replicates for C57- and BALB-MSCs and two biological replicates for MDFs and MEFs; data are represented as mean +/− SD).
Figure 5
Figure 5
Antibacterial and single-cell transcriptional analyses of BALB-MSCs overexpressing endogenous CD14 via CRISPRa (A) E. coli CFUs after 6 h co-cultured with wild-type or BALB-MSC-CRISPRa cells. E. coli CFUs from co-cultures were normalized to E. coli monoculture CFU controls performed alongside each replicate. Three different sgRNAs were tested in CRISPRa MSCs, and the data from distinct sgRNAs are depicted by different shapes (for scrambled sgRNAs: circle = nontargeting sgRNA 1, square = nontargeting sgRNA 2, triangle = nontargeting sgRNA 3. For CD14 sgRNAs: circle = CD14-83, square = CD14-105, triangle = CD14-13). Lines are drawn at mean, and statistical significance was determined by t test; ∗∗∗, p < 0.001. (B) Nuclear translocation of NF-κB during LPS-exposure using p65 immunostaining and quantitative microscopy in BALB-MSC-CRISPRa cells expressing a scrambled sgRNA or CD14 sgRNAs (scrambled sgRNA = nontargeting control one; n = at least three biological replicates per sample). (C) UMAP plot depicting single-cell transcriptional profiles of MSCs during LPS-exposure (scrambled sgRNA = nontargeting control one; CD14 sgRNA = CD14-83). Single-cell RNA-seq of BALB-MSC overexpressing CD14 during LPS-exposure was prepared using the 10x Genomics Chromium platform followed by Illumina sequencing. (D) Heatmap of early LPS response gene expression in 100 individual BALB-MSC-CRISPRa cells expressing either scrambled control sgRNA (top) or CD14 sgRNA (bottom). Each sub-column represents gene expression level in an individual cell. (E) GO-terms enriched from significantly upregulated genes identified BALB-MSC-CRISPRa-CD14 when compared with BALB-MSC-CRISPRa-Scrambled in the absence of LPS-exposure.

Similar articles

Cited by

References

    1. Ackerman W.E.T., Summerfield T.L., Vandre D.D., Robinson J.M., Kniss D.A. Nuclear factor-kappa B regulates inducible prostaglandin E synthase expression in human amnion mesenchymal cells. Biol. Reprod. 2008;78:68–76. - PubMed
    1. Alcayaga-Miranda F., Cuenca J., Khoury M. Antimicrobial activity of mesenchymal stem cells: current status and new perspectives of antimicrobial peptide-based therapies. Front. Immunol. 2017;8:339. - PMC - PubMed
    1. Alcayaga-Miranda F., Cuenca J., Martin A., Contreras L., Figueroa F.E., Khoury M. Combination therapy of menstrual derived mesenchymal stem cells and antibiotics ameliorates survival in sepsis. Stem Cell Res. Ther. 2015;6:199. - PMC - PubMed
    1. Ashburner M., Ball C.A., Blake J.A., Botstein D., Butler H., Cherry J.M., Davis A.P., Dolinski K., Dwight S.S., Eppig J.T., et al. Gene ontology: tool for the unification of biology. The gene ontology consortium. Nat. Genet. 2000;25:25–29. - PMC - PubMed
    1. Bahrami S., Drablos F. Gene regulation in the immediate-early response process. Adv. Biol. Regul. 2016;62:37–49. - PubMed