Review
. 2023 Jun;36(6):e4710.
doi: 10.1002/nbm.4710. Epub 2022 Mar 3.

MR fingerprinting for semisolid magnetization transfer and chemical exchange saturation transfer quantification

Affiliations
Review

MR fingerprinting for semisolid magnetization transfer and chemical exchange saturation transfer quantification

Or Perlman et al. NMR Biomed. 2023 Jun.

Abstract

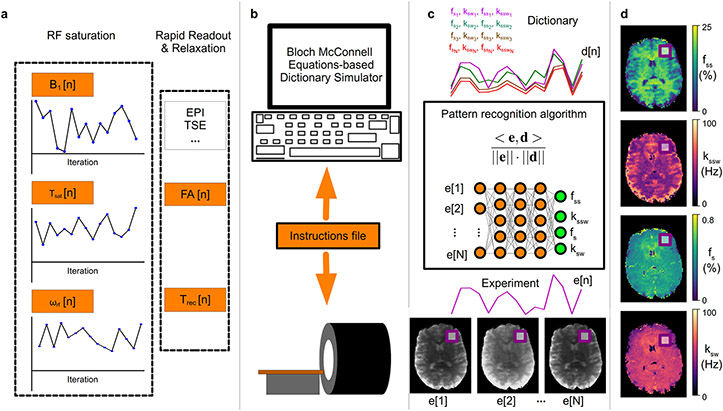
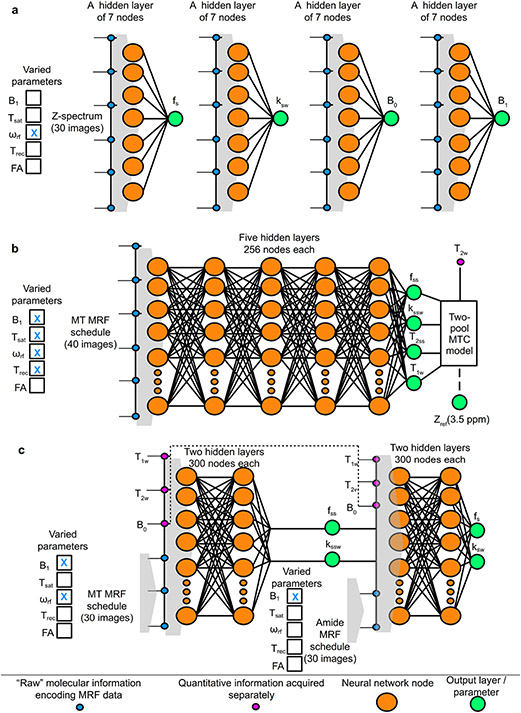
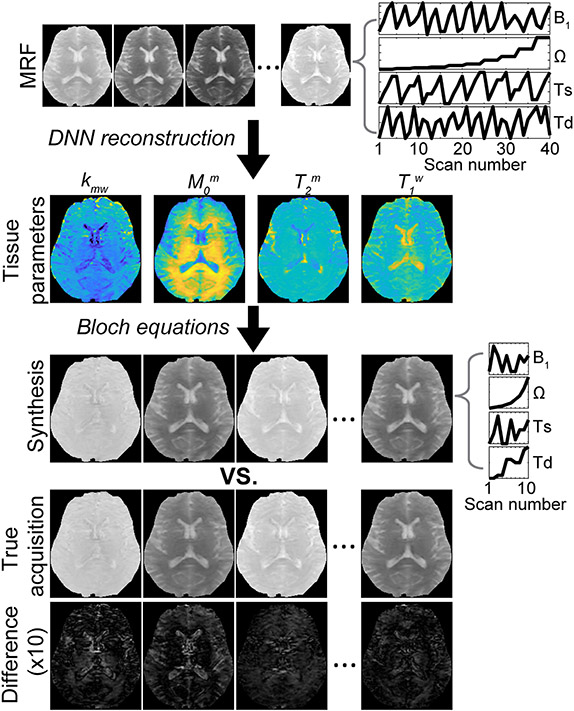
Chemical exchange saturation transfer (CEST) MRI has positioned itself as a promising contrast mechanism, capable of providing molecular information at sufficient resolution and amplified sensitivity. However, it has not yet become a routinely employed clinical technique, due to a variety of confounding factors affecting its contrast-weighted image interpretation and the inherently long scan time. CEST MR fingerprinting (MRF) is a novel approach for addressing these challenges, allowing simultaneous quantitation of several proton exchange parameters using rapid acquisition schemes. Recently, a number of deep-learning algorithms have been developed to further boost the performance and speed of CEST and semi-solid macromolecule magnetization transfer (MT) MRF. This review article describes the fundamental theory behind semisolid MT/CEST-MRF and its main applications. It then details supervised and unsupervised learning approaches for MRF image reconstruction and describes artificial intelligence (AI)-based pipelines for protocol optimization. Finally, practical considerations are discussed, and future perspectives are given, accompanied by basic demonstration code and data.

Keywords: CEST; MR fingerprinting (MRF); MT; chemical exchange rate; deep learning; pH; quantitative imaging; unsupervised learning.


Conflict of interest statement

Conflict of Interest

The authors declare the following competing interests: CTF hold a patent for a CEST MR fingerprinting method (patent no. US10,605,877).

Figures

Figure 1.
Figure 1.. General pipeline of a semisolid MT/CEST MRF experiment.
a. Initially, a pseudo-random imaging protocol is designed, where at least one acquisition parameter is being varied, to produce a set of N images. Importantly, a pre-saturation block needs to be implemented, where at least the saturation pulse power (B1), duration (Tsat), or frequency offset (ωrf) should vary, for sufficient encoding of the chemical exchange parameters. The protocol typically includes a rapid readout, e.g., using EPI or turbo spin echo, with either a fixed or varied flip angle (FA) and recovery time (Trec). b. The designed protocol is then loaded into a computerized Bloch-McConnell equations-based signal simulator, which produces the signal trajectories expected for a large number of tissue parameter combinations. The same CEST-MRF acquisition protocol is fed as an instruction file to the MRI scanner, allowing the acquisition of N molecular information encoding images, where each pixel series comprises an experimentally acquired trajectory (e[1] – e[N]). c. Each trajectory (e[n]) is then compared to all dictionary entries (d[n]), via a pattern recognition algorithm (such as the dot-product metric) for the determination of the best match. Importantly, this step can be accelerated and improved using a deep neural-network. d. Finally, simultaneous pixel-wise quantification of the proton exchange rates (k), and volume fractions (f) for a single or several metabolite/protein/lipid pools of interest can be made, based on the neural network output, or the best-matched dictionary entry.
Figure 2.
Figure 2.. Disentangling proton exchange rate and concentration using CEST-MRF.
(a and d) Proton density images of L-arginine phantoms with varying concentrations (top row) and pH (bottom row) along with the associated quantitative chemical exchange rate (b and e) and L-arginine concentration (c and f) maps generated from MRF dot-product matching. The CEST-MRF reconstruction was able to correctly detect and quantify the different proton exchange rates and concentrations. Reproduced and modified with permission from Cohen et al., Magn Reson Med. 2018;80:2449-2463.
Figure 3.
Figure 3.. Semisolid MT correction for CEST-MRF.
(A) Reference dictionary (solid) and reference signal (dashed) are different in the presence of the semisolid MT effect. (B) Signal attenuation due to the semisolid MT effect can be estimated by comparing the reference dictionary and reference signal. (C) The label dictionary is generated by simulating 2-pool Bloch-McConnell equations with known T1 and T2 values. (D) The corrected label dictionary can be generated by adding the semisolid MT effect (B) to the dictionary (C). Reproduced with permission from Zhou et al., Magn Reson Med. 2018;80(4):1352-1363.
Figure 4.
Figure 4.. Quantitative proton exchange parameter maps of ammonium chloride (NH4Cl) phantoms and a healthy human volunteer obtained using dictionary-free CEST-MRF..
a. CEST phantom validation experiments. MTRasym (2.5 ppm) maps with RF saturation powers of 1, 1.5, 2, 2.5, and 3 μT. A phantom with four compartments: (1) pH 4.5, 0.5M NH4Cl + 1% agarose + PBS, (2) pH 5.0, 0.5 M NH4Cl + 1% agarose + PBS, (3) pH 4.6, 1 M NH4Cl +1% agarose + PBS, and (4) pH 7.0, 1% agarose + PBS. RF saturation power dependencies of the direct water saturation, semisolid MTC, and CEST signals can be seen clearly in the MTRasym (2.5 ppm) maps. b. CEST exchange rate (ksw) and concentration (M0s) maps of the phantom from the dictionary-free CEST-MRF. c. Quantitative semisolid MT exchange rate (kmw) and concentration (M0m), and amide proton exchange rate (ksw) and concentration (M0s) maps of a healthy volunteer human brain. Reproduced and modified with permission from Heo et al. Neuroimage. 2019;189:202-213.
Figure 5.
Figure 5.. Supervised machine learning architectures for semisolid MT/CEST MRF.
a. Quantification of phosphocreatine (pCr) exchange parameters using an artificial NN composed of a single hidden layer. The input layer was fed with Z-spectrum measurements (analogous to a CEST-MRF schedule where the varied parameter is the saturation pulse frequency offset (ωrf), and the output was either the pCr proton volume fraction (fs), exchange rate (ksw), (B0), or transmit field (B1). The NN had 4 variants that were fed with the same input but trained to output each of the 4 different sought-after parameters, using a simulated dictionary. b. Brain semisolid MT exchange parameter quantification and background semisolid MT (Zref) contrast image synthesis, using a fully connected neural network. The input MRF schedule varied the saturation pulse power (B1), duration (Tsat), ωrf, and the recovery time (Trec). The output included the semisolid MT parameters, and a synthesized MT reference image at 3.5 ppm, calculated by plugging in the resulting parameters and the water T2-values obtained from a separate protocol in the two-pool BM equations solution. c. Sequential and deep CEST and semisolid MT quantification in the brain. A semisolid MT-oriented MRF acquisition schedule, which varies ωrf and B1, yields 30 images that are fed volxelwise into the first NN, together with the quantitative water pool and field homogeneity maps (T1, T2, B0). This NN map the semisolid MT pool exchange parameters, which are then fed, together with the previously obtained quantitative data into the second NN, ultimately yielding the amide proton fs and ksw.
Figure 6.
Figure 6.. Phosphocreatine concentration mapping in the exercised human leg muscle.
a. T2-weighted anatomy image. b. Phosphocreatine concentration maps obtained by ANNCEST are in good agreement with the dynamics observed using 31P 2D MRS (c). Reproduced and modified from Chen et al., Nat Commun 2020;11:1-10.
Figure 7.
Figure 7.. Quantitative imaging of apoptosis following oncolytic virotherapy using sequential and deep semisolid MT/CEST MRF.
a. Conventional T2-weighted image of an oncolytic virotherapy treated mouse, 72 hours post virus inoculation, is incapable of detecting treatment responsive apoptotic regions. b. Semisolid macro-molecules proton volume fraction (fss) map, where a decreased volume-fraction represents tumor-related edema and a change in the lipid composition of tumor tissue relative to normal brain tissue. c. Amide proton exchange-rate (ksw) and d. volume fraction (fs) maps. Regions of decreased intracellular pH and mobile protein concentration, respectively, are indicative of apoptosis. e-h. Histology and immunohistochemistry images validate the MR findings with cleaved caspase-3 positive tumor regions and decreased Coomassie blue protein staining, indicative of apoptosis, colocalizing with the regions of decreased exchange rate and mobile protein concentration. Reproduced with permission from Perlman et al. Nat Biomed Eng. 2021;1-10. https://doi.org/10.1038/s41551-021-00809-7.
Figure 8.
Figure 8.. Unsupervised machine learning approach for semisolid MT/CEST MRF.
The raw MRF images are given as input to an 8-layer CNN, yielding quantitative semisolid MT exchange parameter and water T1 maps. Gray boxes represent feature spaces with the depth of the spaces indicated above each box. Colored arrows show the receptive field size of the kernel and the activation function. The estimated quantitative maps, the MRF schedule parameters, and a separately acquired water T2 map are plugged into the BM equations analytical solution, generating an estimation of the original semisolid MT MRF raw images. These output images are compared to the experimentally acquired raw MRF data (using the L2 loss function), allowing for the optimization of the semisolid MT parameter maps. Reproduced and modified with permission from Kang et al. Magn Reson Med. 2021;85:2040-2054.
Figure 9.
Figure 9.. Comparing different CEST-MRF acquisition schedules.
A phantom containing three vials of 50 mM L-arginine at pH 4, 4.5, and 5 was imaged using a 9.4T scanner. The dot-product matched L-arg concentration (d-f) and amine proton exchange rate (g-i) are shown for three different acquisition schedules, including the random acquisition schedule used in Coehn et al. (left column); a different random acquisition schedule of similar length (center column), which also varied the saturation pulse duration, the repetition time, and the readout flip angle; and a schedule based on a z-spectrum obtained using a fixed saturation power of 2uT, at 7 to −7 ppm with 0.25 increments (right column).
Figure 10.
Figure 10.. Dependence of the discrimination loss on the acquisition parameters used in CEST-MRF.
The surface plots with projected loss iso-contours describe the effect of the maximal saturation power (B1max) and the saturation time (Tsat) (a-b) or the flip angle (FA) and TR (c-d) on the loss, for a 3-pool water/amide/semisolid MT imaging scenario (a, c) and a 2-pool scenario with a dilute solute in the medium to fast exchange rate regime (b, d). In all images, the z-axis represents the loss (lower values indicate improved parameter discrimination ability), which is also color coded from blue to yellow. The optimal combination for each examined parameter pair is given in the surface plot. (e-h). A similar analysis was performed using the Euclidean distance instead of the dot-product reconstruction metric with an Euclidean distance based loss function. Note the different optimal parameters obtained. Reproduced and modified with permission from Perlman et al. Magn Reson Med. 2020;83:462-478.
Figure 11.
Figure 11.. An end-to-end AI-based framework for automatic optimization of semisolid MT/CEST MRF acquisition protocols and quantitative deep reconstruction (AutoCEST).
a. Schematic representation of the optimization pipeline. A broadly defined tissue-parameter scenario serves as input to the pipeline which consists of sequential simulations of the CEST saturation (purple), readout and recovery (green), and deep reconstruction (yellow). AutoCEST outputs an optimized acquisition schedule and a reconstruction network (orange). b. CEST saturation block as a computational graph. The blue rectangles represent the input tissue parameters: initial magnetization (M0), water relaxation rates (R1a, R2a), solute transverse relaxation (R2b), exchange-rate (kb), and volume fraction (fb). The orange rectangles represent the dynamically updated protocol parameters: saturation time (Tsat), saturation power (ω1), and saturation frequency offset (ωrf). The graph calculates the magnetization at the end of the saturation block Mz[n+]. c. Bloch equation-based image readout as a computational graph. The blue rectangles represent the water-pool parameters, while the orange rectangles represent the dynamically updated protocol parameters: flip angle (FA) and recovery time (Trec), which is embedded in the appropriate relaxation step. Note that this is a partial display due to space limitations. d. Deep reconstruction network for decoding the “ADC” MR signals (purple circles), obtained at c into CEST quantitative parameters (fb and kb, blue circles). Reproduced from Perlman et al. Magn. Reson. Med. 2022.
Figure 12.
Figure 12.. A schematic of the learning-based optimization of the acquisition schedule (LOAS).
Semisolid MT-MRF signals are synthesized using initialized scan parameters (RF saturation power, B1, frequency offset, Ω, saturation time, Ts, relaxation delay time, Td), noise, and tissue parameters (Input) are fed to the fully connected neural network (FCNN). The FCNN outputs tissue parameter estimates (Output). The loss function is defined as the mean square error between the ground-truths and estimated tissue parameters. The calculated loss was back-propagated with an ADAM optimizer to update the scan parameters. APT and NOE images were calculated by subtracting the synthesized semisolid MT image at 3.5 ppm from the acquired saturated image at ±3.5 ppm. Reproduced and modified with permission from Kang et al., NMR Biomed 2021:e4662.
Figure 13.
Figure 13.. Synthetic MRI analysis for validation of the semisolid MT-MRF method.
Synthetic contrast-weighted images are generated using all the tissue parameters obtained from the deep neural network (DNN), which can then be compared with the experimentally acquired images as the standard of reference. Tissue parameters are quantified from an acquisition schedule consisting of 40 dynamic MRF images (a corresponding MRF schedule is shown in top right) using the DNN, and then a new acquisition schedule (middle right) is used for synthesizing 10 dynamic MRF images by inserting the tissue parameters obtained from DNN into the forward BM transform. The synthesized images showed a high degree of agreement with the experimentally acquired images as shown in the difference image. Reproduced and modified with permission from Kim et al., Neuroimage 2020:117165.
Figure 14.
Figure 14.. Reproducibility study of deep CEST-MRF in healthy human volunteers.
Semisolid MT proton volume fraction (fss, first column) and exchange rate (kssw, second column), amide proton volume fraction (fs, third column), and exchange rate (ksw, fourth column) for measurements at a 3T Prisma in Tübingen (first row), 3T Prisma in Boston (second row), and 3T Trio in Erlangen (third row). Reproduced and modified from Herz et al. Magn Reson Med. 2021;86:1845– 1858.

References

    1. Zhou Jinyuan, Heo Hye-Young, Knutsson Linda, Zijl Peter CM, Jiang Shanshan. APT-weighted MRI: Techniques, current neuro applications, and challenging issues. J Magn Reson Imaging. 2019;50:347–364. - PMC - PubMed
    1. Cai Kejia, Haris Mohammad, Singh Anup, et al. Magnetic resonance imaging of glutamate. Nat Med. 2012;18:302–306. - PMC - PubMed
    1. Zhou Jinyuan, Payen Jean-Francois, Wilson David A, Traystman Richard J, Van Zijl Peter CM. Using the amide proton signals of intracellular proteins and peptides to detect pH effects in MRI. Nat Med. 2003;9:1085–1090. - PubMed
    1. Henkelman R Mark, Huang Xuemei, Xiang Qing-San, Stanisz GJ, Swanson Scott D, Bronskill Michael J. Quantitative interpretation of magnetization transfer. Magn Reson Med. 1993;29:759–766. - PubMed
    1. Balaban Robert S, Ceckler TL. Magnetization transfer contrast in magnetic resonance imaging. Magnetic resonance quarterly. 1992;8:116–137. - PubMed

Publication types