. 2022 Apr 1;15(4):dmm048921.
doi: 10.1242/dmm.048921. Epub 2022 Apr 13.

A zebrafish reporter line reveals immune and neuronal expression of endogenous retrovirus

Affiliations

A zebrafish reporter line reveals immune and neuronal expression of endogenous retrovirus

Holly A Rutherford et al. Dis Model Mech. .

Abstract

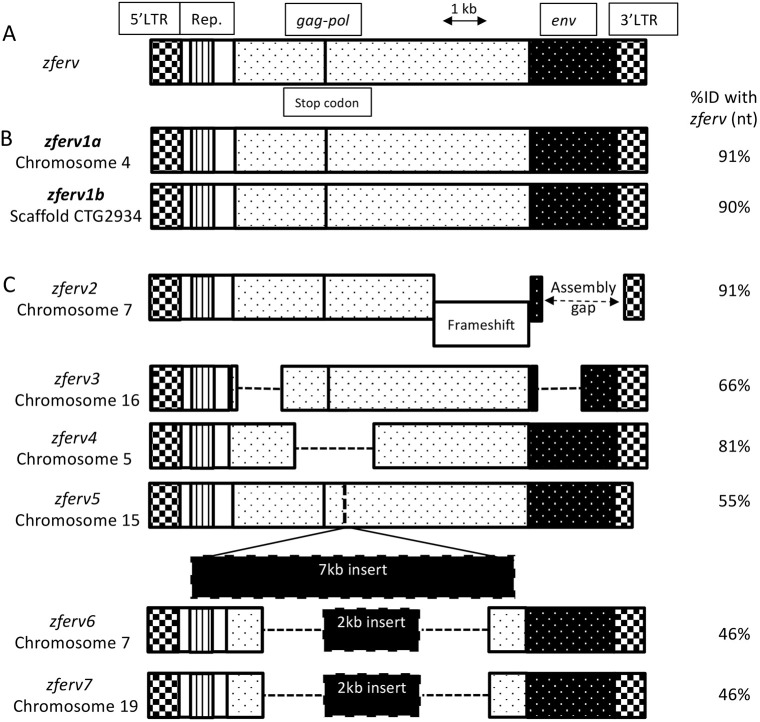
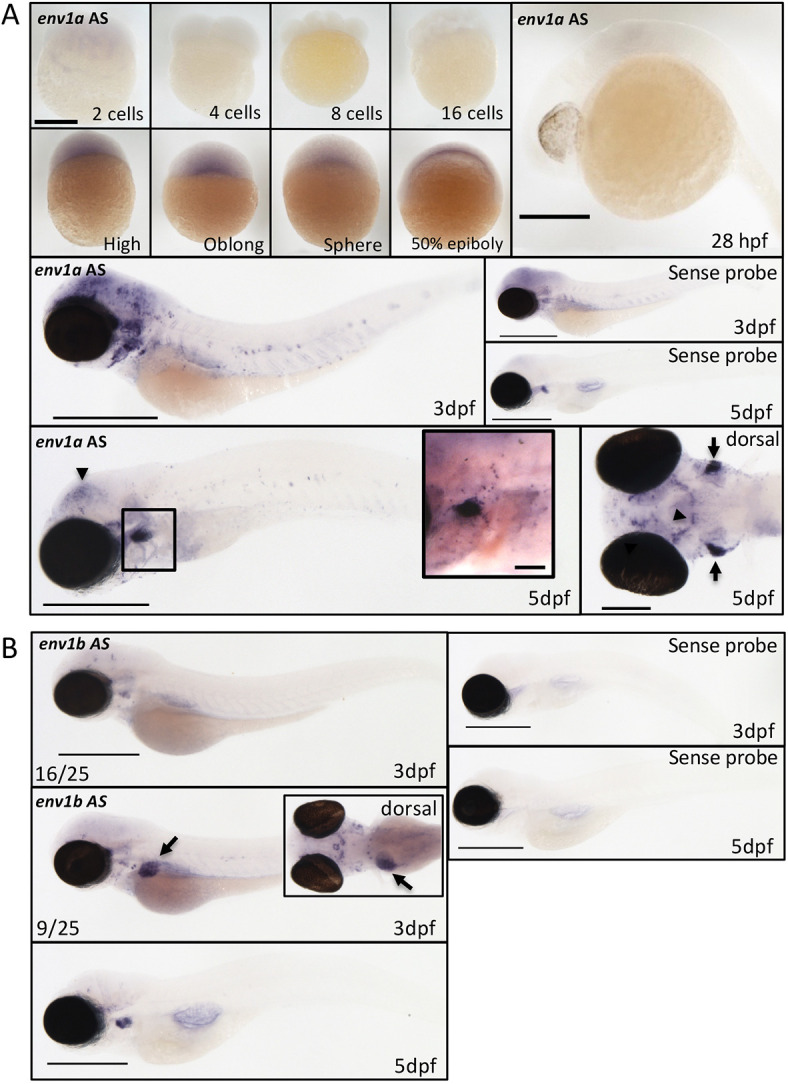
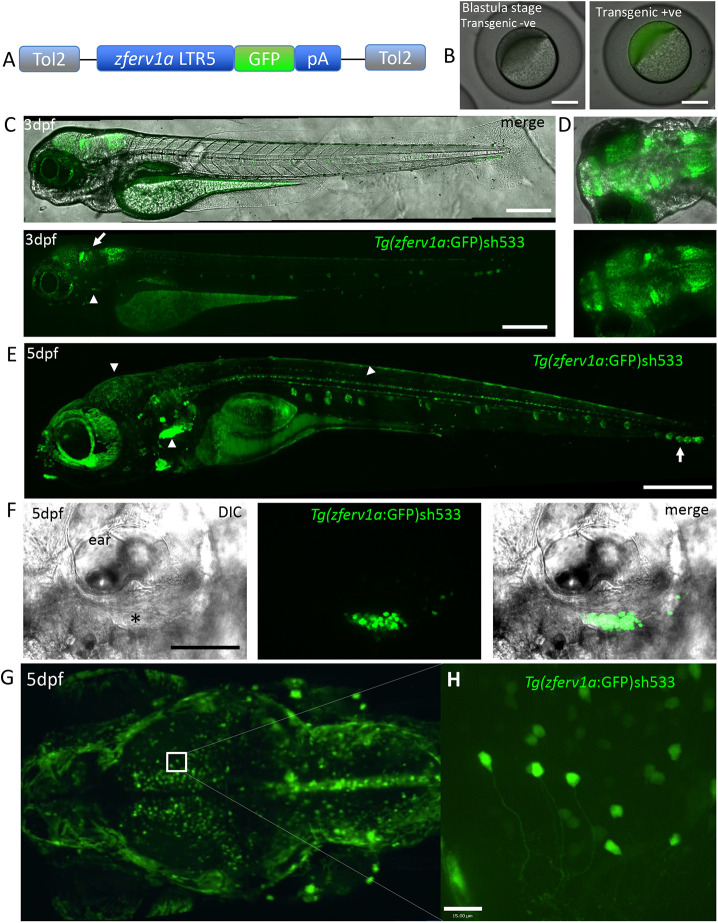
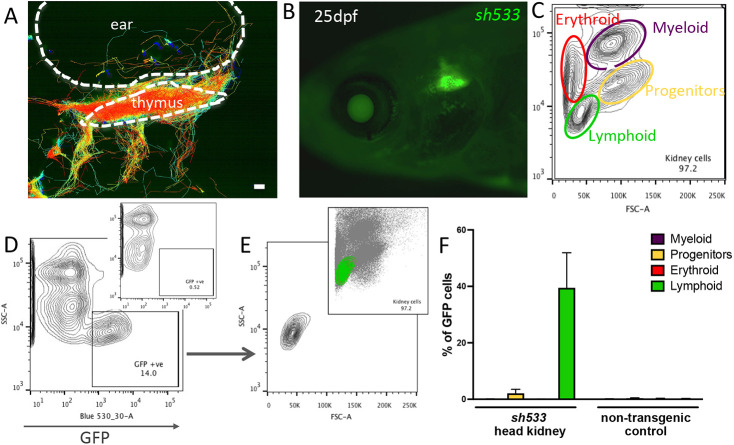
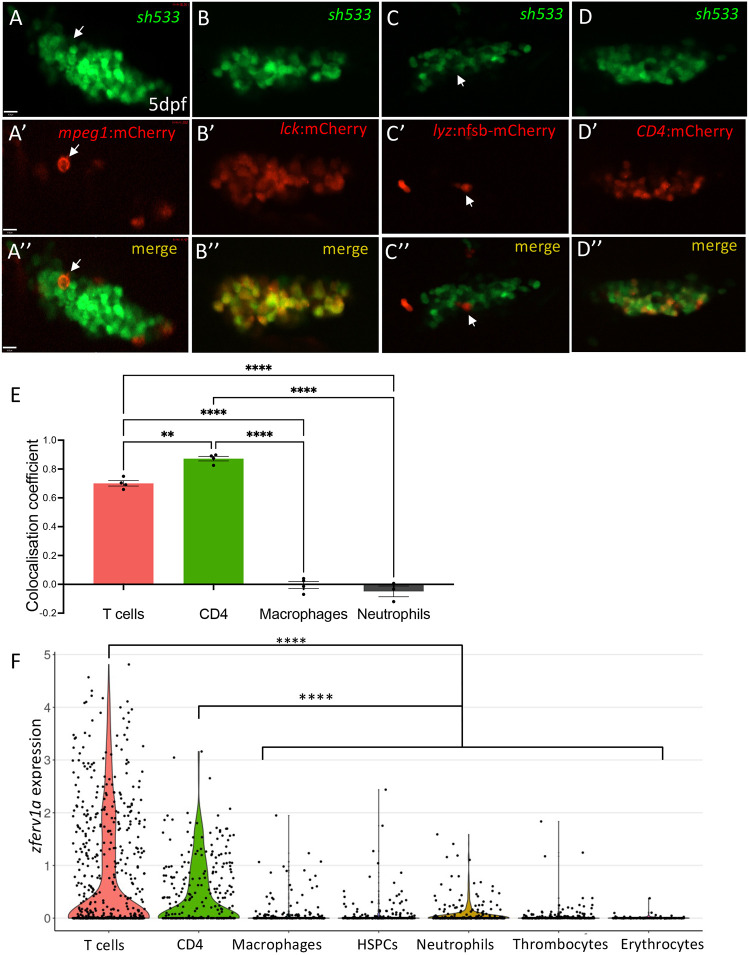
Endogenous retroviruses (ERVs) are fossils left in our genome from retrovirus infections of the past. Their sequences are part of every vertebrate genome and their random integrations are thought to have contributed to evolution. Although ERVs are mainly silenced by the host genome, they have been found to be activated in multiple disease states, such as auto-inflammatory disorders and neurological diseases. However, the numerous copies in mammalian genomes and the lack of tools to study them make defining their role in health and diseases challenging. In this study, we identified eight copies of the zebrafish endogenous retrovirus zferv. We created and characterised the first in vivo ERV reporter line in any species. Using a combination of live imaging, flow cytometry and single-cell RNA sequencing, we mapped zferv expression to early T cells and neurons. Thus, this new tool identified tissues expressing ERV in zebrafish, highlighting a potential role of ERV during brain development and strengthening the hypothesis that ERV play a role in immunity and neurological diseases. This transgenic line is therefore a suitable tool to study the function of ERV in health and diseases.

Keywords: zferv; Endogenous retrovirus; LTR; Reporter line; Retroelement; Zebrafish.


Conflict of interest statement

Competing interests The authors declare no competing or financial interests.

Figures

Fig. 1.
Fig. 1.
Multiple copies of zferv are present in the zebrafish genome. (A) Diagram of the original zferv genes found by Shen and Steiner (2004) used as a reference for nucleotide identity (ID% nt). (B) Diagram representing the two closest related zferv genes found in most recent zebrafish genome GRCz11, named zferv1a and zferv1b. (C) Diagram of six pseudo zferv genes with degenerated genome (dashed line represents insertions). 3′LTR, 3′ long terminal repeat; 5′LTR, 5′ long terminal repeat; env, envelope gene; gag-pol, genes encoding polyprotein and reverse transcriptase; Rep., repetitive element.
Fig. 2.
Fig. 2.
Reporter line for zferv1a recapitulates endogenous expression. (A) Expression of the envelope gene (env) of zferv1a (called env1a here) using antisense (AS) and sense in situ hybridisation RNA probes from the two-cell stage until 5 dpf (black arrowheads point to brain expression). Scale bars: 500 µm unless specified otherwise. Bottom left panel shows dorsal view of env1aAS expression in the brain (black arrowheads) and thymus (black arrows). Scale bar: 200 µm. Inset shows a magnified image of the thymus area (boxed), highlighting strong expression around the thymus with single positive cells visible in the vicinity of the thymus around the ear and alongside the branchial arches. Scale bar: 70 µm. (B) Expression of the envelope gene (env) of zferv1b (called env1b AS here) by in situ hybridisation at 3 dpf and 5 dpf. Liver expression is highlighted by black arrows. Inset shows dorsal view of the asymmetric liver expression. Scale bars: 500 µm.
Fig. 3.
Fig. 3.
Reporter line for zferv1a recapitulates endogenous expression. (A) Diagram of the Gateway construct used to create the Tg(zferv1a:GFP) reporter line using the pDestCryCFP Tol2 backbone. (B) Representative images of non-transgenic and Tg(zferv1a:GFP:pA)sh533 transgenic embryos at the blastula stage. (C) Lateral view of DIC and GFP high-resolution images of a 3 dpf Tg(zferv1a:GFP:pA)sh533 embryo, displaying high expression of the transgene in the brain (white arrow) and the start of a signal in the thymus (white arrowheads). Scale bars: 400 µm. (D) Dorsal view of the brain at 3 dpf, showing GFP expression alone or merged with brightfield image. (E) High-resolution image of a 5 dpf Tg(zferv1a:GFP:pA)sh533 embryo, displaying high expression of the transgene in the thymus, brain and spinal cord (white arrowheads). Note the signal in neuromasts alongside the trunk (white arrow). Scale bar: 500 µm. (F) Single-slice DIC and confocal GFP fluorescence merged image of the thymus (black asterisk) situated underneath the ear in 5 dpf embryos and the signal from the Tg(zferv1a:GFP)sh533 reporter. Scale bar: 100 µm. (G) Dorsal view of a maximum projection of the brain from a 5 dpf Tg(zferv1a:GFP) embryo acquired with a lightsheet microscope. (H) High-resolution single-slice image from the optic tectum of the same Tg(zferv1a:GFP) embryo. Scale bar: 15 µm.
Fig. 4.
Fig. 4.
zferv1a is expressed in cells from the lymphoid lineage in adult haematopoietic tissues. (A) Cell tracking reveals dynamic behaviour of entry and exit of the thymus by GFP-positive cells in Tg(zferv1a:GFP)sh533. Whole-stack analysis of cell movement using TrackMate in Fiji. Scale bar: 10 µm. (B) Expression of Tg(zferv1a:GFP)sh533 in a 25 dpf zebrafish highlighting the triangular shaped thymus. (C) Forward scatter (FSC)/side scatter (SSC) plot of a whole kidney marrow separating different haematopoietic lineages by size and granularity. (D) SSC and GFP plot from a single-cell suspension of a whole kidney marrow from an adult Tg(zferv1a:GFP) with gate selecting GFP-positive cells. Inset shows the distribution of cells from a non-transgenic adult whole kidney marrow. (E) FSC/SSC plot of selected GFP-positive cells from D. Inset shows the location of the GFP-positive cells in the haematopoietic lineage FSC/SSC plot. (F) Quantification of GFP-positive cells in myeloid, erythroid, lymphoid lineages and progenitors from dissected sh533 and non-transgenic control adult head kidneys (n=3).
Fig. 5.
Fig. 5.
Immune expression of zferv1a is restricted to CD4+ cells and T cells. (A-D″) Single-slice confocal image of the thymus from double-transgenic Tg(zferv1a:GFP)sh533 and Tg(mpeg1:mCherryCAAX)sh378, which labels macrophage membranes (A-A″, white arrows point to a single macrophage), Tg(lck:mCherry), which labels T cells (B-B″), Tg(lyz:nfsb-mCherry)sh260, which labels neutrophils (C-C″, white arrows point to a single neutrophil), and Tg(CD4:mCherryCAAX), which labels CD4+ cells (D-D″) with merge image used for colocalisation analysis. (E) Histogram of ImageJ-generated colocalisation coefficients of Tg(zferv1a:GFP)sh533 crossed to Tg(mpeg1:mCherryCAAX)sh378 for macrophages, Tg(lyz:nfsb-mCherry)sh260 for neutrophils, Tg(CD4:mCherry) for CD4+ cells and Tg(lck:mCherry) for T cells (one-way ANOVA, n=4). (F) Violin plot of single-cell RNA-sequencing datasets MTAB-5530 and E-MTAB-4617 from zebrafish adult whole kidney marrow and spleen showing expression of zferv1a (ENSDARG00000110878) in multiple haematopoietic lineages. P=1.95×10⁻¹¹ for CD4+ versus the other clusters and P=1.97×10−45 for T cells versus the other clusters (Mann–Whitney with paired Wilcoxon test). HSPCs, haematopoietic stem and progenitor cells.

References

    1. Ahmad, S., Mu, X., Yang, F., Greenwald, E., Park, J. W., Jacob, E., Zhang, C.-Z. and Hur, S. (2018). Breaching self-tolerance to Alu duplex RNA underlies MDA5-mediated inflammation. Cell 172, 797-810.e13. 10.1016/j.cell.2017.12.016 - DOI - PMC - PubMed
    1. Akitake, C. M., Macurak, M., Halpern, M. E. and Goll, M. G. (2011). Transgenerational analysis of transcriptional silencing in zebrafish. Dev. Biol. 352, 191-201. 10.1016/j.ydbio.2011.01.002 - DOI - PMC - PubMed
    1. Athanasiadis, E. I., Botthof, J. G., Andres, H., Ferreira, L., Lio, P. and Cvejic, A. (2017). Single-cell RNA-sequencing uncovers transcriptional states and fate decisions in haematopoiesis. Nat. Commun. 8, 2045. 10.1038/s41467-017-02305-6 - DOI - PMC - PubMed
    1. Baudino, L., Yoshinobu, K., Morito, N., Kikuchi, S., Fossati-Jimack, L., Morley, B. J., Vyse, T. J., Hirose, S., Jørgensen, T. N., Tucker, R. M.et al. (2014). Dissection of genetic mechanisms governing the expression of serum retroviral Gp70 implicated in murine lupus nephritis. J. Immunol. 181, 2846-2854. 10.4049/jimmunol.181.4.2846 - DOI - PMC - PubMed
    1. Benitez-Guijarro, M., Lopez-Ruiz, C., Tarnauskaitė, Ž., Murina, O., Mohammad, M. M., Williams, T. C., Fluteau, A., Sanchez, L., Vilar-Astasio, R., Garcia–Canadas, M.et al. (2018). RNase H2, mutated in Aicardi–Goutières syndrome, promotes LINE–1 retrotransposition. EMBO J. 37, e98506. 10.15252/embj.201798506 - DOI - PMC - PubMed

Publication types