. 2022 Apr;9(11):e2105631.
doi: 10.1002/advs.202105631. Epub 2022 Feb 10.

Remodeling Tumor-Associated Neutrophils to Enhance Dendritic Cell-Based HCC Neoantigen Nano-Vaccine Efficiency

Affiliations

Remodeling Tumor-Associated Neutrophils to Enhance Dendritic Cell-Based HCC Neoantigen Nano-Vaccine Efficiency

Yunhao Wang et al. Adv Sci (Weinh). 2022 Apr.

Abstract

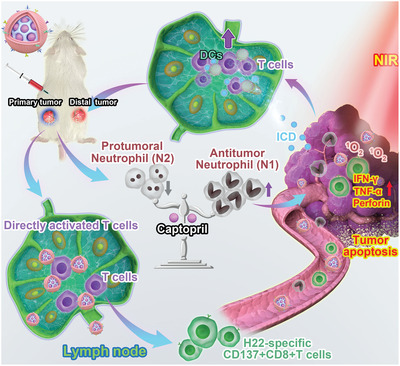
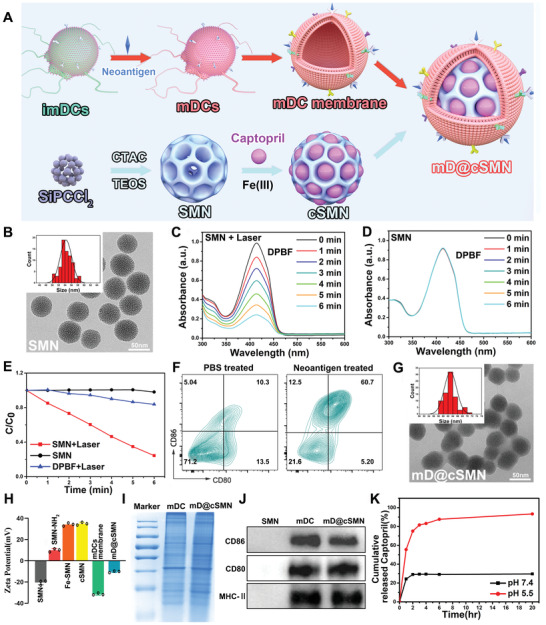
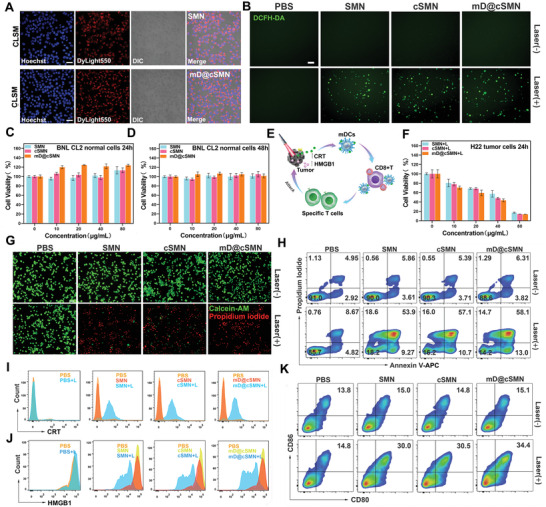
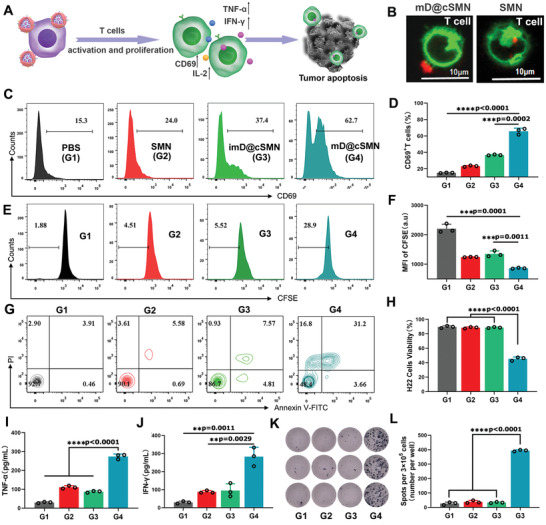
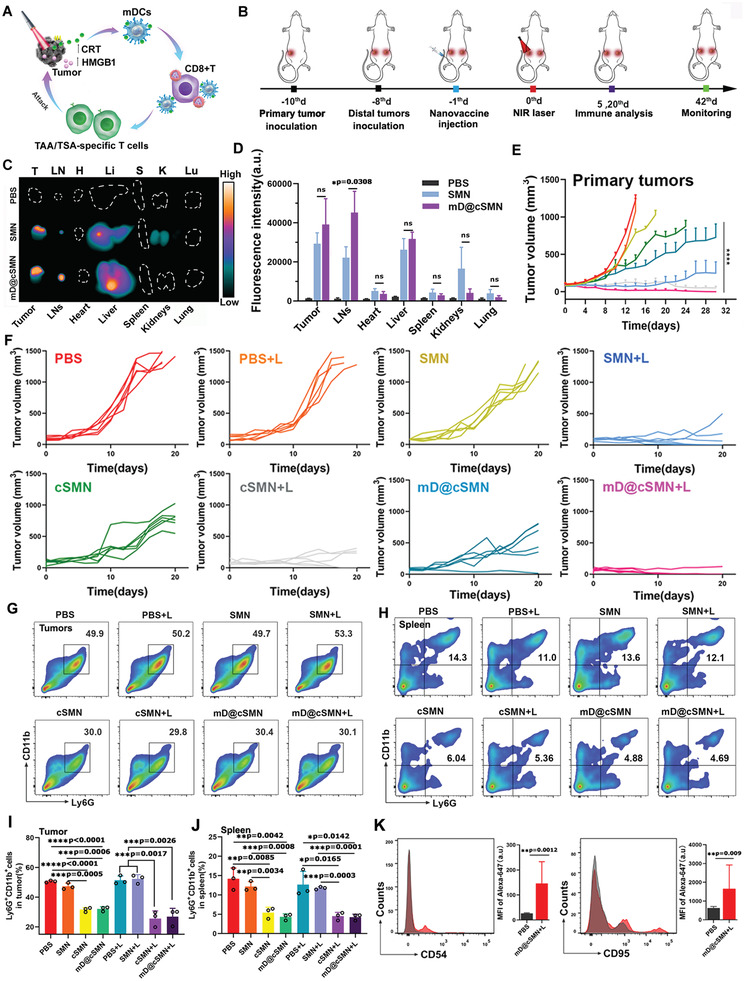
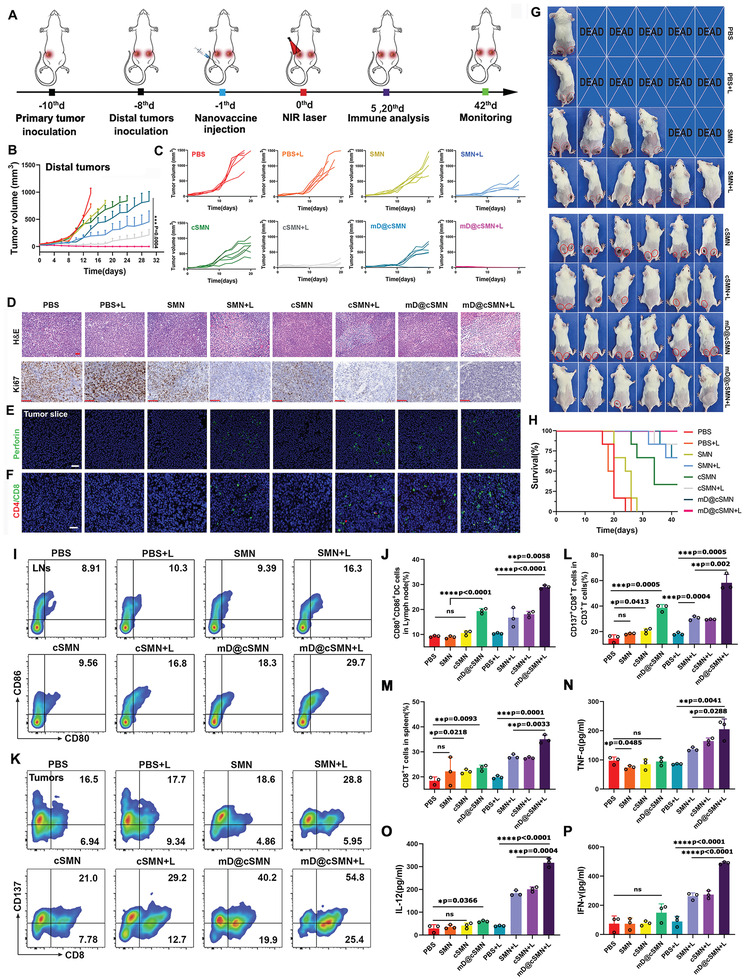
Hepatocellular carcinoma (HCC) commonly emerges in an immunologically "cold" state, thereafter protects it away from cytolytic attack by tumor-infiltrating lymphocytes, resulting in poor response to immunotherapy. Herein, an acidic/photo-sensitive dendritic cell (DCs)-based neoantigen nano-vaccine has been explored to convert tumor immune "cold" state into "hot", and remodel tumor-associated neutrophils to potentiate anticancer immune response for enhancing immunotherapy efficiency. The nano-vaccine is constructed by SiPCCl2 -hybridized mesoporous silica with coordination of Fe(III)-captopril, and coating with exfoliated membrane of matured DCs by H22-specific neoantigen stimulation. The nano-vaccines actively target H22 tumors and induce immunological cell death to boost tumor-associated antigen release by the generation of excess 1 O2 through photodynamic therapy, which act as in situ tumor vaccination to strengthen antitumor T-cell response against primary H22 tumor growth. Interestingly, the nano-vaccines are also home to lymph nodes to directly induce the activation and proliferation of neoantigen-specific T cells to suppress the primary/distal tumor growth. Moreover, the acidic-triggered captopril release in tumor microenvironment can polarize the protumoral N2 phenotype neutrophils to antitumor N1 phenotype for improving the immune effects to achieve complete tumor regression (83%) in H22-bearing mice and prolong the survival time. This work provides an alternative approach for developing novel HCC immunotherapy strategies.

Keywords: dendritic cell-based vaccine; immunotherapy; neoantigen; neutrophils; photodynamic therapy.


Conflict of interest statement

The authors declare no conflict of interest.

Figures

Figure 1
Figure 1
Schematic illustration of remodeling tumor‐associated neutrophils to enhance DC‐based HCC neoantigen nano‐vaccine efficiency. The H22 liver cancer cell‐specific neoantigens are predicted by in silico analysis and confirmed through ELISPOT. Afterward, the neoantigen activated DC‐based nano‐vaccines are prepared, which can not only actively target H22 tumor tissues to enhance TAA release through PDT but achieved the lymph‐homing ability to directly induce the activation and proliferation of CD8+T cells. These led to strengthening the immune responses against the primary and distant tumor growth. More strikingly, the tumor acidic‐triggered release of captopril can reduce the protumoral N2 phenotype to further improve the immune effects to further augment the suppression of both the primary and distance tumor growth, therefore prolonging the survival of H22‐bearing mice.
Figure 2
Figure 2
Characterization of mD@cSMN nano‐vaccines. A) Schematic illustration of the preparation of mD@cSMN nano‐vaccines. B) TEM image of SMN photosensitizers and the size distribution of SMNs (insert picture). C) The absorbance of DPBF after decomposition by generated 1 O 2 from SMN with and without D) 670 nm laser irradiation (50 mW cm−2) for different times. E) The normalized absorbance of DPBF at 415 nm after decomposition by ROS generation in SMNs with or without irradiation for different times and the DPBF without SMN is used as the control. F) The maturation of BMDCs after co‐incubation with PBS or H22 tumor cell‐specific neoantigen for 72 h, respectively, which are analyzed by FACS with staining CD80 and CD86 antibodies. G) The TEM image of mD@cSMN nano‐vaccines and their size distribution (insert picture). H) The surface zeta potential of the SMNs, SMNs‐NH2, Fe‐SMNs, cSMNs, the mature DCs membrane, and mD@cSMNs, (n = 3). I) The protein pattern analysis of matured DCs membrane and mD@cSMNs through SDS‐PAGE (coomassie blue staining). J) Western blotting analysis of membrane‐specific protein markers. The samples are run at equal protein amounts and blotted with CD80, CD86, and MHC‐II antibodies. K) The cumulative captopril release kinetics from mD@cSMNs in different pH conditions within 20 h.
Figure 3
Figure 3
Photodynamic enhancement of ICD and activation of immune responses in vitro. A) CLSM images of H22 liver cancer cells uptaking Dylight 550‐NHS labeled SMNs or mD@cSMN nano‐vaccines. The blue is represented Hoechst33342, and the red is represented Dylight550. Scar bar, 100 µm. B) CLSM images of intracellular ROS generation of PBS, SMNs, cSMNs, and mD@cSMNs with or without NIR laser irradiation (50 mW cm−2) for 5 min, respectively. DCFH‐DA acted as a ROS fluorescence indicator (green, excited by 488 nm). Scar bar, 100 µm. C,D) The Cell viability of BNL CL2 normal liver cells treated with various doses of PBS, SMNs, cSMNs, and mD@cSMNs after 24 or 48 h coincubation, in dark conditions, respectively, (n = 5). E) Schematic illustration of antitumor effect through mD@cSMNs upon the 670 nm laser irradiation and maturation of BMDCs through detecting CRT and high‐mobility group box 1 protein (HMGB1) in vitro. F) The Cell viability of H22 cells treated with different doses of PBS, SMNs, cSMNs, and mD@cSMNs with NIR laser irradiation for 5 min, respectively. The Cell viability is analyzed by CCK8 kit, (n = 5). G) Fluorescence images of the live/dead cell viability assay kit (Calcein‐AM/PI) stained H22 cells with or without laser irradiation as indicated treatments. Scar bar, 100 µm. H) The apoptosis/necrosis of H22 cells is analyzed by FACS with staining Annexin‐V‐APC/PI under the following conditions: PBS treated H22 cells with or without 670 nm laser irradiation (50 mW cm−2) for 5 min; H22 cells incubated with SMNs with or without laser irradiation; H22 cells incubated with cSMNs with or without laser irradiation; H22 cells incubated with mD@cSMNs with or without laser irradiation; The surface‐exposed CRT (I) and released HMGB1 (J) detection from PBS, SMN, cSMN, or mD@cSMN treated H22 cancer cells with or without laser irradiation, which are analyzed by FACS. K) The maturation of BMDCs after co‐incubation with PBS, SMN, cSMN, or mD@cSMN treated H22 cancer cells for 24 h, respectively. Data are presented as mean ± SEM.
Figure 4
Figure 4
Directly activation of T cell proliferation and effective killing of H22 cells in vitro. A) Schematic illustration and B) CLSM image of the interaction between mD@cSMNs and inactivated T cells from BALb/c mice spleen, which directly induced the T cell activation and proliferation as well as cytokine secretion. Green fluorescence is represented Dil labeled T cells and red fluorescence is represented Dylight550‐NHS labeled mD@cSMNs. C,D) The activation of T cells after co‐incubation with PBS, SMNs, imD@cSMNs, or mD@cSMNs for 72 h, respectively, and analyzed by FACS with staining CD69 and CD3, (n = 3). E,F) The proliferation of CSFE labeled CD8+T cells after co‐incubation with PBS, SMNs, imD@cSMNs, or mD@ cSMNs, respectively, and analyzed by FACS, (n = 3). G,H) The toxicity of T cells that activated by PBS, SMNs, imD@cSMNs, or mD@cSMNs after co‐incubation with H22 cells for 72 h, and analyzed by FACS with staining Annexin V‐FITC and PI, (n = 3). The secretion of TNF‐α (I) and IFN‐γ (J) is checked by ELISA kit after 72 h of post‐incubation with H22 cells, (n = 3). K,L) ELISPOT analysis of IFN‐γ spot‐forming of PBMCs cells from BALb/c after s.c. injection of PBS, SMNs, imD@cSMNs, or mD@cSMNs for 14 days, and then co‐incubated for 48 h (n = 3). G1, PBS; G2, SMN; G3, imD@cSMN; G4, mD@cSMN. The statistical analysis is performed with ANOVA analysis, *p < 0.05, **p < 0.01, ***p < 0.001, ****p < 0.0001, (n = 3). Data are presented as mean ± SEM.
Figure 5
Figure 5
Active targeting H22 tumors and LNs homing effect to effectively inhibit tumor growth through mD@cSMN nano‐vaccines by activating immune responses under the 670 nm laser irradiation. A,B) Schematic illustration of antitumor effect by mD@cSMN nano‐vaccines and their administration procedure in the established primary H22 tumor‐bearing mice and distal tumors upon the laser irradiation. C) Ex vivo fluorescence images of tumors, LNs, and major organs that are isolated from H22 tumor‐bearing mice after 24 h of ICG‐labeled SMNs and mD@cSMN injection, and the PBS treated mice is used as the control. D) Fluorescence intensity of tumors, LNs, and major organs after s.c. injection of nano‐vaccines at 24 h, (n = 3). The statistical analysis is performed with two‐tail paired Student‘s t‐test analysis, *p < 0.05. ns means p > 0.05. E,F) The primary tumor volume change of mice after PBS, SMN, cSMN, or mD@cSMN treated mice with or without 670 nm irradiation (0.1 W cm−2) of primary tumors for 5 min (n = 6). The percentage of CD11b+Ly6G+TANs in the primary tumors (G,I) and spleen (H,J) are investigated after receiving different treatments as indicated on the 20th day (n = 3). K) Cell surface expression of typical N1 neutrophil markers (CD54 and CD95) in tumors after treated with mD@cSMN+NIR for 20 days, and then analyzed by flow cytometry with staining CD54 and CD95 antibodies, (n = 3). The statistical analysis is performed with ANOVA analysis, *p < 0.05, **p < 0.01, ***p < 0.001, ****p < 0.0001. Data are presented as mean ± SEM.
Figure 6
Figure 6
The synergistic antitumor effect of mD@cSMN nano‐vaccines inhibition of distal tumor growth and enhanced the CTLs infiltration and cytokine secretion. A) Schematic illustration of the process of s.c. injection of mD@cSMN nano‐vaccines in distal tumor mode. B,C) The average distal tumor volume change of mice after different treatments as indicated, (n = 6). D) H&E and ki67 staining of tumor slice at the 20th day after receiving different treatment as indicated, scale bar, 50 and 100 µm, respectively. CLSM image of perforin (E,F) tumor‐infiltrating lymphocytes (TILs) in the primary tumors at the 20th day after receiving different treatments as indicated. Red fluorescence is CD4+T cells. Green fluorescence is CD8+T cells, scale bar, 50 and 20 µm, respectively. G) Digital images of mice with inhibition of tumor growth in each group on 20th day after receiving different treatment as indicated (n = 6). H) Survival curves of the H22 tumor‐bearing mice (n = 6) after immunization and irradiated by NIR laser (0.1 W cm−2) for 5 min as indicated. I,J) Induced DC maturation in tumor‐draining lymph nodes after inoculation with PBS, SMNs, cSMNs, and mD@cSMNs with or without NIR laser irradiation. The immune cells in LNs are collected and analyzed by FACS after staining with CD11c, CD80, and CD86 on the 5th day, respectively, (n = 3). K–M) The TILs in tumors after receiving different treatments as indicated. The T cells in the tumor are collected and analyzed by FACS after staining with CD3, CD8, and CD137 on the 5th day, (n = 3). Cytokine levels of TNF‐α (N), IL‐12 (O), and IFN‐γ (P) in primary tumors isolated from differently treated mice by ELISA analysis, (n = 3). The statistical analysis is performed with ANOVA analysis, *p < 0.05, **p < 0.01, ***p < 0.001, ****p < 0.0001. Data are presented as mean ± SEM.

Similar articles

Cited by

References

    1. Llovet J. M., Kelley R. K., Villanueva A., Singal A. G., Pikarsky E., Roayaie S., Lencioni R., Koike K., Zucman‐Rossi J., Finn R. S., Nat. Rre. Dis. Primers 2021, 7, 6. - PubMed
    1. Forner A., Gilabert M., Bruix J., Raoul J. L., Nat. Rev. Clin. Oncol. 2014, 11, 525. - PubMed
    1. Vogel A., Cervantes A., Chau I., Daniele B., Llovet J. M., Meyer T., Nault J. C., Neumann U., Ricke J., Sangro B., Schirmacher P., Verslype C., Zech C. J., Arnold D., Martinelli E., Ann. Oncol. 2019, 30, 871. - PubMed
    1. Llovet J. M., Montal R., Sia D., Finn R. S., Nat Rev Clin Oncol. 2018, 15, 599. - PubMed
    1. Llovet J. M., De Baere T., Kulik L., Haber P. K., Greten T. F., Meyer T., Lencioni R., Nat. Rev. Gastroenterol. Hepatol. 2021, 18, 293. - PubMed

Publication types

LinkOut - more resources