. 2022 Dec;13(1):191-214.
doi: 10.1080/21505594.2022.2026037.

From environmental adaptation to host survival: Attributes that mediate pathogenicity of Candida auris

Affiliations

From environmental adaptation to host survival: Attributes that mediate pathogenicity of Candida auris

Stefanie Allert et al. Virulence. 2022 Dec.

Abstract

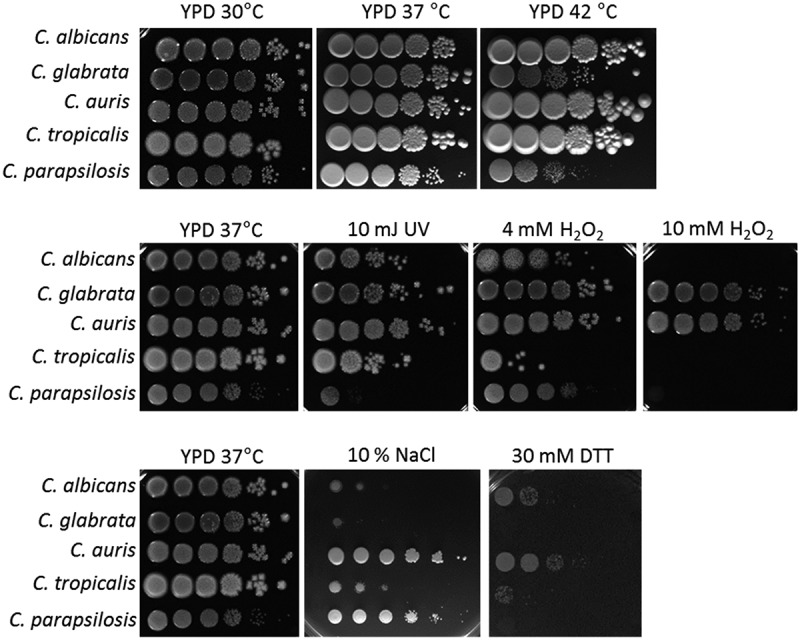
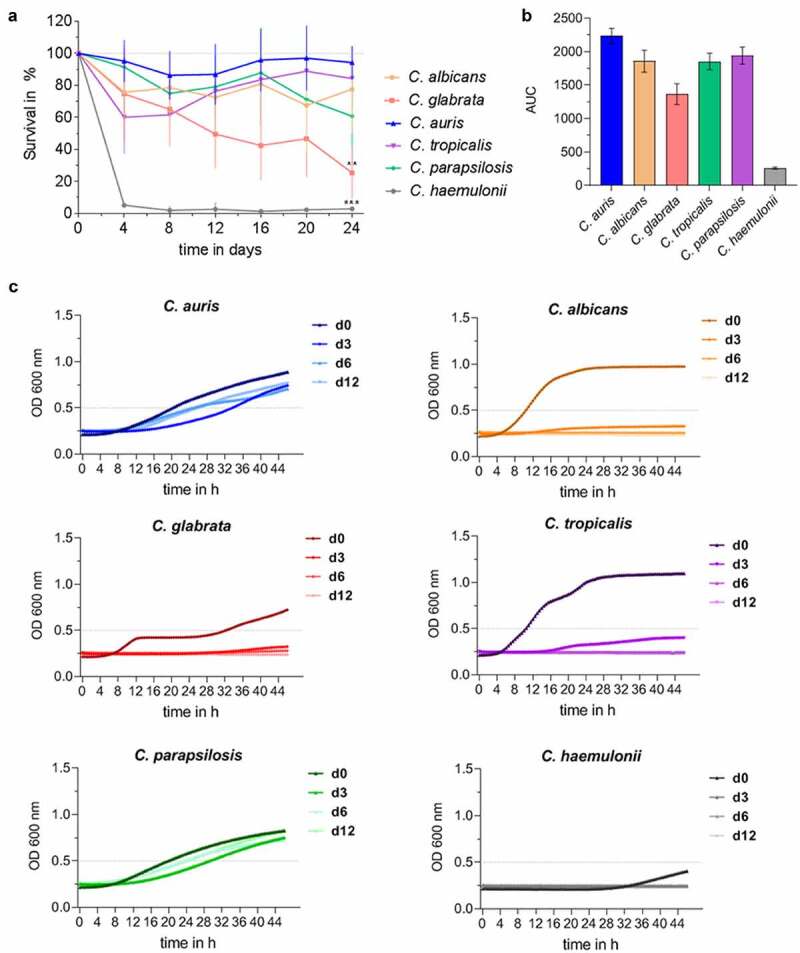
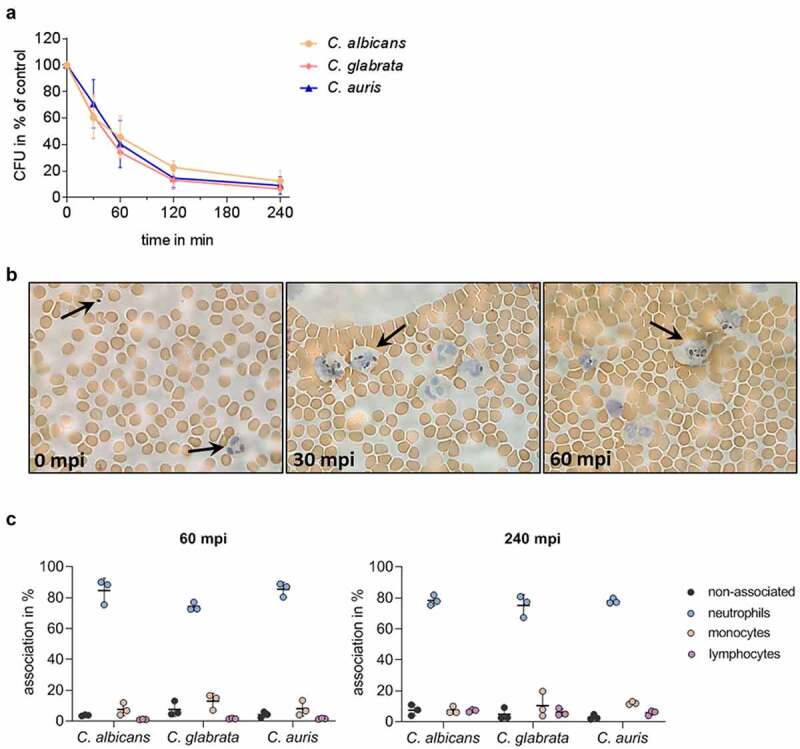
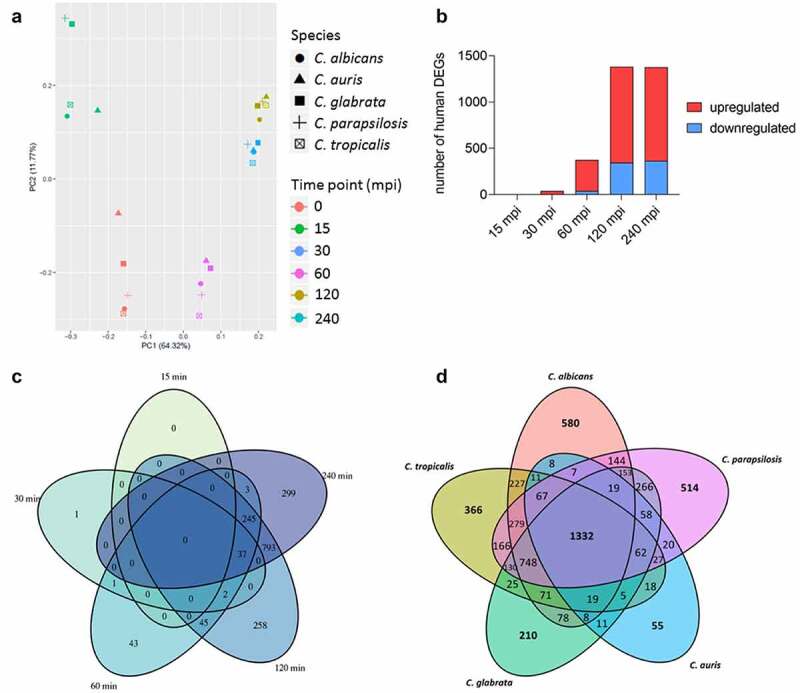
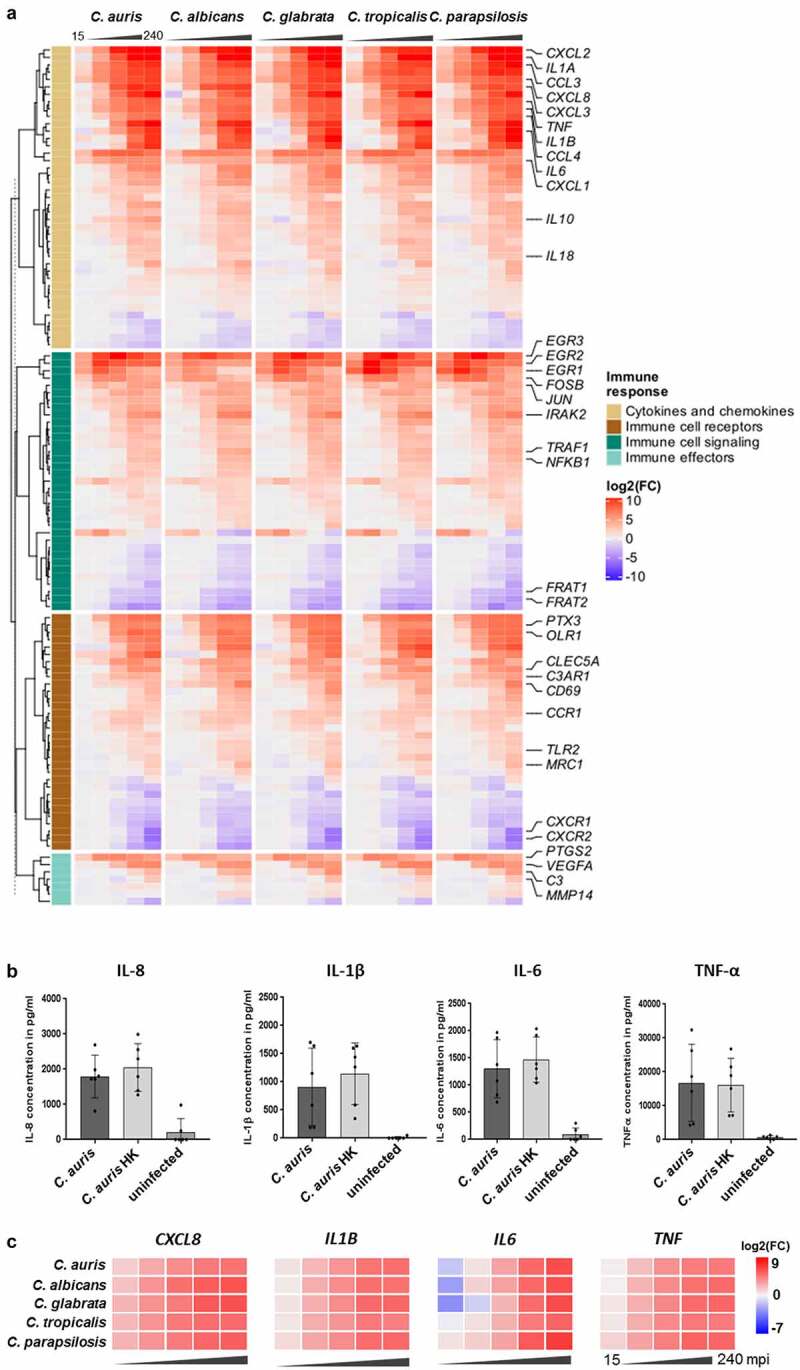
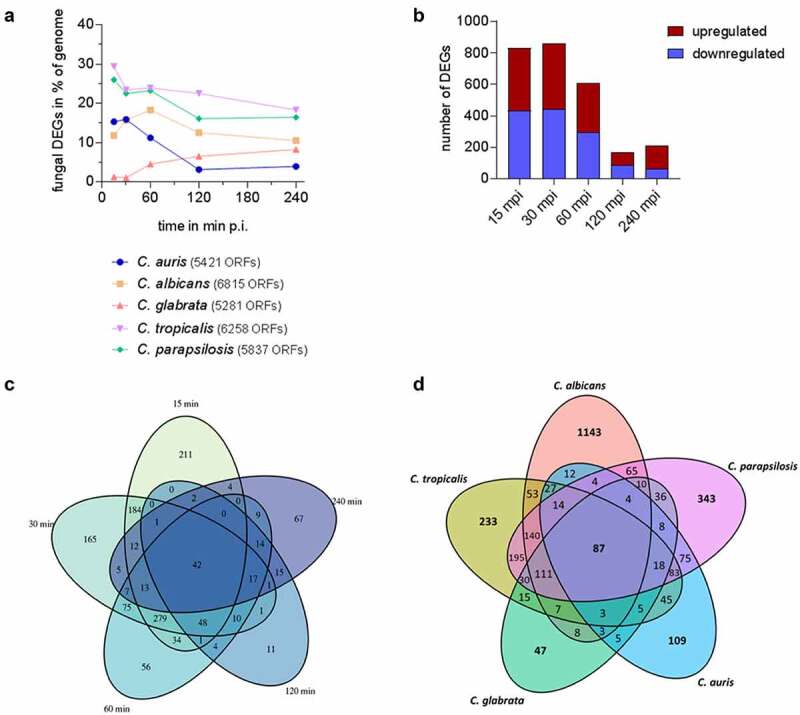
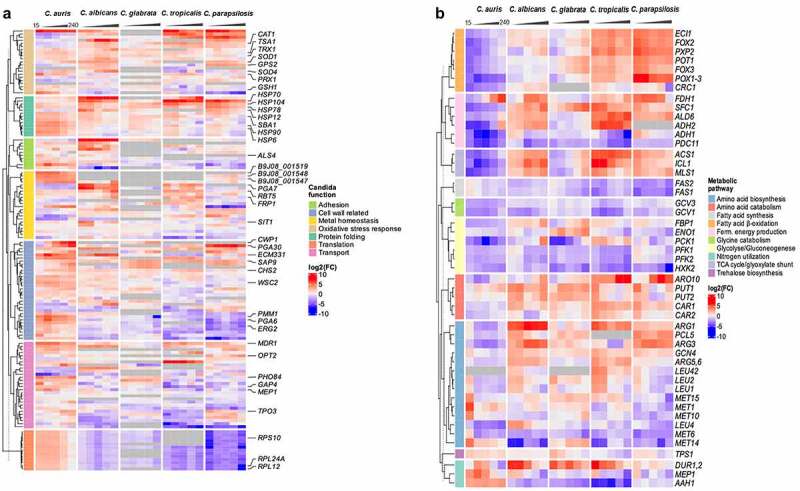
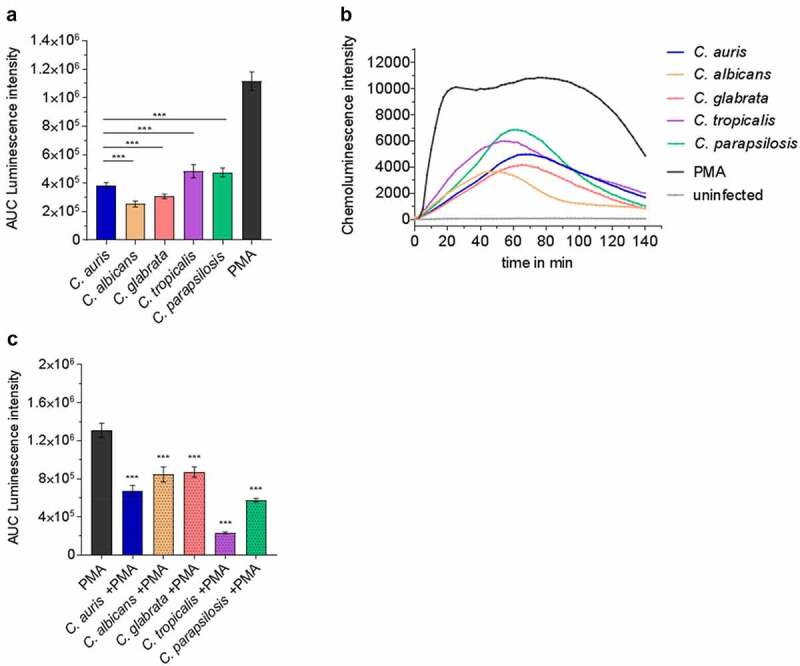
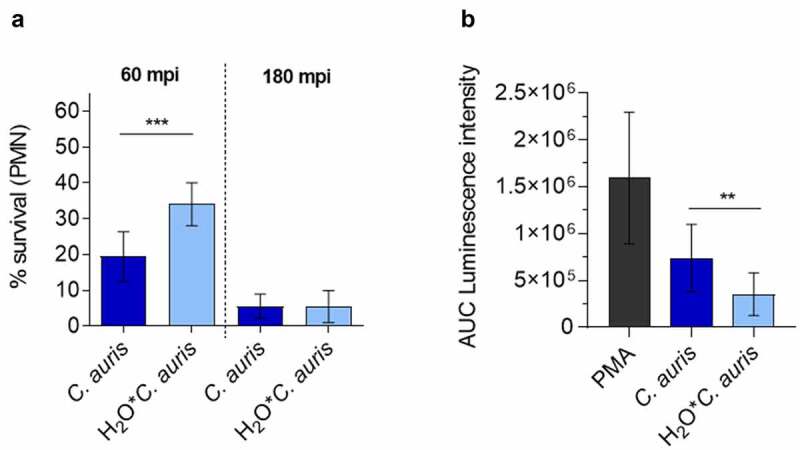
Candida species are a major cause of invasive fungal infections. While Candida albicans, C. glabrata, C. parapsilosis, and C. tropicalis are the most dominant species causing life-threatening candidiasis, C. auris recently emerged as a new species causing invasive infections with high rates of clinical treatment failures. To mimic initial phases of systemic Candida infections with dissemination via the bloodstream and to elucidate the pathogenic potential of C. auris, we used an ex vivo whole blood infection model. Similar to other clinically relevant Candida spp., C. auris is efficiently killed in human blood, but showed characteristic patterns of immune cell association, survival rates, and cytokine induction. Dual-species transcriptional profiling of C. auris-infected blood revealed a unique C. auris gene expression program during infection, while the host response proofed similar and conserved compared to other Candida species. C. auris-specific responses included adaptation and survival strategies, such as counteracting oxidative burst of immune cells, but also expression of potential virulence factors, (drug) transporters, and cell surface-associated genes. Despite comparable pathogenicity to other Candida species in our model, C. auris-specific transcriptional adaptations as well as its increased stress resistance and long-term environmental survival, likely contribute to the high risk of contamination and distribution in a nosocomial setting. Moreover, infections of neutrophils with pre-starved C. auris cells suggest that environmental preconditioning can have modulatory effects on the early host interaction. In summary, we present novel insights into C. auris pathogenicity, revealing adaptations to human blood and environmental niches distinctive from other Candida species.

Keywords: Candida auris; ROS; blood infection; cell surface; neutrophils; transcriptional profiling; transporter; virulence factor.


Conflict of interest statement

No potential conflict of interest was reported by the author(s).

Figures

Figure 1.
Figure 1.
C. auris is highly resistant to various stressors in vitro. Drop tests with serial dilutions of C. auris and the clinically most relevant Candida species were performed under various stress conditions to analyze fungal (a) tolerance of oxidative stress, (b) resistance against UV light and high temperature, and (c) resistance against osmotic stress. The highest concentration (left) was 1 × 108 fungal cells/ml. Pictures were taken after 1–2 days of incubation at the indicated temperature and representative examples from at least two biological replicates are shown.
Figure 2.
Figure 2.
C. auris survives long periods under nutrient-limited, environmental conditions. (a) Survival of Candida spp. in water at 30°C over a time period of 24 days was analyzed by CFU quantification at indicated time points. Results are shown relative to day 0 as 100%. n ≥ 3, mean ± SD; ** p ≤ 0.005, *** p ≤ 0.001 vs. C. auris (b) Candida survival in water over 24 days from (a) is expressed as Area Under Curve (AUC), clearly indicating differences between Candida species. n ≥ 3 (c) Survival of Candida spp. after a dry period of 0, 3, 6 or 12 days was assessed by analyzing re-growth in YPD at 30°C by optical density (OD) measurement at 600 nm over 48 h. n ≥ 3 shown as mean.
Figure 3.
Figure 3.
C. auris interacts with immune cells and is efficiently killed during ex vivo whole blood infection. (a) Survival of C. auris, C. albicans, and C. glabrata in human whole blood was determined 30, 60, 120, and 240 minutes post infection (mpi) by CFU quantification relative to time point 0 mpi as 100%. n = 6, mean ± SD (b) Exemplary microscopic pictures of blood smears prepared at indicated time points from C. auris infected whole blood. Arrows indicate fungal and human immune cells. 100 x magnification (c) Association of fungal cells with immune cells was determined by fluorescence activated cell sorting (FACS) analyses at 60 mpi and 240 mpi. n = 3, mean ± SD for independent experiments using different donors.
Figure 4.
Figure 4.
The human transcriptional response to C. auris in whole blood infection resembles the response to other Candida species. (a) Principal Component analysis (PCA plot) of the human transcriptome based on MRN values. Different time points (color) and Candida species (icon) are indicated to show similarity (b) Transcriptional kinetics shown by the number of human up- and down-regulated genes at different time points during C. auris infection (compared to 0 min) (c) Venn diagram for Homo sapiens comparing differentially expressed genes (DEGs) of each time point (compared to 0 min) during C. auris infection. (d) Venn diagram for infection with each indicated Candida species comparing human DEGs from infection with the indicated Candida species, considering genes differentially expressed during at least one time point.
Figure 5.
Figure 5.
The transcriptional response of blood cells to C. auris is dominated by the expression of immune mediators. (a) Expression of human genes encoding immune cell receptors, cytokines or chemokines, or associated with immune cell signaling or effector functions. Gene expression is shown color-coded as log2FC vs. 0 min and for each time point (15, 30, 60, 120, 240 mpi). More details are given in Table S3. (b) Plasma levels of the pro-inflammatory cytokines IL-1β, IL-6, TNF-α and the chemokine IL-8 240 mpi with C. auris alive or heat-killed (HK) or in an uninfected control sample. n ≥ 5 different donors shown as mean ± SD (c) Expression of selected human cytokines over the time course of C. auris infection. Gene expression is shown as log2FC vs. 0 min, indicated by color intensity.
Figure 6.
Figure 6.
Species-specific gene expression of C. auris during whole blood infection. (a) The transcriptional changes during whole blood infection are shown as % of the genome for each Candida species at the indicated time points. The total number of predicted open reading frames (ORF) is given in brackets for each species (b) Transcriptional kinetics shown by the number of up- and down-regulated C. auris genes at different time points during whole blood infection (compared to 0 min). (c) Venn diagram for C. auris comparing fungal differentially expressed genes (DEGs) of each time point (compared to 0 min) during whole blood infection. (d) Venn diagram comparing fungal DEGs for each indicated Candida species over the time course of whole blood infection, considering gene orthology and differential expression for at least one time point.
Figure 7.
Figure 7.
A pattern of its own: C. auris specific transcriptional alterations in response to human blood. Expression of selected fungal genes over the course of infection (15, 30, 60, 120, 240 mpi) with the indicated Candida species, associated with (a) protein folding, translation, the cell wall, oxidative stress or related to transport across the membrane, metal homeostasis, adhesion, or (b) metabolism. Gene expression is shown for orthologous genes color-coded as log2FC vs. 0 min for each time point. Genes without orthologues (or best hit according to BLASTP) are shown in gray. More details are given in Table S6.
Figure 8.
Figure 8.
Human neutrophils recognize C. auris in vitro and respond with oxidative burst. (a) Human neutrophils were infected with different Candida strains at an MOI of 5. Phorbol 12-myristate 13-acetate (PMA) was used as a positive control. Results are shown as Area Under Curve (AUC) based on the ROS measurement presented in (b) n = 8, mean ± SD (B) ROS measurement over the course of co-incubation of different Candida strains with human neutrophils in vitro. MOI 5; n = 8; *** p ≤ 0.001 vs. C. auris (c) Human neutrophils were treated with PMA and in parallel infected with the indicated Candida spp. at an MOI of 10 to detect fungal ROS detoxification. Results are shown as AUC of the ROS measurement. n ≥ 7;  *** p ≤ 0.001 vs. PMA.
Figure 9.
Figure 9.
C. auris survival of neutrophil infection. (a) Survival of C. auris after 60 min or 180 min co-incubation with human neutrophils in vitro, determined by CFU quantification. n = 6, mean ± SD; *** p≤ 0.001 (b) Induction of ROS in human neutrophils after co-incubation with C. auris compared to C. auris pre-starved in water (H2O*C. auris) over 6 days. n = 6, mean ± SD; ** p≤ 0.005 .

References

    1. Perlroth J, Choi B, Spellberg B.. Nosocomial fungal infections: epidemiology, diagnosis, and treatment. Med Mycol. 2007;45(4):321–346. - PubMed
    1. Wisplinghoff H, Ebbers J, Geurtz L, et al. Nosocomial bloodstream infections due to Candida spp. in the USA: species distribution, clinical features and antifungal susceptibilities. Int J Antimicrob Agents. 2014;43(1):78–81. - PubMed
    1. Pfaller MA, Diekema DJ. Epidemiology of invasive candidiasis: a persistent public health problem. Clin Microbiol Rev. 2007;20(1):133–163. - PMC - PubMed
    1. Guinea J. Global trends in the distribution of Candida species causing candidemia. Clin Microbiol Infect. 2014;20(6):5–10. - PubMed
    1. Turner SA, Butler G. The Candida pathogenic species complex. Cold Spring Harb Perspect Med. 2014;4(9):a019778. - PMC - PubMed

Publication types

Substances