. 2022 Feb 10:11:e71361.
doi: 10.7554/eLife.71361.

Human embryoid bodies as a novel system for genomic studies of functionally diverse cell types

Affiliations

Human embryoid bodies as a novel system for genomic studies of functionally diverse cell types

Katherine Rhodes et al. Elife. .

Abstract

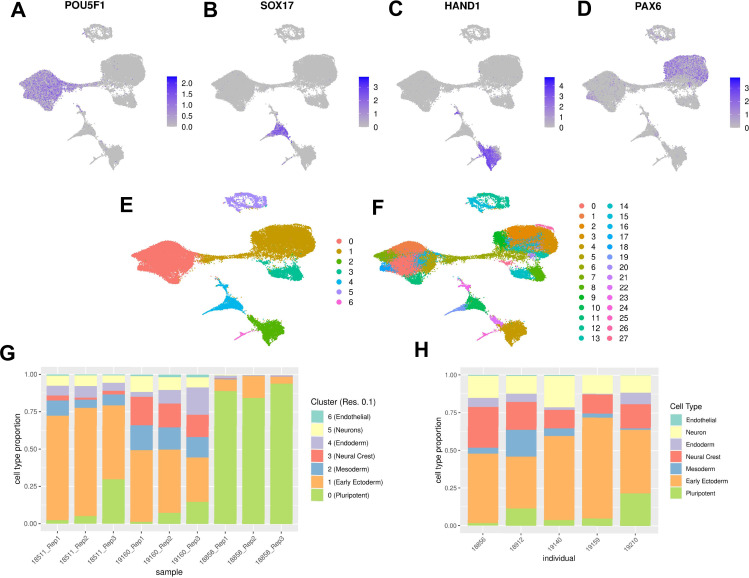
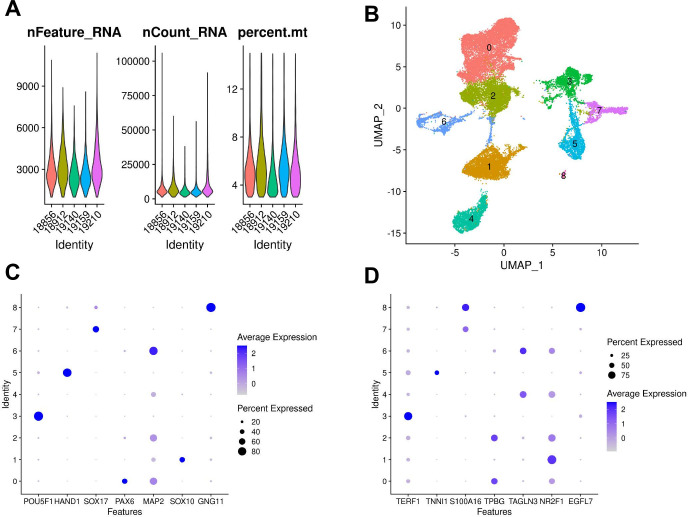
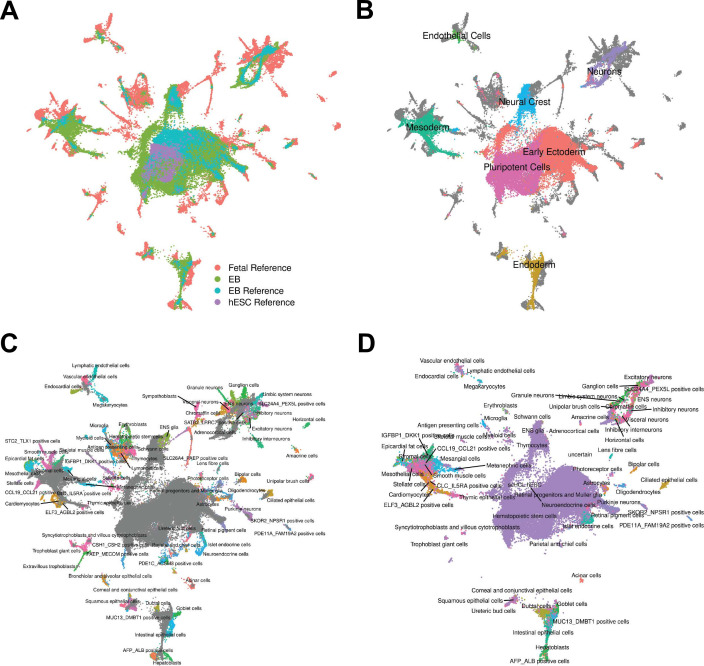
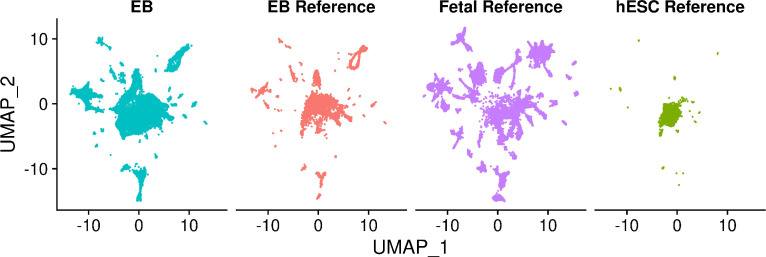
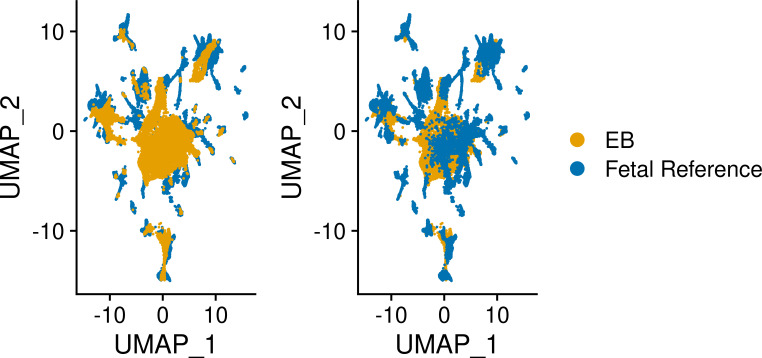
Practically all studies of gene expression in humans to date have been performed in a relatively small number of adult tissues. Gene regulation is highly dynamic and context-dependent. In order to better understand the connection between gene regulation and complex phenotypes, including disease, we need to be able to study gene expression in more cell types, tissues, and states that are relevant to human phenotypes. In particular, we need to characterize gene expression in early development cell types, as mutations that affect developmental processes may be of particular relevance to complex traits. To address this challenge, we propose to use embryoid bodies (EBs), which are organoids that contain a multitude of cell types in dynamic states. EBs provide a system in which one can study dynamic regulatory processes at an unprecedentedly high resolution. To explore the utility of EBs, we systematically explored cellular and gene expression heterogeneity in EBs from multiple individuals. We characterized the various cell types that arise from EBs, the extent to which they recapitulate gene expression in vivo, and the relative contribution of technical and biological factors to variability in gene expression, cell composition, and differentiation efficiency. Our results highlight the utility of EBs as a new model system for mapping dynamic inter-individual regulatory differences in a large variety of cell types.

Keywords: embryoid bodies; genetics; genomics; human; iPSC; scRNA-seq; single cell.

Plain language summary

One major goal of human genetics is to understand how changes in the way genes are regulated affect human traits, including disease susceptibility. To date, most studies of gene regulation have been performed in adult tissues, such as liver or kidney tissue, that were collected at a single time point. Yet, gene regulation is highly dynamic and context-dependent, meaning that it is important to gather data from a greater variety of cell types at different stages of their development. Additionally, observing which genes switch on and off in response to external treatments can shed light on how genetic variation can drive errors in gene regulation and cause diseases. Stem cells can produce more cells like themselves or differentiate – acquire the characteristics – of many cell types. These cells have been used in the laboratory to research gene regulation. Unfortunately, these studies often fail to capture the complex spatial and temporal dynamics of stem cell differentiation; in particular, these studies are unable to observe gene regulation in the transient cell types that appear early in embryonic development. To overcome these limitations, scientists developed systems such as embryoid bodies: three-dimensional aggregates of stem cells that, when grown under certain conditions, spontaneously develop into a variety of cell types. Rhodes, Barr et al. wanted to assess the utility of embryoid bodies as a model to study how genes are dynamically regulated in different cell types, by different individuals who have distinct genetic makeups. To do this, they grew embryoid bodies made from human stem cells from different individuals to examine which genes switched on and off as the stem cells that formed the embryoid bodies differentiated into different types of cells. The results showed that it was possible to grow embryoid bodies derived from genetically distinct individuals that consistently produce diverse cell types, similar to those found during human fetal development. Rhodes, Barr et al.’s findings suggest that embryoid bodies are a useful model to study gene regulation across individuals with different genetic backgrounds. This could accelerate research into how genetics are associated with disease by capturing gene regulatory dynamics at an unprecedentedly high spatial and temporal resolution. Additionally, embryoid bodies could be used to explore how exposure to different environmental factors during early development affect disease-related outcomes in adulthood in different individuals.


Conflict of interest statement

KR KR is named as an inventor with the University of Chicago on a patent related to the this manuscript (patent pending 63/291,945), KB KAB is named as an inventor with the University of Chicago on a patent related to the this manuscript (patent pending 63/291,945), JP, BS No competing interests declared, AB AB is a consultant for Third Rock Ventures, LLC and a shareholder in Alphabet, Inc, YG YG is named as an inventor with the University of Chicago on a patent related to the this manuscript (patent pending 63/291,945)

Figures

Figure 1.
Figure 1.. Characterization of EB cell type composition using marker gene expression and clustering.
(A–F) Visualization of EB cells with UMAP. (A) Cells from lines 18511, 18858, and 19160 colored by expression of pluripotent marker gene POU5F1, (B) Cells from lines 18511, 18858, and 19160 colored by expression of endoderm marker gene SOX17, (C) Cells from lines 18511, 18858, and 19160 colored by expression of mesoderm marker gene HAND1, (D) Cells from lines 18511, 18858, and 19160 colored by expression of early ectoderm marker gene PAX6. In A-D cells are colored by normalized counts. (E) Cells from lines 18511, 18858, and 19160 colored by Seurat cluster assignment at clustering resolution 0.1. (F) Cells from lines 18511, 18858, and 19160 colored by Seurat cluster assignment at clustering resolution 1. (G) Proportions of cells from replicates of lines 18511, 18858, and 19160 assigned to Seurat clusters at clustering resolution 0.1. (H) Proportions of cells from additional lines assigned to broad cell types present in EBs.
Figure 1—figure supplement 1.
Figure 1—figure supplement 1.. Quality metrics after filtering.
(Left) Violin plot showing the total UMI counts in cells from each individual in each replicate after filtering. (Right) Violin plot showing the number of genes (features) expressed in cells of each individual and each replicate after filtering.
Figure 1—figure supplement 2.
Figure 1—figure supplement 2.. Seurat clusters identified at clustering resolution 0.5 (Left) and 0.8 (Right).
Figure 1—figure supplement 3.
Figure 1—figure supplement 3.. UMAP visualization of cells from individual 18858 only.
Cells are colored by cluster assignment at resolution 0.1. Cluster 0 corresponds to pluripotent cells, cluster 1 to early ectoderm, cluster 2 to mesoderm, cluster 3 to neural crest, cluster 4 to endoderm, cluster 5 to neurons, and cluster 6 to endothelial cells.
Figure 1—figure supplement 4.
Figure 1—figure supplement 4.. Cell type composition of additional YRI lines.
(A) Quality control metrics for each of the five new lines after filtering (B) UMAP visualization of cells from additional lines colored by Seurat cluster assignment at resolution 0.15. (C) Dot plot showing expression of canonical marker genes in each Seurat cluster at resolution 0.15 (POU5F1 marks pluripotent cells, HAND1 marks mesoderm, SOX17 marks endoderm, PAX6 marks early ectoderm, SOX10 marks neural crest, GNG11 marks endothelial cells). (D) Dot plot showing expression of cluster markers learned from prior differential expression analysis in EB clusters from lines 18858, 18511, and 19160 (see Table 1).
Figure 2.
Figure 2.. Reference Integration and cell type annotation with lines 18511, 18858, and 19160.
(A) UMAP visualization of EB cells from this study and cells from reference data sets of fetal cell types, Day 20 EBs, and hESCs after integration. Cells are colored by data set. (B) UMAP visualization of EB cells from this study and cells from the fetal reference after integration. Cells are colored by Seurat cluster identity at clustering resolution 0.1, with gray points representing cells from the fetal reference set. (C) UMAP visualization of EB cells from this study and data from the fetal reference after integration. Cells are colored by cell types present in the fetal reference data set, with gray points representing EB cells. (D) UMAP visualization of EB cells from this data set with annotations transferred from the fetal and hESC reference sets.
Figure 2—figure supplement 1.
Figure 2—figure supplement 1.. UMAP visualization of EB cells from lines 18511, 18858, and 19160 and cells from each reference set after integration of separated data set.
Figure 2—figure supplement 2.
Figure 2—figure supplement 2.. UMAP visualization of EB cells from lines 18511, 18858, and 19160 and fetal reference cells after integration.
Cells are colored by data set.
Figure 2—figure supplement 3.
Figure 2—figure supplement 3.. Differential expression of known marker genes in reference annotated EB cell types in cells from lines 18511, 18858, and 19160.
(Left) Volcano plot of DE genes in annotated cardiomyocytes compared to all other cell types with known cardiomyocyte marker genes labeled (MYL7, MYL4, TNNT2). (Middle) Volcano plot of DE genes in annotated hepatoblasts compared to all other cell types with known hepatoblast marker genes labeled (AFP, FGB, ACSS2). (Right) Volcano plot of DE genes in annotated mesothelial cells compared to all other cell types with known mesothelial marker genes labeled (NID2, COL1A1, COL6A3, COL3A1, COL6A1).
Figure 3.
Figure 3.. Reference Integration and cell type annotation with additional lines.
(A) UMAP visualization of EB cells from this study and cells from reference data sets of fetal cell types, Day 20 EBs, and hESCs after integration. Cells are colored by data set. (B) UMAP visualization of EB cells from this study and cells from the fetal reference after integration. Cells are colored by broad cell type category assigned using clustering and marker gene expression, with gray points representing cells from the fetal reference set. (C) UMAP visualization of EB cells from this study and data from the fetal reference after integration. Cells are colored by cell types present in the fetal reference data set, with gray points representing EB cells. (D) UMAP visualization of EB cells from this data set with annotations transferred from the fetal and hESC reference sets.
Figure 3—figure supplement 1.
Figure 3—figure supplement 1.. UMAP visualization of EB cells from lines five additional YRI lines and cells from each reference set after integration of separated data set.
Figure 3—figure supplement 2.
Figure 3—figure supplement 2.. UMAP visualization of EB cells from five additional YRI lines and fetal reference cells after integration.
Cells are colored by data set.
Figure 4.
Figure 4.. Topic modeling of EB cells.
(A) Structure plot showing the results of topic modeling at k = 6. Plot includes a random subset of 5,000 EB cells divided by Seurat cluster at resolution 0.1. (B) UMAP projection of cells colored by loading of topic 1. (C) Box plot showing the loading of topic 1 from the k = 6 topic analysis on each Seurat cluster at clustering resolution 0.1. (D) Box plot showing the loading of topic 1 from the k = 6 topic analysis on each Seurat cluster at clustering resolution 1. (E) Volcano plot showing genes differentially expressed between topic 1 and all other topics from the k = 6 topic analysis. Points are colored by the average count on the logarithmic scale.
Figure 4—figure supplement 1.
Figure 4—figure supplement 1.. UMAP visualization of k = 6 topic loadings.
Figure 4—figure supplement 2.
Figure 4—figure supplement 2.. Volcano plot showing genes differentially expressed in each topic from the k = 6 topic analysis.
Points are colored by the average count on the logarithmic scale. The top 10 driver genes of each topic are labeled.
Figure 4—figure supplement 3.
Figure 4—figure supplement 3.. Topic loadings on Seurat clusters across clustering resolutions.
Bar plots show the loading of each topic (from the k = 6 analysis) on each Seurat cluster at resolution 0.1 (A), resolution 0.5 (B), resolution 0.8 (C), and resolution 1 (D).
Figure 5.
Figure 5.. Exploration of the biological and technical variation in gene expression across EB cells.
(A) Heatmap showing hierarchical clustering of cells based on normalized gene expression. This analysis uses only genes expressed in at least 20% of cells in at least one cluster (at clustering resolution 0.1) and does not include ribosomal genes. (B) Violin plot showing the percent of variance in gene expression explained by cluster (resolution 0.1), replicate, and individual in this data set after partitioning variance in pseudobulk samples. (C) Violin plot showing the percent of variance in gene expression explained by cluster (resolution 0.1), replicate, and individual in this data set after partitioning variance at single-cell resolution.
Figure 5—figure supplement 1.
Figure 5—figure supplement 1.. Hierarchical clustering of samples’ individual-replicate groups by the proportions of cells from each group assigned to each Seurat cluster across clustering resolutions.
Figure 5—figure supplement 2.
Figure 5—figure supplement 2.. Hierarchical clustering of samples’ individual-replicate groups by the loading of each topic with k = 6, k = 10, k = 15, k = 25, and k = 30 topics.
Figure 5—figure supplement 3.
Figure 5—figure supplement 3.. Variance explained by biological and technical factors at higher clustering resolutions.
Violin plots showing the percent of variance in gene expression explained by cluster, replicate, and individual in this data set after partitioning variance in pseudobulk samples.
Figure 5—figure supplement 4.
Figure 5—figure supplement 4.. Variance partitioning by Seurat cluster using pseudobulk samples.
Violin plots showing the percent of variance in gene expression explained by replicate and individual in each Seurat cluster (clustering resolution 0.1).
Figure 5—figure supplement 5.
Figure 5—figure supplement 5.. Median percent of variance explained by replicate and individual in each cluster using pseudobulk samples.
Figure 6.
Figure 6.. Power to detect eQTLs.
Power is a function of effect size, sample size, experiment size, and significance level. Power curves are computed for a range of sample sizes and experiment sizes (cells per individual). The horizontal red line represents a power to detect eQTLs of 0.80.
Figure 7.
Figure 7.. Trajectory inference and identification of dynamic gene modules.
(A–C) PAGA graphs highlighting the neuronal lineage (A), the hepatic lineage (B), and the endothelial lineage (C). Nodes are defined by Seurat clusters at resolution 1. (D–F) Heatmaps showing the frequency with which individual-replicate groups were assigned to the same cluster after running split-GPM 10 times in the neuronal, hepatic, and endothelial lineages.
Figure 7—figure supplement 1.
Figure 7—figure supplement 1.. Trajectory inference with PAGA.
(A) Force atlas plot of EB cells colored by broad cell type categories corresponding to Seurat clusters identified at clustering resolution 0.1 (see Table 1). (B) Force atlas plot of EB cells colored by Seurat cluster at clustering resolution 1. (C) PAGA graph showing inferred edges between Seurat clusters defined at clustering resolution 1. (D) Diffusion pseudotime values across EB cells visualized with force atlas.
Figure 7—figure supplement 2.
Figure 7—figure supplement 2.. Marker gene expression in Seurat clusters aids tracing of developmental lineages.
PAGA graphs where nodes are colored by normalized expression of marker genes for pluripotency (POU5F1), primitive streak (MIXL1), endoderm (SOX17), hepatocytes (AFP), mesoderm (HAND1), endothelial cells (GNG11), early ectoderm (PAX6), neurons (MAP2 and NEUROD1).
Figure 7—figure supplement 3.
Figure 7—figure supplement 3.. Cluster assignment by Split-GPM and gene set enrichment in the neuronal lineage.
(A) Dynamic expression patterns of identified gene modules in each cluster of replicate-individual samples. (B) Table showing Bonferonni-adjusted p-values from gene set enrichment analysis of gene modules. (C) splitGPM cluster assignments of each individual-batch sample based on shared patterns of dynamic gene expression.
Figure 7—figure supplement 4.
Figure 7—figure supplement 4.. Cluster assignment by Split-GPM and gene set enrichment in the hepatic lineage.
(A) Dynamic expression patterns of identified gene modules in each cluster of replicate-individual samples. (B) Table showing Bonferonni-adjusted p-values from gene set enrichment analysis of gene modules. (C) SplitGPM cluster assignments of each individual-batch sample based on shared patterns of dynamic gene expression.
Figure 7—figure supplement 5.
Figure 7—figure supplement 5.. Cluster assignment by Split-GPM and gene set enrichment in the endothelial lineage.
(A) Dynamic expression patterns of identified gene modules in each cluster of replicate-individual samples. (B) Table showing Bonferonni-adjusted p-values from gene set enrichment analysis of gene modules. (C) SplitGPM cluster assignments of each individual-batch sample based on shared patterns of dynamic gene expression.
Author response image 1.
Author response image 1.. Same-Sample doublet detection test.
(A) Table comparing the demuxlet cell assignments to the DoubletFinder assignments. (B) UMAP plot showing cells colored by normalized expression of marker genes for pluripotency (POU5F1), early ectoderm (PAX6), mesoderm (HAND1), and endoderm (SOX17). (C) UMAP plot showing cells colored by DoubletFinder’s pANN (proportion of artificial k nearest neighbors) metric, where cells with the highest pANN are assigned as doublets based on a given threshold. (D) UMAP plot showing cells colored by DoubletFinder assignment (D) UMAP plots split by cells of each demuxlet assignment and colored by cluster assignment as resolution 0.8.

References

    1. Aguet F, Brown A, Castel S, Davis J, Battle A, Brown CD, Engelhardt BE, Montgomery SB. Genetic effects on gene expression across human tissues. Nature. 2017;550:204–213. doi: 10.1038/nature24277. - DOI - PMC - PubMed
    1. Albert FW, Kruglyak L. The role of regulatory variation in complex traits and disease. Nature Reviews. Genetics. 2015;16:197–212. doi: 10.1038/nrg3891. - DOI - PubMed
    1. Auton A, Brooks LD, Durbin RM, Garrison EP, Kang HM, Korbel JO, Marchini JL, McCarthy S, McVean GA, Abecasis GR. A global reference for human genetic variation. Nature. 2015;526:68–74. doi: 10.1038/nature15393. - DOI - PMC - PubMed
    1. Banovich NE, Li YI, Raj A, Ward MC, Greenside P, Calderon D, Tung PY. Impact of Regulatory Variation across Human IPSCs and Differentiated Cells. Genome Research. 2018;28:122–131. doi: 10.1101/gr.224436.117. - DOI - PMC - PubMed
    1. Becht E, McInnes L, Healy J, Dutertre CA, Kwok IWH, Ng LG, Ginhoux F, Newell EW. Dimensionality reduction for visualizing single-cell data using UMAP. Nature Biotechnology. 2018;37:38–44. doi: 10.1038/nbt.4314. - DOI - PubMed

Publication types

Associated data